Effects of Origins of Soybean Meal on Growth Performance, Nutrient Retention and Excreta Microflora of Broilers
Yun Ku, Santosh Laxman Ingale, Jin Soo Kim, Kwang Hyun Kim, Su Hyup Lee and Byung Jo Chae
†College of Animal Life Sciences, Kangwon National University, Chuncheon 200-701, Republic of Korea
ABSTRACT An experiment was conducted to determine the effects of origins of soybean meal (SBM) on growth per- formance, nutrients and energy retention and fecal microflora in broilers. The SBM originating from Korea, Brazil and India were used. A total of 480 broiler chicks (average initial BW, 41.8 g) were randomly allotted to 6 treatments. Each treatment had 4 replicate pens with 20 chicks per pen. Birds were fed diets containing SBM originated from Korea (domestic SBM), Brazil or India (imported SBM) and the diets were based on the total amino acid (TAA) or true digestible amino acid (TDAA). Experimental diets were fed in two phases, starter (d 0~21) and finisher (d 22~35). The overall weight gain, feed intake and FCR were better (P<0.05) in birds fed Korean SBM. During starter and finisher periods, birds fed diets containing Korean SBM had greater (P<0.05) retention of GE, DM, and CP (P<0.05) as compared with Birds fed diets containing SBM from India. In addition, diets formulated on TDAA basis had grater (P<0.05) CP retention during starter period and DM, GE and CP retention during finisher period. There were no differences (P>0.05) in the excreta microflora and overall feed cost per kg body weight gain in birds fed SBM from different origins; however, diets formulated on TDAA basis had lesser (P<0.05) feed cost per kg body weight gain in birds when compared with diets formulated on TAA basis. These results indicate that Korean SBM has better nutrients digestibility than SMB originated from Brazil and India, which contributes to the improved performance of broilers. In addition, better performance was obtained when diets were formulated on TIDAA basis.
(Key words : origin of soybean meal, growth performance, nutrient digestibility, excreta microflora, economic analysis)
†
To whom correspondence should be addressed : [email protected]
INTRODUCTION
Soybean-meal (SBM) is the most commonly used feed ingredient in the diet of non-ruminant animals because of its relatively high protein contents, excellent amino acid profile and dependable supply (Kim et al., 1999; Cromwell, 2000).
In pigs and poultry diets, SBM account for approximately 62% of proteinaceous ingredients (ASA, 2002). Because of the good amino acid profile, SBM is usually used to balance the dietary amino acid levels with cereal grains and their byproducts in poultry feeds. United State is a leading producer of soybean (37%), followed by Brazil (26%), China (21%), Argentina (17%) and India (4%; USDA, 2009). Un- like most plant-originated protein sources, SBM contains a relatively large amount of lysine. However, SBM is low in sulfur-containing amino acids, with methionine being the most significant limiting amino acid for poultry, followed by cystine and threonine (Eggum and Beames, 1983). Also,
SBM contains some antinutritional factors such as trypsin inhibitor, lectins and lipoxygenase (Ward, 1996). These anti- nutritional are destroyed by heat treatment before inclusion of SBM in poultry diets. However, improper heat treatments destroy or denature the proteins in SBM, which results in the variation in nutrients contents of SBM from different batches or origins (Araba and Dale, 1990; Lee and Garlich, 1992).
Several studies have shown considerable differences in
nutrient content of SBM within and among geographic re-
gions of the world (Baize, 1997; Grieshop et al., 2003). Be-
cause of difference in environmental conditions, genetics
varieties and processing conditions, SBM chemical compo-
sitions including contents of oligosaccharides, protease inhi-
bitors and fiber differs among different geographic regions
(Baker and Stein, 2009; Kumar et al., 2010). This results in
the variation in nutrient digestibility and performance of food
producing animals fed SBM originated from different regions
(Grieshop and Fahey, 2001; Karr-Lilienthal et al., 2005; van
Kempen et al., 2006). However, little research has been done on comparing the effects of origin of SBM on the per- formance and nutrients digestibility in broilers. Therefore, in this experiment, SBM obtained from three countries (Korea, Brazil and India) was evaluated for its influence on per- formance, nutrient retention, excreta microbial populations and economic analysis in broilers. Additionally, comparisons were made with diets formulated based on total amino acid (TAA) and true digestibility amino acid (TDAA).
MATERIALS AND METHODS
The protocol for this experiment was approved and birds were cared according to the guidelines of the Institutional Animal Care and Use Committee of Kangwon National Uni- versity, Chuncheon, Republic of Korea.
1. Birds and Diets
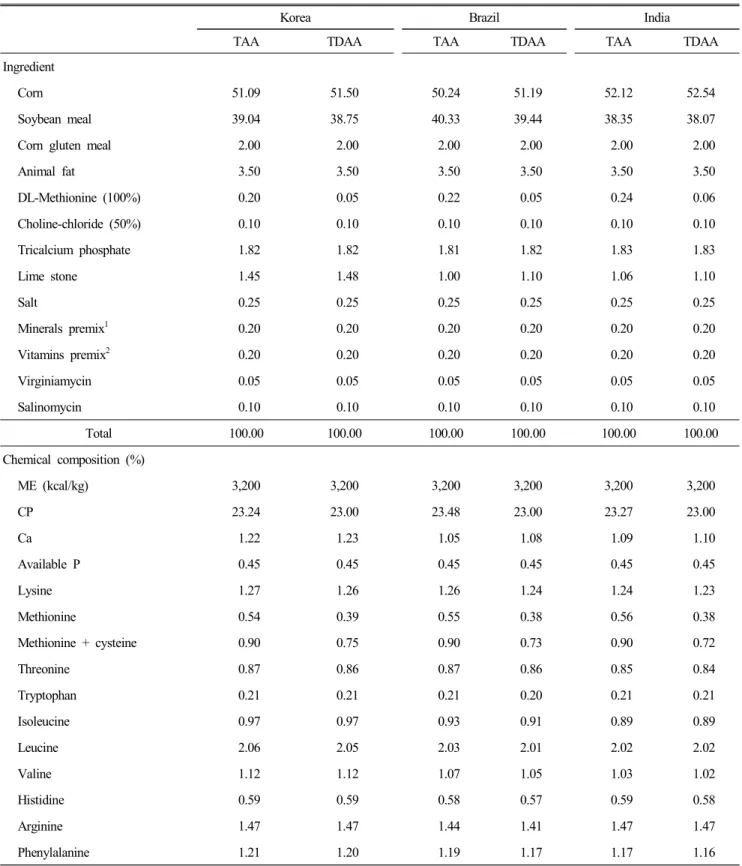
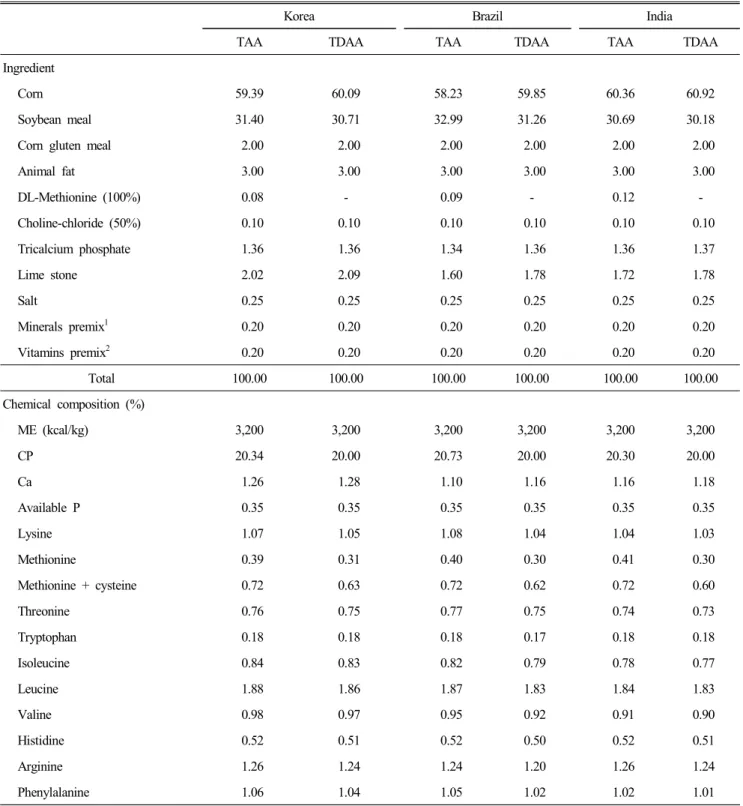
A total of 480 broilers (initial BW, 41.8 g) were randomly allotted to 6 treatments on the basis of BW. Each treatment had 4 replicate pens with 20 chicks per pen. Broilers were fed diets containing SBM originated from Korea (domestic), Brazil or India (imported) and the diets were based on the total amino acid (TAA) or true digestible amino acid (TDAA). Korean SBM was freshly prepared (one month before experimental feeding), while SBM imported from India and Brazil were prepared 4 months before the experi- mental feeding. The main objective of this experiment was to compare the effect of origin of SBM when diets containing SBM from different origins were formulated based on TAA and TDAA basis. Treatment diets containing domestic and imported (Brazil and India), were formulated based on TAA and TDAA. Experimental diets were fed in two phases, starter (d 0 ~21) and finisher (d 22~35). Diets for starter (Table 1) were formulated to contain 3,200 kcal/kg of ME and 23.0 % of CP. Diets for finisher (Table 2) were formulated to contain 3,200 kcal/kg ME and 20.0 % of CP.
All diets met or exceeded the nutrient requirements, as sug- gested by the NRC (1994).
The birds were housed in rice hull-covered floor pens.
Each pen was provided with a self-feeder and hanging bell drinker to allow free access to feed and water. The house
temperature was maintained at 34 ℃ for the first 5 days and then gradually reduced according to normal management practices, until a temperature of 23 ℃ was achieved. Lighting was provided for 23 h/d.
2. Experimental Procedures
The pen weight (at d 1, 21 and 35) and pen feed intake (FI) was noted at the end of each phase to calculate BW gain and feed conversion ratio (FCR) for starter and finisher phases. Overall FI, BW gain, and FCR were calculated for whole duration of experiment. Two nutrient retention trials were conducted by using 2 birds from each pen by housing them in individual metabolic cages. These birds were fed the diets containing chromic oxide (0.25%) during the last 7 days of each starter and finisher phase and excreta samples were collected for the last 3 days. The excreta samples of these birds collected over a 3-d period were pooled to represent 1 pen. Excreta were dried in a forced-air drying oven at 60℃
for 3 d and ground to pass through a 1-mm screen using a hammer mill (Buhler, Switzerland) for chemical analysis.
Additionally, excreta samples were collected from each bird used for digestibility trial for microbial analysis.
3. Chemical and Microbial Analysis
Experimental diets and excreta samples were analyzed in triplicate for DM (Method 930.15), CP (Method 990.03), ash (method 942.05), Ca and P (Method 985.01) according to AOAC (2007) methods. Gross energy of diets and excreta were measured by a bomb calorimeter (Model 1261, Parr Instrument Co., Molin, IL), and chromium concentrations was determined with an automated spectrophotometer (Jasco V- 650, Jasco Corp., Tokyo, Japan) according to the procedure of Fenton and Fenton (1979).
The microbiological assay of fecal samples was carried out by the procedure suggested by Choi et al. (2011). In short, microbial groups analyzed were Clostridium spp. (Tryptose sulphite cycloserine agar), Bifidobacterium spp. (MRS agar + 0.02% NaN
3+ 0.05% L-cystine hydrochloride monohydrate), Lactobacillus (MRS agar + 0.02% NaN
3+ 0.05% L-cystine hydrochloride monohydrate) and coliforms (violet red bile agar). The tryptic soy agar (No. 236950), MRS agar (No.
288130), violet red bile agar (No. 216695), plate count agar
Table 1. Formula and chemical composition of experimental starter diets (d 0 ~21)
Korea Brazil India
TAA TDAA TAA TDAA TAA TDAA
Ingredient
Corn 51.09 51.50 50.24 51.19 52.12 52.54
Soybean meal 39.04 38.75 40.33 39.44 38.35 38.07
Corn gluten meal 2.00 2.00 2.00 2.00 2.00 2.00
Animal fat 3.50 3.50 3.50 3.50 3.50 3.50
DL-Methionine (100%) 0.20 0.05 0.22 0.05 0.24 0.06
Choline-chloride (50%) 0.10 0.10 0.10 0.10 0.10 0.10
Tricalcium phosphate 1.82 1.82 1.81 1.82 1.83 1.83
Lime stone 1.45 1.48 1.00 1.10 1.06 1.10
Salt 0.25 0.25 0.25 0.25 0.25 0.25
Minerals premix
10.20 0.20 0.20 0.20 0.20 0.20
Vitamins premix
20.20 0.20 0.20 0.20 0.20 0.20
Virginiamycin 0.05 0.05 0.05 0.05 0.05 0.05
Salinomycin 0.10 0.10 0.10 0.10 0.10 0.10
Total 100.00 100.00 100.00 100.00 100.00 100.00
Chemical composition (%)
ME (kcal/kg) 3,200 3,200 3,200 3,200 3,200 3,200
CP 23.24 23.00 23.48 23.00 23.27 23.00
Ca 1.22 1.23 1.05 1.08 1.09 1.10
Available P 0.45 0.45 0.45 0.45 0.45 0.45
Lysine 1.27 1.26 1.26 1.24 1.24 1.23
Methionine 0.54 0.39 0.55 0.38 0.56 0.38
Methionine + cysteine 0.90 0.75 0.90 0.73 0.90 0.72
Threonine 0.87 0.86 0.87 0.86 0.85 0.84
Tryptophan 0.21 0.21 0.21 0.20 0.21 0.21
Isoleucine 0.97 0.97 0.93 0.91 0.89 0.89
Leucine 2.06 2.05 2.03 2.01 2.02 2.02
Valine 1.12 1.12 1.07 1.05 1.03 1.02
Histidine 0.59 0.59 0.58 0.57 0.59 0.58
Arginine 1.47 1.47 1.44 1.41 1.47 1.47
Phenylalanine 1.21 1.20 1.19 1.17 1.17 1.16
1
Provided per kg diet: 80 mg Fe, 80 mg Cu, 100 mg Zn, 120 mg Mn, 2 mg I, 0.1 mg Co, 0.2 mg Se.
2
Provided per kg diet: 18,000 IU vitamin A, 3,600 IU vitamin D
3, 20 mg vitamin E, 2 mg vitamin K, 2 mg vitamin B
1, 8 mg vitamin
B
2, 4 mg vitamin B
6, 0.04 mg vitamin B
12, 24 mg pantothenic acid, 60 mg niacin, 1 mg folic acid and 0.06 mg biotin.
Table 2. Formula and chemical composition of experimental finisher diets (d 22 ~35)
Korea Brazil India
TAA TDAA TAA TDAA TAA TDAA
Ingredient
Corn 59.39 60.09 58.23 59.85 60.36 60.92
Soybean meal 31.40 30.71 32.99 31.26 30.69 30.18
Corn gluten meal 2.00 2.00 2.00 2.00 2.00 2.00
Animal fat 3.00 3.00 3.00 3.00 3.00 3.00
DL-Methionine (100%) 0.08 - 0.09 - 0.12 -
Choline-chloride (50%) 0.10 0.10 0.10 0.10 0.10 0.10
Tricalcium phosphate 1.36 1.36 1.34 1.36 1.36 1.37
Lime stone 2.02 2.09 1.60 1.78 1.72 1.78
Salt 0.25 0.25 0.25 0.25 0.25 0.25
Minerals premix
10.20 0.20 0.20 0.20 0.20 0.20
Vitamins premix
20.20 0.20 0.20 0.20 0.20 0.20
Total 100.00 100.00 100.00 100.00 100.00 100.00
Chemical composition (%)
ME (kcal/kg) 3,200 3,200 3,200 3,200 3,200 3,200
CP 20.34 20.00 20.73 20.00 20.30 20.00
Ca 1.26 1.28 1.10 1.16 1.16 1.18
Available P 0.35 0.35 0.35 0.35 0.35 0.35
Lysine 1.07 1.05 1.08 1.04 1.04 1.03
Methionine 0.39 0.31 0.40 0.30 0.41 0.30
Methionine + cysteine 0.72 0.63 0.72 0.62 0.72 0.60
Threonine 0.76 0.75 0.77 0.75 0.74 0.73
Tryptophan 0.18 0.18 0.18 0.17 0.18 0.18
Isoleucine 0.84 0.83 0.82 0.79 0.78 0.77
Leucine 1.88 1.86 1.87 1.83 1.84 1.83
Valine 0.98 0.97 0.95 0.92 0.91 0.90
Histidine 0.52 0.51 0.52 0.50 0.52 0.51
Arginine 1.26 1.24 1.24 1.20 1.26 1.24
Phenylalanine 1.06 1.04 1.05 1.02 1.02 1.01
1
Provided per kg diet: 80mg Fe, 80 mg Cu, 100 mg Zn, 120 mg Mn, 2 mg I, 0.1 mg Co, 0.2 mg Se.
2
Provided per kg diet: 18,000 IU vitamin A, 3,600 IU vitamin D
3, 20 mg vitamin E, 2 mg vitamin K, 2 mg vitamin B
1, 8 mg vitamin B
2, 4 mg vitamin B
6, 0.04 mg vitamin B
12, 24 mg pantothenic acid, 60 mg niacin, 1 mg folic acid and 0.06 mg biotin.
(No. 247940), and potato dextrose agar (No. 213400) used were purchased from Difco Laboratories (Detroit, MI), and
TSC agar (CM0589) was purchased from Oxoid (Hampshire,
UK).
4. Economic Analysis
The feed cost (FC) was calculated based on the price of ingredients used and this FC was used to calculate the feed cost per kg body weight gain (FCG) by using the following formula: FCG = TFI×FC/TWG; TFI = total feed intake and TWG = total weight gain per broiler (kg).
5. Statistical Analysis
Statistical analysis was conducted by using the GLM procedure of SAS (1996). Pens were used as the experi- mental unit for all the parameters. An independent t-test was used to compare among SBMs from Korean and imported origin, Korean and Brazil origin, and Korean and India ori- gin, while additional comparisons were made among diets formulated on the basis of TAA and TIDAA. To enhance the interpretation of the results, the mean separations were analy- zed using the Student-Newman-Keuls multiple range test. P-
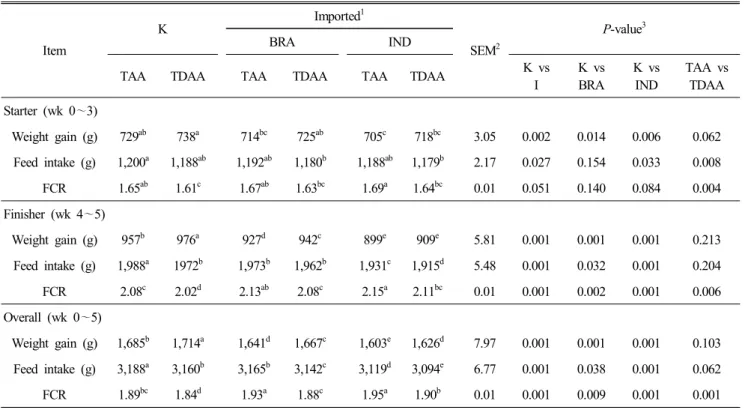
Table 3. Effects of origin of soybean meal on growth performance of broilers
Item
K
Imported
1SEM
2P-value
3BRA IND
TAA TDAA TAA TDAA TAA TDAA K vs
I
K vs BRA
K vs IND
TAA vs TDAA Starter (wk 0 ~3)
Weight gain (g) 729
ab738
a714
bc725
ab705
c718
bc3.05 0.002 0.014 0.006 0.062
Feed intake (g) 1,200
a1,188
ab1,192
ab1,180
b1,188
ab1,179
b2.17 0.027 0.154 0.033 0.008
FCR 1.65
ab1.61
c1.67
ab1.63
bc1.69
a1.64
bc0.01 0.051 0.140 0.084 0.004
Finisher (wk 4 ~5)
Weight gain (g) 957
b976
a927
d942
c899
e909
e5.81 0.001 0.001 0.001 0.213
Feed intake (g) 1,988
a1972
b1,973
b1,962
b1,931
c1,915
d5.48 0.001 0.032 0.001 0.204
FCR 2.08
c2.02
d2.13
ab2.08
c2.15
a2.11
bc0.01 0.001 0.002 0.001 0.006
Overall (wk 0 ~5)
Weight gain (g) 1,685
b1,714
a1,641
d1,667
c1,603
e1,626
d7.97 0.001 0.001 0.001 0.103 Feed intake (g) 3,188
a3,160
b3,165
b3,142
c3,119
d3,094
e6.77 0.001 0.038 0.001 0.062
FCR 1.89
bc1.84
d1.93
a1.88
c1.95
a1.90
b0.01 0.001 0.009 0.001 0.001
ab
Values with different superscripts of the same row are significantly different (p<0.05).
1
BRA = Brazil; IND = India.
2
Pooled standard error of mean.
3
K vs I = Korean vs Imported (India and Brazil); K vs BRA = Korean vs Brazil; K vs IND = Korean vs India; TAA vs TDAA = total amino acid vs true digestible amino acid.
TAA = total amino acid; TDAA = true digestible amino acid.
values of less than 0.05 were considered statistically sig- nificant.
RESULTS AND DISCUSSION
1. Growth Performance
Growth performance of broilers fed diets containing SBM
from different origin is presented in Table 3. Birds fed the
Korean SBM had better (P<0.05) weight gain (starter, fini-
sher and overall), feed intake (starter, finisher and overall)
and FCR (finisher and overall) when compared with birds fed
imported SBM (India + Brazil). In addition, birds fed Korean
SBM had better (P<0.05) weight gain (starter, finisher and
overall) feed intake and FCR (finisher and overall) than birds
fed diets with Brazilian SBM. Also, weight gain (starter, fini-
sher and overall), feed intake (starter, finisher and overall)
and FCR(finisher and overall) were better (P<0.05) in birds
fed Korean SBM diet than birds fed diets containing Indian SBM. In comparison with diets formulated on TAA basis, diets formulated on TDAA basis resulted in greater (P<0.05) feed intake (starter) and improved feed efficiency (starter, finisher and overall).
Soybean meal (SBM) is a major protein source in poultry feeds and one of the best quality ingredients. Because of the relatively good amino acid profile, it is usually used to balance the dietary amino acid levels with cereal grains and their byproducts in poultry feeds. In the present study, broiler fed the diets containing SBM originated form Korea had greater growth performance than broilers fed diets containing SBM originated from India or Brazil. Results obtained in the present study are in good agreement with data reported by Leeson et al. (1987), Lee et al. (1994) and Joo et al. (1994).
Some of the previous studies also reported greater growth performance of broiler fed Korean native SBM than broiler fed SBM from Brazil or India (Park and Baik, 1997; Park et al., 2002). Greater performance of broiler fed Korean SBM might be due variation in amino acid profile of SBM from different origin and quality of nutrients due difference in storage period. In the present study, we used freshly prepared Korean SBM (one month before experimental feeding), while SBM imported from India and Brazil were prepared 4 months before the experimental feeding. It has reported that longer storage of SBM under unsecured condition results in decrea- sed nutritional quality of SBM (Narayan et al., 1988). The discrepancy in growth performance of broilers fed diets containing SBM from different origin also might be due to variation in quality of SBM due to variation in soybean processing conditions, such as moisture, drying time and drying temperature. Over and under processing due to impro- per heating conditions can result in the production of poor quality SBM (Araba and Dale, 1990). Over processing of SBM results in a portion of the lysine being rendered unava- ilable for pigs due to Maillard reaction; whereas under proce- ssed SBM contains high concentration of antinutritional fac- tors like trypsin inhibitors and saponins which decease the quality of SBM (Araba and Dale, 1990).
2. Nutrient Retention
Effects of origin of SBM on retention of energy and
nutrients are presented in Table 4. During starter and finisher periods, the retention of GE and CP was greater (P<0.05) in birds fed the diet containing Korean SBM as compared to birds fed the diets containing imported SBM (India + Brazil);
while the retention of CP during finisher period was greater (P<0.05) in birds fed diet containing Korean SBM than birds fed diet with Brazil SBM. Additionally, during starter and finisher periods, the retention of DM, GE and CP was greater (P<0.05) in birds fed diet having Korean SBM than birds fed India SBM diets. Broilers fed diets formulated on TDAA basis had greater (P<0.05) retention of CP during starter period and DM, GE and CP during finisher period as com- pared to birds fed diets formulated on TAA basis.
In the present study, retention of nutrients in birds fed the Korean SBM diet was greater than birds fed Indian or Bra- zilian SBM diets. Several studies have shown considerable differences in nutrient content of SBM within and among geographic regions of the world (Baize, 1997; Grieshop et al., 2003). Different growing conditions and the use of vari- ous soybean genotypes in these regions can affect nutrient composition including contents of oligosaccharides, protease inhibitors and fiber (Baker and Stein, 2009; Kumar et al., 2010). As a result, nutrient retention in different batches of SBM fed to nonruminants may differ (Karr-Lilienthal et al., 2005). Moreover, regional variations in processing condi- tions of the soybeans may also affect nutrient digestibility of SBM (Sauer and Ozimek, 1986). Thermal treatment during SBM processing, for example, is frequently applied to inac- tivate residual contents of trypsin inhibitors in SBM (Qin et al., 1998). However, so called under-toasting during proce- ssing of SBM may result in incomplete removal of some anti-nutritional factors (Araba and Dale, 1990) which, in turn, may decrease nutrient digestibility in these SBM. In the pre- sent study, variation in nutrients retention among birds fed diet containing SBM from different origin might be due to variation in contents of oligosaccharides, protease inhibitors and fiber in SBM from different origin. Our results indicates that the use of the Korean SBM in broiler diets could be economically advantageous to the broiler production due to its excellent protein quality, greater growth performance and digestibility of nutrients as reported in present study.
In this study, the performance and retention of nutrient in
Table 4. Effects of origin of soybean meal on apparent excreta nutrients digestibility of broilers
Item
K
Imported
1SEM
2P-value
3BRA IND
TAA TDAA TAA TDAA TAA TDAA D vs
I
D vs BRA
D vs IND
TAA vs TDAA Starter (d 0 ~21)
DM 72.04
ab72.29
a71.92
ab72.08
ab71.62
b71.95
ab0.08 0.085 0.423 0.036 0.133
GE 75.59
ab75.79
a75.20
ab75.38
ab75.07
b75.12
b0.09 0.001 0.061 0.002 0.433
CP 65.37
ab66.86
a64.19
bc66.46
a63.47
c64.46
bc0.32 0.009 0.299 0.001 0.009
Ash 39.70 39.80 39.21 39.52 38.42 38.88 0.33 0.301 0.565 0.258 0.669
Ca 29.88 30.01 29.21 29.82 29.03 29.12 0.37 0.337 0.619 0.342 0.723
P 27.58 27.30 27.58 27.55 27.14 27.13 0.51 0.937 0.937 0.761 0.920
Finisher (d 22 ~35)
DM 71.66
bc72.78
a71.46
bc72.14
ab71.04
c71.77
b0.14 0.071 0.213 0.035 0.001
GE 75.56
bc76.62
a75.25
bc75.80
ab74.79
c75.21
bc0.16 0.023 0.111 0.011 0.032
CP 61.24
ab62.76
a60.51
bc61.29
ab59.52
c60.69
bc0.27 0.007 0.039 0.010 0.032
Ash 32.43 33.02 31.40 32.36 30.91 31.53 0.34 0.054 0.223 0.092 0.294
Ca 28.85 29.86 27.11 27.96 27.73 27.32 0.56 0.253 0.274 0.262 0.680
P 22.71
ab23.56
a22.05
ab23.23
ab21.13
b22.04
ab0.29 b0.099 0.452 0.018 0.094
a~c
Values with different superscripts of the same row are significantly different (p<0.05).
1
BRA = Brazil; IND = India
2
Pooled standard error of mean.
3
K vs I = Korean vs Imported (India and Brazil); K vs BRA = Korean vs Brazil; K vs IND = Korean vs India; TAA vs TDAA = total amino acid vs true digestible amino acid.
birds fed diets formulated on the basis true ileal digestible amino acid (TIDAA) had greater than birds fed diets for- mulated on the basis of total amino acid (TAA). This might be due to greater availability of digestible amino acids in the diets formulated on TIDAA basis than TAA basis. Greater digestibility of amino acids and CP may result in more AA reaching organ systems of the birds which results into improved growth performance.
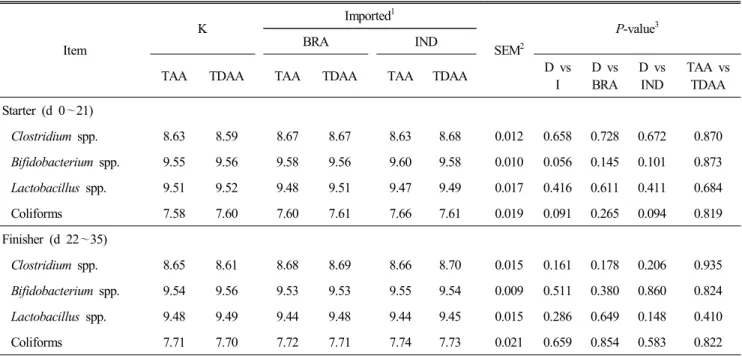
3. Microbial Populations
Data pertaining to effects of origin of SBM on excreta microflora population are presented in Table 5. Dietary treatments had no effect (P>0.05) on the number of Clos- tridium spp., Bifidobacterium spp., Lactobacillus spp. and coliforms in the excreta during starter and finisher period. It
has reported that dietary sources of fermentable carbohydrates and protein affect the host animal by improving its intestinal balance (Fuller, 1989) and creating gut micro-ecological conditions that suppress harmful microorganisms like Clos- tridium and Coliforms (Line et al., 1998; Pascual et al., 1999;
Shim et al., 2010), and by favoring beneficial microorga- nisms like Lactobacillus and Bifidobacterium. In the present experiment, there were no differences in microbial population among birds fed diets containing SBM from different origin.
This indicates that origin of SBM have no effects on fermentation pattern and intestinal microflora of broiler.
4. Economic Analysis
Economic analysis of broilers fed different SBM origin
diets is presented in Table 6. In spite of greater total weight
Table 5. Effects of origin of soybean meal on fecal microbial populations of pigs (log10 CFU/g)
Item
K
Imported
1SEM
2P-value
3BRA IND
TAA TDAA TAA TDAA TAA TDAA D vs
I
D vs BRA
D vs IND
TAA vs TDAA Starter (d 0 ~21)
Clostridium spp. 8.63 8.59 8.67 8.67 8.63 8.68 0.012 0.658 0.728 0.672 0.870
Bifidobacterium spp. 9.55 9.56 9.58 9.56 9.60 9.58 0.010 0.056 0.145 0.101 0.873
Lactobacillus spp. 9.51 9.52 9.48 9.51 9.47 9.49 0.017 0.416 0.611 0.411 0.684
Coliforms 7.58 7.60 7.60 7.61 7.66 7.61 0.019 0.091 0.265 0.094 0.819
Finisher (d 22 ~35)
Clostridium spp. 8.65 8.61 8.68 8.69 8.66 8.70 0.015 0.161 0.178 0.206 0.935
Bifidobacterium spp. 9.54 9.56 9.53 9.53 9.55 9.54 0.009 0.511 0.380 0.860 0.824
Lactobacillus spp. 9.48 9.49 9.44 9.48 9.44 9.45 0.015 0.286 0.649 0.148 0.410
Coliforms 7.71 7.70 7.72 7.71 7.74 7.73 0.021 0.659 0.854 0.583 0.822
1
BRA = Brazil; IND = India.
2
Pooled standard error of mean.
3
K vs I = Korean vs Imported (India and Brazil); K vs BRA = Korean vs Brazil; K vs IND = Korean vs India; TAA vs TDAA = total amino acid vs true digestible amino acid.
Table 6. Production cost of broilers as affected by soybean meal origin
Item
1K Imported
2SEM
3P-value
4BRA IND
TAA TDAA TAA TDAA TAA TDAA D vs
I
D vs BRA
D vs IND
TAA vs TDAA Starter (d 0 ~21)
FC( ₩/kg) 544 537 530 522 528 520
TWG (g/bird) 728
ab738
a713
bc725
ab704
c717
bc3.04 0.002 0.014 0.006 0.062 TFI (g/bird) 1,200
a1,187
ab1,192
ab1,180
b1,187
ab1,179
b2.17 0.027 0.154 0.033 0.008 FCG ( ₩/kg gain) 895
a864
bc886
ab849
c890
a855
c4.67 0.317 0.257 0.563 0.001 Finisher (d 22 ~35)
FC( ₩/kg) 521 516 512 505 509 503
TWG (g/bird) 956
b975
a926
d941
c898
e908
e5.80 <0.001 <0.001 <0.001 0.213 TFI (g/bird) 1,987
a1,972
b1,972
b1,962
b1,931
c1,914
d5.48 0.001 0.032 <0.001 0.204 FCG ( ₩/kg gain) 1,084
a1,044
c1,090
a1,052
bc1,094
a1,060
b4.31 0.303 0.536 0.240 <0.001 Overall (d 0 ~35)
TWG (g/bird) 1,685
b1,713
a1,640
d1,667
c1,603
e1,626
d7.97 <0.001 <0.001 <0.001 0.103
TFI (g/bird) 3,188
a3,159
b3,164
b3,142
c3,118
d3,094
e6.76 0.001 0.038 <0.001 0.062
FCG ( ₩/kg gain) 1,002
a967
b1,001
a964
b1,004
a970
b3.89 0.981 0.847 0.812 <0.001
Table 6. Production cost of broilers as affected by soybean meal origin
a~e
Values with different superscripts of the same row are significantly different (p<0.05).
1
FC, feed cost per kg; TWG, total weight gain per broiler; TFI, total feed intake per broiler; FCG, feed cost/kg body weight gain.
2
BRA = Brazil; IND = India.
3
Pooled standard error of mean.
4