Article
http://dx.doi.org/10.4217/OPR.2016.38.2.139 Ocean and Polar Research June 2016
제주도 근해 식물플랑크톤-동물플랑크톤-멸치-고등어 영양단계에서
210 Pb과 210 Po의 생물농축
조보은1,2 · 김석현1,2*
1한국해양과학기술원 해양환경방사능연구센터 (15627) 경기도 안산시 상록구 해안로 787
2한국해양대학교 해양과학기술전문대학원 해양과학기술융합학과 (49112) 부산광역시 영도구 태종로 727
Bio-accumulation of 210 Pb and 210 Po within the Trophic Level of Phytoplankton-Zooplankton-Anchovy-Mackerel in the
Coastal Water of the Jeju Island, Korea
Boeun Cho1,2 and Suk Hyun Kim1,2*
1Marine Radionuclide Research Center, KIOST Ansan 15627, Korea
2Department of Convergence Study on the Ocean Science and Technology
Ocean Science and Technology School, Korea Maritime and Ocean University, Busan 49112, Korea
Abstract : The activity concentrations of
210Po and
210Pb within phytoplankton-zooplankton-anchovy- mackerel in the coastal water of the Jeju Island were determined to understand their distribution and bio- accumulation along the trophic level. In the surface water, the total activity concentrations of
210Po and
210
Pb were 0.83 ± 0.004 mBq kg
−1and 1.27 ± 0.03 mBq kg
−1. And the dissolved activity concentration of
210
Po and
210Pb were 0.75 ± 0.06 mBq kg
−1and 1.22 ± 0.09 mBq kg
−1respectively. In the phytoplankton, the concentration factor (CF) of
210Po and
210Pb were 1.5 × 10
5and 2.6 × 10
4shows
210Po is 5 times higher compared to
210Pb. The similar CF factor in the zooplankton of
210Po was derived as 1.4 × 10
5. The CF of
210
Po in anchovy was increased twice compared to that in plankton. This is the evidence that there is
210Po bio-magnification in the trophic level of plankton-anchovy. However the
210Po activity concentration in the muscle tissue of mackerel was one-hundred times lower than that in anchovy. This reflects that in the trophic level of anchovy-mackerel, the bio-accumulation of
210Po is decreased. The activity concentrations of
210Po in the internal organs of anchovy and mackerel were 8 to 38 times higher than those in muscle tissues. In phytoplankton-zooplankton-anchovy, the CF of
210Pb was decreased five times along the trophic level in order. In anchovy-mackerel it was decreased by 30 −70%.
Key words :
210Pb,
210Po, bio-accumulation, Jeju Island, trophic level
*Corresponding author. E-mail : [email protected]
1. 서 론
210
Pb 과
210Po 은
238U 붕괴사슬에 속하는 자연방사성 핵 종이다. 해양환경에서
210Pb 과
210Po 은 해수 중에 존재하 는
226Rn( 반감기: 1,600년)의 방사성 붕괴와 지각으로부터 대기로 방출된 불활성기체인
222Rn( 반감기: 3.8일)의 딸핵 종들의 낙하에 의하여 생성된다. 대기 중으로 방출된
222
Rn(반감기: 3.8일)은 짧은 반감기를 가진 딸핵종들을 거 쳐 비교적 긴 반감기를 가진
210Pb( 반감기: 22.2년),
210Bi ( 반감기: 5.0일) 및
210Po(반감기: 138.4일)으로 된다. 금속 원소인
210Pb 은 대기 중 에어로졸에 흡착되어 강수 및 낙 진을 통하여 육상과 해양표면으로 유입된다. 육상으로 유 입된 방사성 핵종들은 식물의 증산작용 등으로 인해 대기 로 재 부유 하거나 하천을 통해 해양으로 유입되며, 해양 으로 유입된 방사성 핵종들은 해수 중 부유물질에 흡착하 여 해저 퇴적물로 유입된다(Karali et al. 1977; Preiss et al. 1996).
210Pb은 생물체에 높은 농축을 보이며 특히
210
Pb 의 딸 핵종들인
210Bi 와
210Po 은 해양생물체에 더 높 은 농축을 보인다(Holtzman 1996). 생물체에 농축된 방사 성 핵종들은 먹이사슬을 따라 상위영양단계로 축적된다 (Cherry and Shannon 1974).
238U 의 딸핵종들 중
210Po 은 붕괴할 때 높은 알파선(5.3 MeV)을 방출하며, 해양생물체 내에 내부피폭선량이 되는 원인 물질이다(Carvalho 1988).
수산물 섭취를 통하여 사람에게 피폭이 이루어질 수 있으 며, 체중 1 kg당 1 MBq의
210Po 을 매일 섭취할 경우 신장 과 신체 여러 기관 및 조혈모세포의 손상으로 인해 28일 이상 생존하기 어렵다(Scott 2007).
210
Pb 과
210Po 은 해양생물체의 서식환경과 종에 따라 매 우 다양한 농도 범위를 보인다(Fowler 2011). 해양생물의 종류에 따라 선호하는 먹이와 섭취 방식 등 차이에 의해
210
Pb 과
210Po 농도가 다르게 나타나며 서식지의 물리 화 학적 특징 차이로 인해
210Pb 과
210Po 농도 차이를 보이게 된다. 대체적으로 저서에 사는 생물이 표층에 사는 생물보 다 높은 농축을 보인다(Aközcan and Ugur 2013). 특히 연 체동물문은 해양생물분류군 중 가장 높은
210Po 농도를 가 진다(IAEA 2004; Rani et al. 2014). 연체동물문인 굴과 홍합은 중금속과 방사성 핵종을 체내에 많이 축적하는 특 성을 가지고 있어, 해양환경상태를 유추해 낼 수 있는 생 물인 지표종으로 활용되기도 한다(Connan et al. 2007;
Rožmarić et al. 2012). 플랑크톤식성 어류는 육식성 어류 보다 높은
210Po 농도를 보이는데, 서식환경과 분류군이 동일할지라도 상이한 먹이를 섭취하는 경우 서로 다른
210
Pb과
210Po 농도를 보인다(Aközcan and Ugur 2013;
Cherry et al. 1989; Lazorenko et al. 2002).
다양한 해역에서
210Pb 과
210Po 의 농축계수(Concentration Factor, CF)가 측정되었다. 남대서양 심해 및 표층생물에
서 보인
210Po 의 CF는 플랑크톤에서 1 × 10
4−1 × 10
6이며 어류에서는 1 × 10
3−7 × 10
5로 플랑크톤이 어류에 비해 높은 범위를 보였다. 특히 플랑크톤식성 어류인 정어리 (7 × 10
5) 는 포식자인 참치(5 × 10
3) 보다 높은
210Po 에 대한 CF를 보였다(Carvalho 2011; Carvalho et al. 2011). 국내 에서는 동해 영일만에 서식하는 식물플랑크톤(8 × 10
4), 동물플랑크톤(5 × 10
5), 어류(4 × 10
5) 로 이어지는 영양단 계를 따라
210Po에 대한 CF가 측정되었다(Suh et al.
1995). 이전 연구에서
210Pb과
210Po의 생물농축자료는 영양단계를 따라 생물농축을 비교하기 보다는 해수대비 생물체에 농축된 정도를 측정한 자료가 대부분이다 (Aoun et al. 2015; Musthafa and Krishnamoorthy 2012;
Suriyanarayanan et al. 2010). 본 연구는 제주도 서북연안 해역을 대상으로 식물플랑크톤-동물플랑크톤-멸치-고등어 영양단계에서 각 생물들의
210Pb 과
210Po 농도를 측정하였 으며, 이들의 농도로부터 영양단계에 따른 농도 분포 및 생물농축 특성을 파악하였다.
2. 재료 및 방법
시료채취
해수와 생물 시료들의
210Po 과
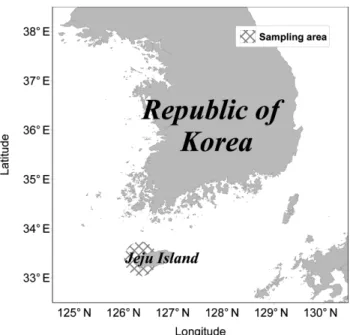
210Pb 을 분석하기 위하여 2014년 5월 제주도 서북연안 해역에서 시료들을 채취하였 다(Fig. 1). 제주도에서 서북쪽으로 1 km 이상 떨어진 해 역에서 해수를 채수하였다. 여과하지 않은 해수와 0.45 µm Catridge filter 로 여과한 해수시료는 산으로 세척 된 플라스틱 용기에 20 kg씩 담았다. 채수 후 20 kg의 해
Fig. 1. Cross indicator showing the sampling area in this
study
수 당 6 mol L
−1의 GR(guaranteed pure)급 염산 50 mL를 넣어 실험실로 이동하였다. 채수지역의 SPM(suspended particulate matter)을 알기 위해 4 L 멸균 채수통에 여과하 지 않은 해수시료를 담아 0.4 µm 필터로(Nuclepore Track-Etch Membrane Filtration Products, Whatman
®, UK) 채수지역의 SPM을 측정하였다. 식물플랑크톤과 동 물플랑크톤은 부유생물채집망을 이용하여 채취하였으며, 20−300 µm 크기는 식물플랑크톤, 300 µm 보다 큰 크기 는 동물플랑크톤으로 구분하여 약 5 g씩 채취하였다. 식 물플랑크톤과 동물플랑크톤을 크기로 분리하였으므로 작 은 크기의 동물플랑크톤이 식물플랑크톤 범위에 일부 혼 합되어 있을 가능성이 있다. 멸치와 고등어는 한국수산자 원관리공단의 도움을 받아 플랑크톤과 해수를 채취한 장 소와 시기가 비교적 가까운 것을 제주도 한림항 위판장에 서 구매하였다. 해수를 제외한 모든 시료는 −20
oC로 냉동 보관하여 실험실로 운반하였다.
생물의 부위에 따른
210Po 과
210Pb 농도를 파악하기 위 하여 생 시료 상태에서 고등어는 근육, 껍질, 내장, 간으로 분리하였고, 멸치는 머리, 근육, 내장으로 분리하였다. 각 생물의 개체에 따른 분석치 오차를 줄이기 위하여 약 10 kg 의 원시료를 분리하였으며, 분리된 각 부위들을 모아 분쇄한 후 고르게 섞이도록 하였다. 이들 각 부위를 3등분 으로 분할한 후 분할한 시료들 각각을 취하여 동일한 방 법으로 3회 실험하였다. 시료 건조는 시행하지 않았으며 일반적으로 해수대비 생물의
210Po과
210Pb 농도가 약 1000배 이상 높은 것을 감안하면(Aoun et al. 2015;
Carvalho 2011; Carvalho et al. 2011; Musthafa and Krishnamoorthy 2012; Suriyanarayanan et al. 2010) 생물 체내의 수분(해수로 인한 체수분)은 생물체의
210Po과
210
Pb 농도에 매우 낮은 영향을 끼친다. 또한 건조중량의 분석값을 습중량의 분석값으로 전환할 때 생물체의 건조 중량/습중량을 기반으로 계산하므로(Suriyanarayanan et al. 2010) 생물체내의 해수에 의한 방사성동위원소농도는 무시한다.
210
Po 분석
해수 20 kg에
210Po 회수율 추적자인
209Po 17 mBq 과
210
Pb 회수율 추적자인 Stable Pb (Lead(III) Sulfide, 99.9% tracer metal, Sigma-Aldrich chemical, USA) 0.6 mg mL
−1을 1 mL 넣었다. 해수시료에 회수율 추적자가 고 르게 혼합되도록 유리막대로 3시간 동안 섞어준 뒤, 망간 공침을 만들었다. 망간공침을 테플론 비커에 옮긴 후 8 mol L
−1질산을 가해 90
oC에서 분해시켰다. 생물 시료 는 테플론 비커에 각각의 생물 시료(플랑크톤: 0.3 g-w.w;
어류의 근육과 껍질시료: 3 g-w.w; 내장시료: 0.1 g-w.w) 를 담은 후 회수율 추적자인 17 mBq의
209Po, 0.6 mg의
Stable Pb을 첨가하여 분석하였다. 시료에 8 mol L
−1질산 을 가해 90
oC 에서 분해 시켰다. 분해된 시료에 잔존하는 질산을 70
oC 에서 천천히 증발시켰고, 잔류물을 6 mol L
−1염산으로 녹여 70
oC 에서 증발시키는 과정을 3회 이상 반 복하였다. 최종적으로 시료 잔여물은 0.5 mol L
−1염산 100 mL에 완전히 녹였다. 준비된 시료에 아스코르빈산 0.5 g 을 넣어 자석교반기로 용해시켰다. 은판(99.9% Ag, Φ 24.1 mm × 0.15 mm)을 준비된 시료에 담고, 실온상태 에서 15시간 동안 교반하여 Po을 은판에 정착시켰다 (Church et al. 2012; Lee et al. 2014).
은판에 정착된
210Po 과
209Po 은 각각의 계수값이 1000 이상 되도록 PIPS 알파검출기(Canberra series 35 MCA, Canberra corporation, USA) 로 계수하였다. 동일한 기기조 건에서 시료측정시간과 동일한 시간 동안 계수된 배경농 도를 제외하여 순 계수 값을 구하였다. 계측된
210Po 농도 ( )는 아래의 식 (1)과 같이 계산하였다(Cutter et al.
2014).
(1)
여기서 는 계측된
210Po 농도이며, 는 시료 채취 시의
210Pb 농도이다. 는 시료 채취시의
210Po 농도를 말한다. λ
Po는
210Po 의 붕괴상수로 ln2/138.4일이다. T
1는 시료채취에서 Po이 은판에 정착하기까지 경과된 시간이 다. 본 실험에서
209Po 회수율은 평균 71 ± 4%(평균 ± 표 준편차%)로 나왔다.
210
Pb 분석
은판에
210Po 장착 후 남은 시료를 질산으로 분해한 후 9 mol L
−1염산 용매에서 AG
®1-X8 이온교환수지(100−
200 mush chloride form, Bio-Rad Laboratories, Inc., USA) 를 이용하여 Po 동위원소들을 완전히 제거하였다. 이온교 환수지를 통과한 시료는 6개월 이상 보관한 뒤
210Pb 에서 붕괴되어 생성된
210Po 을 위의
210Po 분석방법과 동일한 방법으로 분석하였다(Church et al. 2012). 시료 채취 시
210
Pb 농도( )는 아래의 식 (2)와 같이 계산하였다.
(2)
여기서 는 시료 채취시의
210Pb 농도이며, 은 이 온교환수지 통과 후
210Pb 이 붕괴하여 생성된
210Po 농도 를 의미한다. λ
Pb는
210Pb 의 붕괴상수로 ln2/22.2년이며, λ
Po는
210Po의 붕괴상수로 ln2/138.4일이다. T
2는 시료를 채취한 시기에서 이온교환수지 통과 후까지 흐른 시간을 의미한다. T
3은 이온교환수지를 통해 Po 동위원소를 제거 한 시간부터
210Pb 에서 붕괴된
210Po 이 은판에 정착하기까
A
PomA
Pom= A
PbI× [ 1 – e
λPoT1] + A
PoI× e
λPoT1A
PomA
PbIA
PoIA
PbIA
PbI[ A
Pbm× e
λPbT2] ηC 1 e [ –
λPoT3] ---
=
A
PbIA
Pbm지 흐른 시간을 의미한다. ηC는 Stable Pb의 회수율을 의 미하며 평균 88 ± 24%로 나왔다. 회수율은 이온교환수지 통과 후 남아있는 Stable Pb를 ICP-MS(X Series II ICP- MS, Thermo Fisher Scientific Inco., USA) 로 측정하여 구 하였다(Cutter et al. 2014).
3. 결과 및 토의
해수와 플랑크톤의
210Po과
210Pb 농도 분포
2014년 5월 제주 연안 해역 해수에서 측정된 총
210Po 과
210Pb 농도는 0.83 ± 0.004 mBq kg
−1와 1.27 ± 0.03 mBq kg
−1였으며, 용존태의
210Po 과
210Pb 농도는 0.75 ± 0.06 mBq kg
−1와 1.22 ± 0.09 mBq kg
−1였다(Table 1). 연 구해역의 해수에서 측정한
210Po 과
210Pb 농도는 이전에 측정되었던 우리나라 동해, 남해 및 서해 해수의 총
210Po 과
210Pb 농도(
210Po: 0.7−3.1 mBq kg
−1;
210Pb: 0.9−4.9 mBq kg
−1)와 용존태의
210Po 과
210Pb 농도(
210Po: 0.3−1.5 mBq kg
−1;
210Pb: 0.3−2.4 mBq kg
−1) 범위에 포함된다 (Hong et al. 2008; Hong et al. 1999; Kim and Kim 2014;
Kim and Yang 2004). 또한, 제주도와 근접한 동중국해 해 수의 총
210Po 과
210Pb 농도는 0.65−3.05 mBq kg
−1과 0.9−4.85 mBq kg
−1이며, 용존태의
210Po 과
210Pb 농도는
0.26−0.93 mBq kg
−1와 1.13−2.38 mBq kg
−1로 이 농도 범 위는 본 연구결과에서 나온 해수의 총
210Po 과
210Pb 농도 와 용존태의
210Po 과
210Pb 농도를 포함한다(Nozaki et al.
1991).
연구해역의 해수에서
210Po/
210Pb 농도비는 총 해수에서 0.66, 용존태에서 0.62로
210Po 이
210Pb 에 비하여 상대적으 로 낮은 농도를 보였다. 이는 해양에서 생물학적 입자에 대한 높은 분배계수를 가진
210Po 이
210Pb 보다 우선적으로 제거되기 때문이다(Bacon et al. 1988; Sarin et al. 1994).
본 연구에서 측정된 제주 연안 해역 해수의
210Po/
210Pb 농 도비는 북서지중해의 0.4보다 높고, 쿠로시오 해류를 따라 흐르는 동중국해 남쪽해역의 0.4−0.7과 북서대서양의 0.6 과 비슷하였다(Nozaki et al. 1991; Stewart et al. 2010;
Tateda et al. 2003).
제주 연안 해역 해수의
210Po 과
210Pb 분배계수(K
d)는 연구해역의 총
210Po(
210Pb) 농도, 용존태의
210Po(
210Pb) 농도 그리고 SPM 농도로부터 식 (3)과 같이 계산하였다 (IAEA 2004).
(3)
여기서, 은 제주 연안 해역 해수의 총
210Po(
210Pb) K
d[ ( A
Po PbT ( )– A
Po PbD( ))/SPM ]
A
Po PbD( )---
=
A
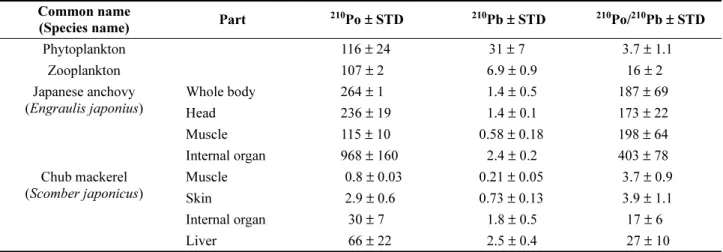
Po PbT ( )Table 2. The activity concentrations and concentration ratios of
210Po and
210Pb in phytoplankton, zooplankton, anchovy and mackerel at the coastal water of Jeju Island (n = 3)
(unit : Bq kg
−1-w.w) Common name
(Species name) Part
210Po ± STD
210Pb ± STD
210Po/
210Pb ± STD
Phytoplankton 116 ± 24 31 ± 7 3.7 ± 1.1
Zooplankton 107 ± 2 6.9 ± 0.9 16 ± 2
Japanese anchovy (Engraulis japonius)
Whole body 264 ± 1 1.4 ± 0.5 187 ± 69
Head 236 ± 19 1.4 ± 0.1 173 ± 22
Muscle 115 ± 10 0.58 ± 0.18 198 ± 64
Internal organ 968 ± 160 2.4 ± 0.2 403 ± 78 Chub mackerel
(Scomber japonicus)
Muscle 0.8 ± 0.03 0.21 ± 0.05 3.7 ± 0.9
Skin 2.9 ± 0.6 0.73 ± 0.13 3.9 ± 1.1
Internal organ 30 ± 7 1.8 ± 0.5 17 ± 6
Liver 66 ± 22 2.5 ± 0.4 27 ± 10
Table 1. The activity concentrations and distribution coefficients ( K
d) of
210Po and
210Pb in the surface water at the coastal water of Jeju Island
(unit : mBq kg
−1)
Seawater Total Dissolved Particulate K
d210
Po ± STD 0.83 ± 0.004 0.75 ± 0.06 0.08 ± 0.06 1.9 × 10
5± 2.6 × 10
5210
Pb ± STD 1.27 ± 0.03 1.22 ± 0.09 0.05 ± 0.06 6.6 × 10
5± 3.1 × 10
4210
Po/
210Pb ± STD 0.66 ± 0.02 0.62 ± 0.07 1.79 ± 2.79
농도를 나타내며, 는 용존태의
210Po(
210Pb) 농도 를 나타낸다. 연구해역 해수의 SPM 농도는 0.56 mg kg
−1였다. 식 (3)을 통해 계산된 제주해수의
210Po 과
210Pb 분 배계수(K
d) 는 각각 1.9 × 10
5과 6.6 × 10
5으로
210Po 이 약 3 배 높은 값을 보였다(Table 1). IAEA (2004)에 의하면, 대 양에서 해수의
210Po 과
210Pb에 대한 K
d값은 각각 2.0 × 10
7과 1.0 × 10
7이며, 연해(Marginal Sea)에서
210Po 과
210Pb 에 대한 K
d값은 각각 2.0 × 10
7과 1.0 × 10
5로 보 고된 바 있다. 본 연구에서 구한 제주해수의
210Po 에 대한 K
d값은 IAEA (2004) 보고서에서 제시된 연해에서의 값 에 비하여 약 100배 낮았으나,
210Pb 에 대한 K
d값은 비슷 하였다. 동해 남부에 위치한 대한해협 근처에서 5월과 7월에 조사된
210Po 에 대한 K
d값은 2.5 × 10
5−4.1 × 10
6로 보고된 값에 비해 낮은 범위이다(Hong et al. 2008).
본 연구지역에서 식물플랑크톤의
210Po 과
210Pb 농도는 각각 116 ± 24 Bq kg
−1-w.w 과 31 ± 7 Bq kg
−1-w.w 이며, 동물플랑크톤의
210Po 과
210Pb 농도는 각각 107 ± 2 Bq kg
−1-w.w 와 6.9 ± 0.9 Bq kg
−1-w.w 이다(Table 2). 해수 중
210
Po 과
210Pb 농도로부터 식 (4)를 이용하여
210Po 과
210Pb 농축계수(Concentration factor, CF)를 구하였다(IAEA 2004).
(4)
여기서, 는 각 시료들의
210Po(
210Pb) 농도를 나타 내며, 는 해수 용존태의
210Po(
210Pb) 농도를 나타 낸다. 크기로 분류한 식물플랑크톤과 동물플랑크톤의
210
Po 과
210Pb 에 대한 CF는 식물플랑크톤이 1.5 × 10
5와 2.6 × 10
4였으며, 동물플랑크톤은 1.4 × 10
5와 5.7 × 10
3였 다. 동물플랑크톤의
210Po 에 대한 CF는 식물플랑크톤과 비슷하였으며,
210Pb 에 대한 CF는 식물플랑크톤이 동물플 랑크톤에 비해 약 5배 높았다. 진해만에서 측정된 식물플 랑크톤의
210Po 농도는 99.5−139 Bq kg
−1-w.w였으며, CF 는 1 × 10
5로(Kim and Yang 2004) 제주해역 식물플랑크 톤과 비슷하였다. 플랑크톤 크기별
210Po 과
210Pb 농도변 화에 대하여 조사한 자료에 의하면,
210Po 의 경우 플랑크 톤 크기에 따라 농도 차이가 관찰되지 않은 반면에
210Pb 의 경우 60−200 µm 크기의 플랑크톤에서 200 µm보다 큰 크기의 플랑크톤보다 높은 농도를 보였다(Strady et al.
2015). 이와 같이 본 연구에서도 식물플랑크톤(20−300 µm 크기 부분)과 동물플랑크톤(300 µm 보다 큰 크기 부분)의
210
Po 에 대한 CF는 비슷한 값을 보였지만,
210Pb에 대한 CF 는 동물플랑크톤이 더 높게 나타났다.
멸치와 고등어의
210Po과
210Pb 농도 분포
제주 서북지역에 많이 출현하는 어류는 멸치와 고등어
로 사계절 동안 출현한 전체 51종의 어류 가운데 멸치 (Engraulis japonius)는 28%, 고등어(Scomber japonicas) 는 18% 였다(KIOST 2005). 본 연구해역에서는 규조류가 높은 점유율을 보이는 식물플랑크톤이며, 동물플랑크톤의 경우, 쿠로시오 난류역에서 보이는 요각류가 높은 점유율 을 보이는 것으로 알려져 있다(Kim et al. 2013; KIOST 2005). 동물플랑크톤은 식물플랑크톤을 섭이하며 상위영 양단계에 있는 생물들에게 일차생산물을 전달해 준다 (Kim et al. 2013). 멸치는 한국 전 해안에 분포하며, 3월 하순경에 남해와 대마도 사이에 어군이 밀집한다. 4월부 터 이동하여 5−7월경에는 강원도연안까지 북상한다. 서해 로 북상하는 어군은 5−6월이며 경기만 일대까지 도달한 다. 수온이 낮아지면 남해지역에서 월동하며 제주도 북서 해역과 남해 동부해역에서 높은 분포밀도를 보였다 (NFRDI 2010). 남해안 멸치의 먹이생물 조사에 의하면, 멸치는 식물플랑크톤과 동물플랑크톤을 모두 섭이하면서 먹이생물에 대한 선택성을 가지는데, 하계에는 요각류를 높게 선택하는 것으로 나타났다(Kim et al. 2013). 고등어 는 계절적 회유를 하며 한국 주변의 대마난류와 동중국해 난류를 따라 이동한다. 대마난류를 따라 이동하는 고등어 는 동해로 분산되고 산란기에 대마도 근해로 이동하며, 주 산란기는 4−5월이다(NFRDI 2010). 고등어는 제주지 역에 많이 출현하는 종인 멸치를 섭취하며 이전 조사에 따르면 남해에서 잡힌 고등어의 위 내용물 중 멸치가 전 체의 37%로 고등어 먹이에서 매우 높은 부분을 차지하였 다(Yoon et al. 2008).
국립수산과학원에서 운영하는 해양수산 연구정보 포털 을 바탕으로 제주 서북연안 해역에서 잡은 멸치(Engraulis japonius)는 크기가 10 cm 이상으로 1살을 지난 성어기이 며, 이 멸치는 해류의 영향을 받아 남해로 왔을 것으로 추 정된다. 멸치에서의
210Po 와
210Pb 농도는 264 ± 1 Bq kg
−1- w.w 와 1.4 ± 0.5 Bq kg
−1-w.w 였으며
210Pb 에 비하여
210Po 이 약 200배 높은 농도를 보였다(Table 2). 기존 연구들은 멸치의
210Po 와
210Pb 에 대하여 각각 25−281 Bq kg
−1-w.w 과 0.18−28 Bq kg
−1-w.w 로 매우 다양한 농도범위를 보였 다(Aközcan 2013; Çatal et al. 2012; Khan and Wesley 2012; Lazorenko et al. 2002; Štrok and Smodiš 2011). 제 주 연안 멸치의 부위별
210Po 과
210Pb 농도는 근육에서 115 ± 10 Bq kg
−1-w.w 과 0.58 ± 0.18 Bq kg
−1-w.w이며, 내 장에서 968 ± 160 B Bq kg
−1-w.w 와 2.4 ± 0.2 Bq kg
−1- w.w 였다(Table 2). 멸치의
210Po 농도는 멸치의 주먹이 생 물인 플랑크톤 대비 약 2배가 넘는 농도를 보여 먹이섭취 를 통한 생물농축이 증가하는 것으로 나타났다. 멸치 근육 은 플랑크톤과 비슷한
210Po 농도를 보였으나 멸치 내장은 플랑크톤의 약 8배가 넘는
210Po 농도를 보였다. 이는 먹 이를 통하여 체내로 유입된
210Po 이 내장 부위에 더 높게 A
Po PbD( )CF A
Po Pbsample( )A
Po PbD( )---
=
A
Po Pbsample( )A
Po PbD( )농축된다는 것을 나타낸다. 반면에
210Pb 의 경우, 멸치는 플랑크톤의 약 5분의 1에서 22분의 1 농도를 보였다.
210
Pb 은
210Po 과 달리 플랑크톤에서 멸치로 가는 영양 단 계를 거치면서 생물농축이 감소한다는 것을 알 수 있다.
기존에 조사된 슬로베니아, 터키, 인도 해역에서 고등어 의
210Po 은 3.6−30.2 Bq kg
−1-w.w 이며,
210Pb 의 농도범위 는 0.56−9.5 Bq kg
−1-w.w 로 넓은 농도 분포를 보여 준다 (Aközcan and Ugur 2013; Aoun et al. 2015; Khan and Wesley 2012). 해양수산 연구정보 포털을 바탕으로 제주 북서 연안에서 잡힌 고등어(Scomber japonicas)는 전장이 30 cm, 체중이 330 g로 약 2살이며, 봄과 여름철 산란을 위해 남해로 온 것 추정된다. 앞서 Yoon et al. (2008)의 연구에 따르면 고등어의 전체 먹이생물 중 멸치는 37%를 차지하며, 단각류는 20%를 차지한다. 하지만 실제 남해안 에서 동물플랑크톤 우점종은 요각류인 점을 감안한다면 고등어가 선택적으로 섭취하는 것으로 볼 수 있다(Kim et al. 2013). 본 연구에서는 고등어를 근육, 껍질, 내장, 간으 로 분리하고, 각각 부위별
210Po 과
210Pb 농도를 분석하였 다. 고등어 부위들 중 간에서
210Po 과
210Pb 농도가 66 ± 22 Bq kg
−1-w.w 과 2.5 ± 0.4 Bq kg
−1-w.w 로 가장 높 았으며, 근육에서 가장 낮은 농도인 0.80 ± 0.03 Bq kg
−1- w.w과 0.21 ± 0.05 Bq kg
−1-w.w를 보였다(Table 2). 간을 포함한 내장 부위에서
210Po 농도는 30 ± 7 Bq kg
−1-w.w 로 간의 약 50% 농도를 보였으며,
210Pb 농도는 1.8 ± 0.5 Bq kg
−1-w.w로 간의 약 70% 농도를 보였다. 껍질에서
210
Po 과
210Pb 농도는 2.9 ± 0.6 Bq kg
−1-w.w 와 0.73 ± 0.13 Bq kg
−1-w.w 로 모두 근육보다 약 3.5배 높았다. 고등어 근 육에서
210Po 농도는 고등어의 주요 먹이생물 중 하나인 멸치의
210Po 농도에 비해 약 300분의 1 낮았으며,
210Pb 농도는 약 7분의 1 이었다. 고등어의 부위들 중
210Po 농
도가 가장 높게 나온 간과 내장은 멸치 전체의
210Po 농도 에 비해 수 배 낮은 농도를 보였다. 멸치보다 고등어 체내 에 농축된
210Po 농도가 더 낮은 것으로 보아
210Po 생물 농축은 멸치에서 고등어로 감소하는 것으로 보인다.
해양생물에서
210Po 과
210Pb 농도는 서식 환경 및 섭취 하는 먹이 등에 따라 매우 다양한 범위를 보일 수 있다 (Aközcan and Ugur 2013). 섭취하는 먹이에 따라 동일한 서식지의 어류들을 분류·비교하였을 때, 플랑크톤을 섭취 하는 어류의
210Po 과
210Pb 농도범위는 23−190(근육) Bq kg
−1-w.w과 0.6(근육)−99 Bq kg
−1-w.w이며, 멸치보다 상 위 영양단계에 있는 육식성 어류의
210Po 과
210Pb 농도범 위는 0.8(근육)−116(근육) Bq kg
−1-w.w 과 0.2(근육)−
1.6 Bq kg
−1-w.w 로 조사된 바 있다(Table 3) (Aoun et al.
2015; Musthafa and Krishnamoorthy 2012; Štrok and Smodiš 2011; Suriyanarayanan et al. 2010; This study).
이전 조사에서 플랑크톤을 먹이로 하는 어류는 상위 영양 단계에 있는 어류에 비해 더 높은
210Po 과
210Pb 농축을 보였다. 같은 조건의 어류실험에서 동일한
210Po 농도를 가지는 두 종류의 먹이(플랑크톤과 어류)를 주었을 때 플 랑크톤을 섭취했던 어류가 그렇지 않은 어류 보다 더 높 은
210Po 농도를 보인 연구결과가 있었다(Cherry et al.
1989).
영양단계에 따른
210Po과
210Pb의 생물농축
제주 연안 해역에서 식물플랑크톤-동물플랑크톤-멸치- 고등어로 이어지는 영양단계에서
210Po 과
210Pb 에 대한 생 물농축을 비교하였다. 식물플랑크톤에서
210Po 의 CF는 1.5 × 10
5로 해수 대비 높은 농축계수를 보이며 동물플랑 크톤에서
210Po 의 CF는 식물플랑크톤과 비슷한 1.4 × 10
5를 보였다. 플랑크톤을 주 먹이로 하는 멸치에서
210Po 의
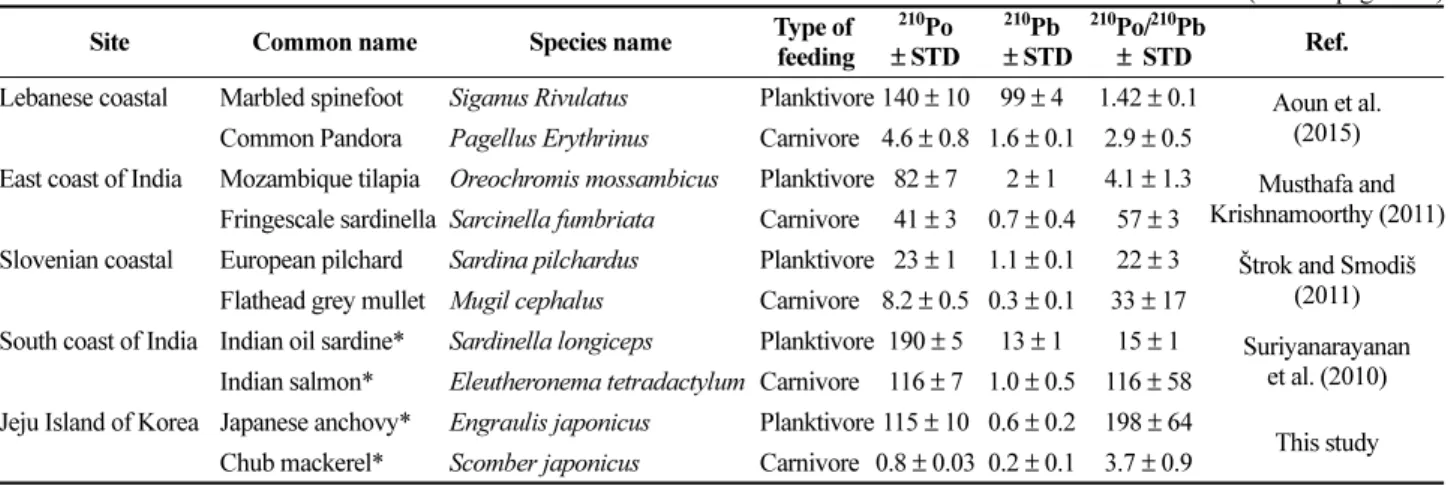
Table 3. Comparison of the activity concentrations and concentration ratios of
210Po and
210Pb in the planktivorous and carnivorous fishes in this study with those in other studies (*: muscle)
(unit : Bq kg
−1-ww)
Site Common name Species name Type of
feeding
210
Po
± STD
210
Pb
± STD
210
Po/
210Pb
± STD Ref.
Lebanese coastal Marbled spinefoot Siganus Rivulatus Planktivore 140 ± 10 99 ± 4 1.42 ± 0.1 Aoun et al.
(2015) Common Pandora Pagellus Erythrinus Carnivore 4.6 ± 0.8 1.6 ± 0.1 2.9 ± 0.5
East coast of India Mozambique tilapia Oreochromis mossambicus Planktivore 82 ± 7 2 ± 1 4.1 ± 1.3 Musthafa and Krishnamoorthy (2011) Fringescale sardinella Sarcinella fumbriata Carnivore 41 ± 3 0.7 ± 0.4 57 ± 3
Slovenian coastal European pilchard Sardina pilchardus Planktivore 23 ± 1 1.1 ± 0.1 22 ± 3 Štrok and Smodiš (2011) Flathead grey mullet Mugil cephalus Carnivore 8.2 ± 0.5 0.3 ± 0.1 33 ± 17
South coast of India Indian oil sardine* Sardinella longiceps Planktivore 190 ± 5 13 ± 1 15 ± 1 Suriyanarayanan et al. (2010) Indian salmon* Eleutheronema tetradactylum Carnivore 116 ± 7 1.0 ± 0.5 116 ± 58
Jeju Island of Korea Japanese anchovy* Engraulis japonicus Planktivore 115 ± 10 0.6 ± 0.2 198 ± 64
This study
Chub mackerel* Scomber japonicus Carnivore 0.8 ± 0.03 0.2 ± 0.1 3.7 ± 0.9
CF 는 3.5 × 10
5으로 먹이생물인 플랑크톤보다 수 배 높은 CF 를 보였다. 플랑크톤-멸치 영양단계에서는
210Po 의 CF 가 상위 영양단계로 가면서 증가하는 것을 보여주었다 (Fig. 2; Table 4). 멸치 근육에서
210Po에 대한 CF는 1.5 × 10
5로 플랑크톤과 비교적 비슷한 CF를 보였고, 멸치 내장은 1.3 × 10
6로 플랑크톤보다 약 8−9배 높았다. 멸치 보다 상위 영양단계에 있는 고등어에서
210Po에 대한 CF 는 근육과 내장부위에서 각각 1.1 × 10
3과 4.0 × 10
4으로 멸치에 비하여 10분의 1에서 100분의 1로 감소하였다.
이전연구에서 플랑크톤을 섭식하는 어류가 다른 어류보 다 높은
210Po 에 대한 CF를 보였으며 본 연구에서 또한 플랑크톤섭식자인 멸치가 높게 나왔다(Fowler 2011;
Suriyanarayanan et al. 2010). 식물플랑크톤과 동물플랑크 톤에서
210Pb 에 대한 CF는 각각 2.6 × 10
4와 5.7 × 10
3로
210
Po 에 비하여 약 5분의 1과 25분의 1 낮았다. 동물플랑 크톤은 식물플랑크톤에 비해
210Po 보다
210Pb을 상대적으
로 적게 농축하는 것으로 보였다. 동물플랑크톤인 난바다 곤쟁이류(Meganyctiphanes norvegica)의 배양 실험에서 먹이섭취 후 체내에 남은
210Po 과
210Pb 의 농도를 비교하 였는데, 동물플랑크톤의 체내에 남아있는
210Po 양이 전체 의 44%이며 배설물로 나온
210Po 양은 26%였다. 반면에
210
Pb 의 경우, 체내에 남은 양은 전체의 3.5%이며 배설물 로 나온 양은 전체의 84%로
210Po 에 비해
210Pb 이 더 많 이 배출된다는 것을 볼 수 있다(Stewart et al. 2005). 멸치 의 전체 몸통에서
210Pb 의 CF는 1.2 × 10
3로 플랑크톤에서 보다 낮았지만,
210Po 의 경우에는 반대로 멸치에서 더 높 았다. 이것은 멸치에서는 영양단계를 따라
210Po 의 생물농 축이 증가하지만
210Pb 은 오히려 감소한다는 것을 나타낸 다. 고등어 근육과 내장에서
210Pb의 CF는 1.7 × 10
2과 1.5 × 10
3였다. 고등어 근육에서
210Pb 의 CF는 멸치 근육 에 비해 약 2분의 1로 낮았으며, 고등어내장에서
210Pb 의 CF는 멸치내장과 비슷한 값을 보였다(Table 4).
4. 결 론
2014 년 5월제주 북서 연안의 식물플랑크톤-동물플랑크 톤-멸치-고등어로 이어지는 영양단계에서 각 생물들의
210
Po 과
210Pb 농도 분석을 통하여 이들 방사성 핵종들의 분포와 생물농축 특성을 파악하였다. 제주 연안 해수에서 측정된 총
210Po 과
210Pb 농도는 0.83 ± 0.004 mBq kg
−1와 1.27 ± 0.03 mBq kg
−1였으며, 용존태의
210Po과
210Pb 농 도는 0.75 ± 0.06 mBq kg
−1와 1.22 ± 0.09 mBq kg
−1로
210
Pb 이
210Po 에 비하여 약 1.5배 높은 농도를 보였다. 식 물플랑크톤에서
210Po 과
210Pb 의 CF는 각각 1.5 × 10
5와 2.6 × 10
4으로
210Po이 약 5배 더 높은 생물농축을 보였 다. 동물플랑크톤에서
210Po 의 CF는 식물플랑크톤과 비슷 한 값을 보인 반면에
210Pb 는 식물플랑크톤의 약 5분의 1배 낮았다. 멸치에서
210Po의 CF는 플랑크톤에 비하여 Fig. 2. The concentration factors of
210Po and
210Pb in
phytoplankton, zooplankton, anchovy and mackerel at the coastal water of Jeju Island
Table 4. The concentration factors of
210Po and
210Pb in phytoplankton, zooplankton, anchovy and mackerel at the coastal water of Jeju Island
Common name
(Species name) Part CF
210
Po ± STD
210Pb ± STD Phytoplankton 1.5 × 10
5± 3.5 × 10
42.6 × 10
4± 5.8 × 10
3Zooplankton 1.4 × 10
5± 1.2 × 10
45.7 × 10
3± 8.8 × 10
2Japanese anchovy
(Engraulis japonius)
Whole body 3.5 × 10
5± 2.8 × 10
41.2 × 10
3± 4.3 × 10
2Head 3.1 × 10
5± 3.5 × 10
41.1 × 10
3± 1.4 × 10
2Muscle 1.5 × 10
5± 1.8 × 10
44.8 × 10
2± 1.5 × 10
2Internal organ 1.3 × 10
6± 2.4 × 10
52.0 × 10
3± 2.5 × 10
2Chub mackerel
(Scomber japonicus)
Muscle 1.1 × 10
3± 9.5 × 10
11.7 × 10
2± 4.4 × 10
1Skin 3.8 × 10
3± 8.8 × 10
26.0 × 10
2± 1.1 × 10
2Internal organ 4.0 × 10
4± 9.1 × 10
31.5 × 10
3± 4.3 × 10
2수 배 더 높았으며, 플랑크톤-멸치로 이어지는 영양단계에 서는
210Po 의 생물농축이 증가한다는 것을 보여주었다. 반 면에, 멸치보다 높은 영양단계에 위치한 고등어의 근육에 서
210Po 에 대한 CF가 멸치의 약 100분의 1로 멸치-고등 어 영양단계에서
210Po 의 생물농축이 오히려 크게 감소한 다는 것을 보여주었다. 멸치와 고등어의 내장은 근육보다
210
Po 에 대한 CF가 8−38배 높았고, 따라서 이 영양단계에 서
210Po 은 내장 부위에 더 높게 농축된다는 것을 보여주 었다.
210Pb의 CF는 식물플랑크톤-동물플랑크톤-멸치 영 양단계를 거치면서 각 단계별로 약 5배씩 감소하는 경향 을 보였다. 이후 멸치-고등어 영양단계에서
210Pb 의 CF 는 30−70% 감소하였으며 이는 이전 영양단계인 식물플 랑크톤-동물플랑크톤-멸치 영양단계에 비하여 매우 적은 감소폭을 보였다(Fig. 3).
210Po과
210Pb의 농축계수비 (CF(
210Po)/CF(
210Pb)) 는 식물플랑크톤-동물플랑크톤-멸치
영양단계를 거치는 과정에서 각 단계마다 5−12배 증가하 였으나, 이와 달리 멸치에서 고등어로 넘어가는 단계에서 는 수십분의 1로 감소하였다(Fig. 4).
사 사
본 연구는 한국해양과학기술원의 ‘방사능 물질 해양 유 입 사고 대응 해양 확산 및 생물영향 연구(PE99403)’ 지 원을 받아 수행하였습니다.
참고문헌
Aközcan S (2013) Levels of
210Po in some commercial fish species consumed in the Aegean Sea coast of Turkey and the related dose assessment to the coastal population. J Environ Radioactiv 118:93−95
Aközcan S, Ugur A (2013) Activity levels of
210Po and
210
Pb in some fish species of the Izmir Bay (Aegean Sea). Mar Pollut Bull 66:234 −238
Aoun M, Samad OE, Khozam RB, Lobinski R (2015) Assessment of committed effective dose due to the ingestion of
210Po and
210Pb in consumed Lebanese fish affected by a phosphate fertilizer plant. J Environ Radioactiv 140:25 −29
Bacon MP, Belastock RA, Tecotzky M, Turekian KK, Spencer DW (1988) Lead-210 and polonium-210 in ocean water profiles of the continental shelf and slope south of New England. Cont Shelf Res 8:841−853 Carvalho FP (1988)
210Po in marine organisms: a wide
range of natural radiation dose domains. Radiat Prot Dosim 24:113−117
Carvalho FP (2011) Polonium (
210Po) and lead (
210Pb) in Fig. 3. The relative concentration factors in zooplankton, anchovy and mackerel to the concentration factors of
210Po
and
210Pb in phytoplankton at the coastal water of Jeju Island. Relative concentration factor: [
Po(Pb)RA
plk= (CF of
210Po(Pb) in marine biota) (CF of
210Po(Pb) in phytoplankton)
−1]
Fig. 4. The ratios of
210Po and
210Pb concentration factors
in phytoplankton, zooplankton, anchovy and
mackerel at the coastal water of Jeju Island
marine organisms and their transfer in marine food chains. J Environ Radioactiv 102:462 −472
Carvalho FP, Oliveira JM, Malta M (2011) Radionuclides in deep-sea fish and other organisms from the North Atlantic Ocean. ICES J Mar Sci 68(2):333−340
Çatal EM, Ugur A, Özden B, Filizok I (2012)
210Po and
210
Pb variations in fish species from the Aegean Sea and the contribution of
210Po to the radiation dose. Mar Pollut Bull 64:801−806
Cherry RD, Heyraud M, James AG (1989) Diet Prediction in Common Clupeoid Fish Using Polonium-210 Data. J Environ Radioactiv 10:47 −65
Cherry RD, Shannon LV (1974) The alpha radioactivity of marine organisms. Atom Energy Rev 12:45
Church T, Rigaud S, Baskaran M, Kumar A, Friedrich J, Masque P, Puigcorbé V, Kim G, Radakovitch O, Hong G, Choi H, Stewart G (2012) Intercalibration studies of
210
Po and
210Pb in dissolved and particulate seawater samples. Limnol Oceanogr-Meth 10:776−789
Connan O, Germain P, Solier L, Gouret G (2007) Variations of
210Po and
210Pb in various marine organisms from Western English Channel: contribution of
210Po to the radiation dose. J Environ Radioactiv 97:168 −188 Cutter G, Andersson P, Codispoti L, Croot P, Francois R,
Lohan M, Obata H, Loeff MR (2014) Sampling and sample-handling Protocols for GEOTRACES Cruises. In:
GEOTRACES, London, pp 28 −36
Fowler SW (2011)
210Po in the marine environment with emphasis on its behavior within the biosphere. J Environ Radioactiv 102:448−461
Holtzman RB (1996) Natural levels of lead-210, polonium- 210 and radium-226 in humans and biota of the Arctic.
Nature 210:1094 −1097
Hong G-H, Kim Y-I, Baskaran M, Kim S-H, Chung C-S (2008) Distribution of
210Po and export of organic carbon from the euphotic zone in the Southwestern East Sea (Sea of Japan). J Oceanogr 64:277 −292
Hong G-H, Park S-K, Baskaran M, Kim S-H, Chung C-S, Lee S-H (1999) Lead-210 and Polonium-210 in the winter well-mixed turbid waters in the mouth of the Yellow Sea. Cont Shelf Res 19:1049−1064
IAEA (2004) Sediment Distribution Coefficients and Concentration Factors for Biota in the Marine Environment. International Atomic Energy Agency (IAEA), Vienna, Technical Reports Series No. 422, 92 p Karali T, Nozaki Y, Benninger LK (1977) Geochemistry of
atmospheric radon and radon products. Annu Rev Earth Pl Sc 5:227 −255
Khan MF, Wesley SG (2012) Radionuclides in resident and
migratory fishes of a wedgy bank region: Estimation of dose to human beings, South India. Mar Pollut Bull 64:2224 −2232
Kim T-H, Kim I (2014) Importance of colloidal
210Pb and
210