Article
Effect of Thermal Stratification and Mixing on Phytoplankton Community Structure in the Western Channel of the Korea Strait
Dong Hyun Shon
1, Kyoungsoon Shin
1*, Pung Guk Jang
1, Young Ok Kim
1, Man Chang
2, and Woong Seo Kim
31
South Sea Research Institute, KORDI Geoje 656-830, Korea
2
Policy Center, KORDI
3
Yeosu Exposition Supporting Task Force Team, KORDI Ansan P.O. Box 29, 425-600, Korea
Abstract : The profile of a fixed site at station M (34.77
oN, 129.13
oE) in the Korea Strait was studied from March 2006 to February 2007. The aim was to understand the relationship between the annual thermal strat- ification pattern and seasonal variation in phytoplankton community structure. Physicochemical factors including temperature, salinity and nutrient concentrations, which strongly influence the proliferation and diversity of phytoplankton, were measured. The study period was divided into three due to the characteristic of thermohaline structures; mixed I (March-May 2006), stratified (June-November 2006) and mixed II (December 2006-Feburuary 2007). Diatoms dominated during the mixed I (89%) and II (48%) periods, while nanoplankton group occupied over 83% of total population during the stratified period. The dominant species during the mixed I and II was Chaetoceros socialis (47% and 29%, respectively), while during the stratified period Gyrodinium sp. (4%) was the most dominant. Averaged total chl a concentrations during the mixed I and II periods were 0.61 mg m
-3and 0.72 mg m
-3, respectively, which were at least two-fold higher than that during the stratified period (0.30 mg m
-3). The vertical mixing and convection process of the water column induced nutrient supply from the bottom layer to the euphotic zone. It also led to the dominance of diatoms during the mixed periods, whereas small phytoplankton prevailed over large phytoplankton as strat- ification blocked the upward movement of nutrients to subsurface during the stratified period. During the mixed I and II periods, microplanktonic chl a dominated concentrations (50% and 48%, respectively), while picoplanktonic chl a occupied over 37% of total chl a during the stratified period.
Key words : water mass interaction, thermohaline structure, Korea Strait, phytoplankton community structure
1. Introduction
Historically, numerous physical approaches have been employed to understand the dynamics of different water masses passing through the western channel of the Korea Strait (Lim and Chang 1969; Han 1972; Lim 1973; Byun and Chang 1984; Lim and An 1985; Park et al . 1999a;
Kim et al . 2004). The Tsushima Warm Current, which is a branch of the Kuroshio Warm Current, is mixed with the Taiwan Warm Current and encounters the Korea Strait Bottom Cold Water, which originates from water masses in the East Sea (ex. the East Sea Proper Water and the
North Korean Cold Water).
There are two theories on the origin of the Tsushima Warm Current. The first theory suggests that it separates from the Kuroshio Current in the southwest of Kyushu (Nitani 1972). Lie and Cho (1994) validated this theory by using trajectories of satellite-tracked drifters and hydro- graphic observations. The second theory considers that the northeastward Taiwan Warm Current, which enters the East China Sea after passing through the Taiwan Strait, is the primary source of Tsushima Warm Current (Beardsley et al . 1985; Fang et al . 1991). Several numerical studies have been conducted on origin of the Tsushima Warm Current. Isobe (1999) concluded that the Taiwan Warm Current, which passes through the Taiwan Strait, was the
*Corresponding author. E-mail : [email protected]
262 Shon, D. H. et al.
primary contributor of water inflow to the Korea Strait.
He also reported that approximately 66% of the Tsushima Warm Current came directly from the Kuroshio region in autumn (Isobe 1999). Guo et al . (2006) used a prognostic model to determine Kuroshio onshore fluxes. They proposed that about half of the Tsushima Warm Current originated from the Taiwan Strait in summer, while the other half came from the Kuroshio. They also argued that contribution of the Kuroshio current amounted to approximately 80% (and contribution from the Taiwan Strait decreased to 20%) from summer to winter.
Korea Strait Bottom Cold Water, which is a southwe- stward undercurrent in the western channel of the Korea Strait, is defined by temperatures of below 10
oC and salinity of between 34.0 PSU and 34.3 PSU (Lim and Chang 1969; Kim and Lee 2004). This cold current is only present in summer and autumn when velocity of the Tsushima Warm Current appears to be strong in the upper part of the western channel (Lim and Chang 1969).
However, Johnson and Teague (2002) recently argued that sustained intrusions by the Korea Strait Bottom Cold Water could occur from May to June, and from December to January, when geostrophic transport from the Tsushima Warm Current is low. Kim and Kim (1983) investigated occurrence of the cold water mass along the east coast of Korea. They found that North Korean Cold Water sank in the southwestern part of the East Sea and flowed southward on the top of the East Sea Proper Water. They also reported that the appearance of cold water mass along the Korean coast in summer had its origin from North Korean Cold Water. Seung (1986) suggested that the bottom cold water pool in the southwestern East Sea was constrained and lifted upward towards the Korean coast due to geostrophic adjustment.
In general, volume of water through the Korea Strait is at its maximum from summer to autumn and its minimum from winter to spring (Kawabe 1982; Lim and An 1985;
Teague et al . 2002; Kim et al . 2004). More recent estimate by Takikawa et al . (2005) revealed that the northeastward current had two maxima from spring to autumn and a minimum in January. They argued that the spring peak is stronger in the eastern channel of the strait, while the autumn peak is stronger in the western channel of the strait based on maximum velocity differences.
Annual mean currents at the center of the western channel include the Tsushima Warm Current, which occupies the upper two-thirds of water column, and the Korea Strait Bottom Cold Water, which occupies the lower one-third of water column (Park et al . 1999a). Based on interaction
between the Tsushima Warm Current (Kawabe 1982;
Fang et al . 1991; Lie and Cho 1994; Isobe 1999) and the bottom cold water (Lim and Chang 1969; Han 1972; Lim 1973; Kim and Lee 2004) in summer and autumn, a thermocline and seasonal front are formed in the Korea Strait (Lee et al . 1984; Park et al . 1999b).
Phytoplankton related studies in the Korea Strait and adjacent waters remain limited. Distribution and composition of phytoplankton based on microscopic observations have been reported across the Korea Strait (Chae 1969) and also from the southwestern East Sea (Shim and Lee 1983;
Shim et al . 1989; Lee and Shim 1990). Chung and Kang (1996) reported the presence of pico-sized prasinophyte, Pycnococcus provasoli , in the Strait using the High Performance Liquid Chromatography (HPLC) and Electron microscopy. Park and Park (1997), Park et al . (1999b), and Park (2006) added to the knowledge-base of phytoplankton community structure, including information on picoplankton in the Korea Strait and southwestern East Sea, using HPLC analysis. Kang et al . (2004) quantified autotrophic cyanobacteria, Synechococcus and Prochlorococcus , by cytometric cell counting in the East Sea. Noh et al . (2005) combined different analytical methods using microscopy, flow cytometry and HPLC to elucidate phytoplankton ecology near Ieodo Ocean Research Station, located approximately 150 km southwestward of Cheju Island.
It is known that thermohaline structure in the western channel of the Korea Strait forms a strong summer stratification from late spring to autumn, while increased surface cooling and turbulent mixing leads to destratification by early winter (Lee et al . 1984).
The dominance of large autotrophic organisms is generally associated with nutrient-rich environments linked to strong vertical mixing and upwelling. Whereas the prevalence of small autotrophs is generally restricted to oligotrophic environment, such as the upper part of thermocline during stratification (Arin et al . 2005). There exists a paucity of data on annual phytoplankton community structure associated with physicochemical variation in the western channel of the Korea Strait.
This study focused on trying to elucidate annual
interaction between phytoplankton community structure
and physicochemical environments related to water
stratification and mixing, which were induced by various
water masses passing through the western channel of the
Korea Strait. In contrast to previous studies (Shim and
Lee 1983; Shim et al . 1989; Lee and Shim 1990; Park and
Park 1997; Park et al . 1999b), we conducted a long-terms
investigation where physicochemical and biological data
were collected on a regular basis (at least once a month) for 12 months.
2. Materials and methods
Study site and sampling
CTD measurements and water sample collections were performed onboard R/V Jangmok at fixed station M (34.77
oN, 129.13
oE) located between Geoje island and Tsushima island at least once a month from March 2006 to February 2007 (Fig. 1), as a part of an interdisciplinary project (Pacific Ocean Study on Environment and Interactions between Deep Ocean and National seas, POSEIDON) looking at interactions between the Pacific Ocean and the neritic seas around Korea. Temperature and salinity profiles were obtained by CTD (SBE 911) measurement. Water samples were obtained with Niskin bottles mounted on Rosette sampler at 8 standard depths (1, 5, 10, 20, 30, 50, 75, 100 m) for nutrient, chlorophyll a and microscopic analyses.
Nutrients analyses
For nutrient (nitrate, nitrite, phosphate and silicate) analyses, 40 ml of GF/F filtrate were frozen onboard.
Nutrient analyses were made with a Flow Injection Analyser (Parsons et al . 1984)
Microscopic observation
For identification and enumeration of phytoplankton, 500 ml subsamples were stored in polyethylene bottles, and fixed with 0.5% Lugol’s solution. Sample volumes were concentrated to approximately 20 ml by decanting upper part of water as described by Sournia (1978). A Sedwick-Rafter counting chamber was used to estimate
numerical abundance of phytoplankton under Zaiss Axio plan 2 microscope at a magnification of 200X.
Magnifications of 400X and 1000X were used for detailed examination. Most diatoms and dinoflagellates were identified down to species level, while the remaining organisms were grouped as ‘other classes’. However, nano sized plankton (3
μm-10
μm), which was difficult to identify under light microscopy, was classified only as nanoplankton.
Chlorophyll
ameasurements
For measurement of total chlorophyll a (chl a and phaeopigments) content, a 2.7 L of seawater was immediately filtered onboard through a 47 mm GF/F filter with a nominal pore size of 0.7
μm. Filter samples were stored under -20
oC and analyzed using a Turner Designs 10-AU fluorometer within 24 hours (Yentsch and Menzel 1963;
Strickland and Parsons 1972). Filters were extracted in 90% acetone in the dark at -20
oC for 24 hours. Phaepigment fluorescence was determined after acidifying the extracts with few drops of 1.2 M hydrochloric acid. The fluorescence reading was corrected using instrument calibrations obtaining appropriate acidification coefficient and door factor. Total chl a concentration was size-fractionated into three groups; microplanktonic (>20
μm), nanoplanktonic (3-20
μm) and picoplanktonic (<3
μm) chl a , subsequent to which 100 ml water samples were filtered through a Nytex mesh (20
μm pore size) and an Isopore membrane filter (3
μm pore size) under gravity. The original portion of water (total biomass) and each size-fractionated filtrate (<20
μm and <2
μm respectively) were used to measure fluorescence unit (FSU) by fluorometer. The proportion of each size fraction to total biomass was then determined using measured FSU values. Based on this, each fractionated chl a concentration was calculated.
3. Results
Hydrography
The profile of temperature and salinity at station M during the survey period exhibited characteristic features of mixing and stratification (Fig. 2). The water column was mixed from March to May 2006, and from December 2006 to February 2007. There was a clear thermohaline stratification between June and November 2006. The slopes of temperature and salinity from surface (1 m) to bottom (100 m) in absolute values during mixed periods ranged from 21.39 to 58.36 and from 297.39 to 1712.80, respectively. However, comparative values during the Fig. 1. Map of sampling station M in the western chan-
nel of the Korea Strait.
264 Shon, D. H. et al.
stratified period were smaller, ranging from 4.85 to 18.71 for temperature, and from 23.30 to 68.22 for salinity (Fig 2). Due to these characteristics, the study period is hereafter divided into three periods; mixed I (March-May 2006), stratified (June-November 2006) and mixed II (December 2006-Feburuary 2007) (Fig. 2 and 3). During the mixed I and II periods, averaged temperature profiles showed that temperature gradually decreased with depth from 14.4
oC at surface to 11.6
oC at the depth of 100 m, and from 15.6
oC at surface to 13.0
oC at the depth of 100 m, respectively (Fig. 3a and c). The profile of water temperature was slightly higher during the mixed II period through the water column. Averaged temperatures of over 14
oC was only observed in the upper 20 m of the
water column during mixed I, and in the upper 80 m of the water column during mixed II (Fig. 3a and c).
Averaged salinity profiles were rather homogeneous with depth (Fig. 3a and c). Averaged salinities ranged from 34.3 PSU to 34.5 PSU during mixed I, and from 34.1 PSU to 34.3 PSU during mixed II (Fig. 3a and c). During the stratified period, averaged temperature decreased rapidly from surface (22.2
oC) to depth of 100 m (12.4
oC), while averaged salinity increased from surface (32.1 PSU) to depth of 100 m (34.3 PSU) (Fig. 3b). The Korea Strait Bottom Cold Water is at its strongest in August, when there is strong influence from the northward upper currents (Kim and Lee 2004). Evidence of bottom cold water (below 80 m) during summer stratification is shown Fig. 2. The vertical profiles of temperature and salinity from March 2006 to February 2007 (Upper X axis - practical
salinity unit (PSU); Lower X axis - temperature in
oC).
in Fig. 3b as the bottom cold water is defined as temperature below 10
oC and salinity between 34.0 PSU and 34.3 PSU (Lim and Chang 1969; Kim and Lee 2004).
Averaged water temperature decreased drastically from 14.7
oC at 80 m to 12.4
oC at 100 m during the stratified period, while averaged salinity between 80 m and 100 m was around 34.29 PSU (Fig. 3b).
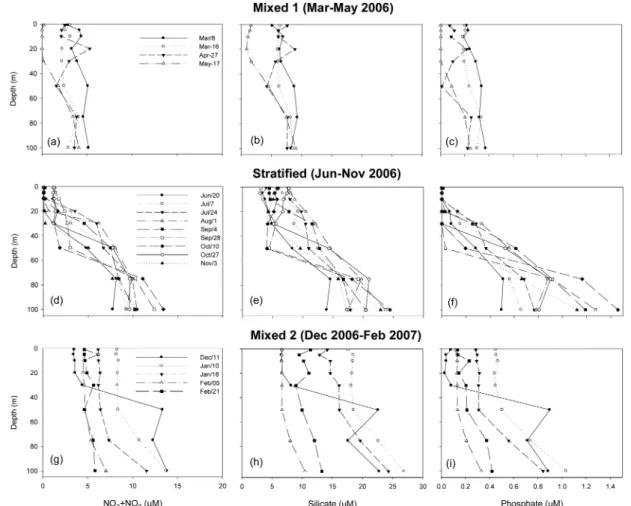
Nutrients
During the mixed I period, distribution of nutrients (nitrate+nitrite, silicate and phosphate) was vertically homogeneous compared to the stratified period. Nitrate+
nitrite concentration generally ranged between below detection limit and 5.5
μM during this period (Fig. 4a).
Silicate concentration ranged between ca. 1
μM and 9
μM during the mixed I period, while phosphate concentration was lower than 0.4
μM through the water column (Fig. 4b and c). The profile of averaged Nitrate+nitrite and phosphate concentrations gradually decreased in the upper 30 m from March to May 2006, while both nutrients were almost depleted on May 17th 2006 (Fig. 4a and c).
Averaged silicate concentration in the upper 30 m also exhibited its lowest values on May 17th (Fig. 4b). During the stratified period, nutrient profiles increased with depth. In general, the concentrations of nitrate+nitrite and silicate in the upper 10 m of the water column were lower than 2
μM and 9
μM, respectively (Fig. 4d and e). Phosphate concentration above 10 m showed below detection limit during this period (Fig. 4f). Higher concentrations of all
three nutrients were generally found below 10 m (Fig. 4d, e and f). The concentrations of nitrate+nitrite, silicate and phosphate reached their highest values at depth of 100 m on October 10th 2006 (13.38
μM, 24.46
μM and 1.46
μ
M, respectively) (Fig. 4d, e and f). During the mixed II period, nutrients were homogeneously distributed in the upper 50 m, except on December 11th 2006 when erosion of stratification was still traced (Fig. 4g, h and i). On December 11th, the concentrations of nitrate+nitrite, silicate and phosphate rapidly increased from 20 m (3.58
μ
M, 6.68
μM and 0.03
μM, respectively) to 50 m (13.32
μ
M, 22.58
μM and 0.90
μM, respectively), while all nutrient concentrations on remaining sampling dates during the mixed II period were lower than 8.37
μM, 18.52
μM and 0.50
μM, respectively, in the upper 50 m of the water column (Fig. 4g, h and i). The concentrations of nitrate+nitrite and silicate between 75 m and 100 m depths ranged from 5.36
μM to 13.82
μM, and from 8.01
μ
M to 26.84
μM, respectively, during the mixed II period, while that of phosphate ranged from 0.21
μM to 1.03
μM (Fig. 4g, h and i). The profile of all nutrients above 30 m increased from December 11th 2006 to January 10th 2007, and then decreased gradually until Feb 5th (Fig. 4g, h and i).
As subsurface chlorophyll maxima (SCM) were generally
observed in the upper 30 m of the water column
throughout the study (Fig. 7), averaged proportion of each
water column integrated nutrient concentration for the
mixed I, stratified and mixed II periods was calculated
Fig. 3. The vertical profiles of mean temperature and salinity during the mixed I, stratified and mixed II periods
(Upper X axis - practical salinity unit (PSU); Lower X axis - temperature in
oC). Error bars indicate 95% con-
fidence interval of mean temperature and salinity.
266 Shon, D. H. et al.
between the upper 30 m and whole water column (Table 1). The highest integrated nitrate+nitrite and silicate concentrations above 30 m were 162.36 m mol m
-2and 329.03 m mol m
-2, respectively, during the mixed II period, while the lowest integrated concentrations of nitrate+nitrite and silicate above 30 m were observed during the stratified (37.29 m mol m
-2) and mixed I (151.78 m mol m
-2) periods, respectively. Integrated proportions of nutrient concentrations in the upper 30 m
of the water column between the mixed I and II periods were similar and higher compared to that of nutrient concentrations during the stratified period (Table 1). The integrated proportions of nitrate+nitrite and silicate concentrations above 30 m during the mixed I period were 23.34% and 23.53% respectively, while that of nitrate+nitrite and silicate concentrations during the mixed II period were 22.37% and 23.15%, respectively (Table 1). The lower integrated proportions of nitrate+
Fig. 4. Nitrate+nitrite, silicate, and phosphate concentrations (
μM) during the mixed I, stratified and mixed II periods.
Table 1. Mean concentration and proportion of integrated nitrate+nitrite, silicate and phosphate in the upper 30 m of the water column during the mixed I, stratified and mixed II periods
Water column state NO
3+NO
2Si OP
Mixed I
(Mar-May 2006) Integrated concentration above 30 m (m mol m
-2) 70.89 151.78 4.06
% integrated above 30 m 23.34 23.53 20.54
Stratified
(Jun-Nov 2006) Integrated concentration above 30 m (m mol m
-2) 37.29 187.11 1.00
% integrated above 30 m 6.70 15.89 2.36
Mixed II
(Dec 2006-Feb 2007) Integrated concentration above 30 m (m mol m
-2) 162.36 329.03 6.43
% integrated above 30 m 22.37 23.15 16.15
The proportion of each nutrient was calculated using integrated concentration values between upper 30 m and whole water column.
nitrite and silicate above 30 m of the water column during the stratified period (6.70% and 15.89%, respectively) explained that stratification restricted the upward movement of enriched nutrients from bottom layer (Table 1).
Phytoplankton composition
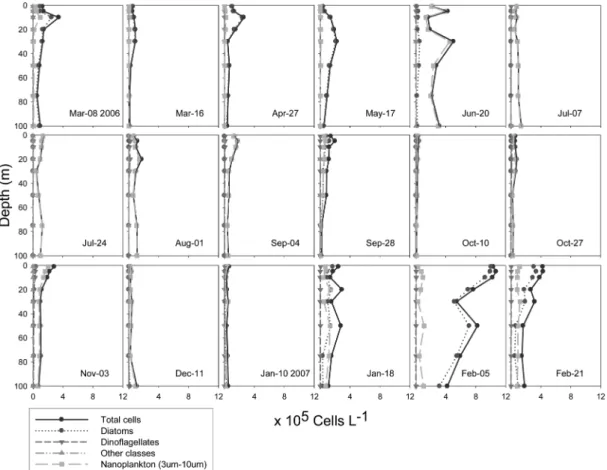
Table 2 lists the averaged proportions of water column integrated phytoplankton abundance during the mixed I, stratified and mixed II periods. Species accounting for more than 10% of total population on any occasion (any sampling date or depth) were defined as dominant species during each period. The abundance of total phytoplankton population and each group (Fig. 5), and the proportion
between dominant species and the total phytoplankton population (Fig. 6) for 18 sampling dates are presented.
-Mixed I period
Diatoms dominated abundance during the mixed I period between March 8th and May 17th 2006, coinciding with a combination of vertical mixing and nutrient supply from the bottom layer. Quantitatively, averaged diatom and nanoplankton populations occupied 88.61% and 10.00% of water column integrated total phytoplankton population, respectively, during this period (Table 2). The highest total phytoplankton cell density during mixed I was 3.4
×10
5cells l
-1at the depth of 10 m on March 8th 2006 (Fig. 5), while Chaetoceros socialis dominated Table 2. Mean proportion of water column integrated abundance during the mixed and stratified periods.
Phytoplankton species dominated over 10% of total population on any occasion (any sampling date or depth) including total diatom, total dinoflagellate, total other classes, and nanoplankton group (3
μm-10
μm)
Mixed I (Mar-May 2006) Stratified (Jun-Nov 2006) Mixed II (Dec 2006-Feb 2007)
Mean
±SE (%) n Mean
±SE (%) n Mean
±SE (%) n
Bacillariophyceae
Bacteriastrum sp 00.12
±0.12* 4 00.00
±0.00 9 00.00
±0.00 5
Chaetoceros compressus 00.00
±0.00 4 02.00
±1.99* 9 01.57
±0.52 5
Chaetoceros socialis 47.07
±15.54* 4 00.49
±0.47* 9 29.43
±13.37* 5
Chaetoceros sp. 01.10
±0.43* 4 00.00
±0.00 9 00.00
±0.00 5
Cylindrotheca closterium 01.09
±0.59* 4 00.17
±0.07 9 00.91
±0.30 5
Detonula pumila 02.70
±2.11* 4 00.01
±0.01 9 00.12
±0.05 5
Eucampia zodiacus 02.38
±1.33* 4 00.06
±0.04 9 01.21
±0.61 5
Lauderia annulata 04.67
±1.94* 4 00.00
±0.00 9 01.42
±0.67 5
Leptocylindrus danicus 05.30
±4.93* 4 00.02
±0.01 9 00.27
±0.23 5
Paralia sulcata 00.83
±0.28 4 00.00
±0.00 9 01.37
±0.78* 5
Skeletonema costatum 13.90
±13.06* 4 00.39
±0.17 9 02.45
±1.25* 5
Thalassionema nitzshioides 00.06
±0.05 4 01.32
±0.62* 9 00.32
±0.11 5
Total Bacillariophyceae 88.61
±2.14 4 10.35
±5.17 9 47.84
±13.35 5 Dinophyceae
Gymnodinium sp. 00.00
±0.00 4 00.90
±0.39* 9 00.00
±0.00 5
Gyrodinium sp. 00.19
±0.11 4 04.28
±1.76* 9 01.02
±0.52 5
Total Dinophyceae 01.39
±0.52 4 06.85
±2.18 9 02.00
±0.91 5
Dictyochophyceae
Dictyocha fibula 00.00
±0.00 4 00.03
±0.02 9 00.04
±0.04 5
Dictyocha speculum 00.00
±0.00 4 00.11
±0.06 9 00.02
±0.02 5
Ebriidea
Ebria tripartita 00.00
±0.00 4 00.01
±0.01 9 00.00
±0.00 5
Total other classes 00.00
±0.00 4 00.16
±0.07 9 00.06
±0.06 5
Nanoplankton (<10
μm) 10.00
±2.66 4 82.63
±5.36 9 50.11
±12.50 5
*Species which contributed over 10% of total population during the mixed I, stratified and mixed II periods are indicated by an asterisk.
Dictyochophyceaen and Ebriidean species were listed even though their dominance did not exceed 10%.
268 Shon, D. H. et al.
Fig. 5. Total phytoplankton cell density; diatoms, dinoflagellates, other classes and nano sized plankton (3
μm-10
μm).
Other classes include Dictyochophyceae and Ebriidea.
Fig. 6. The proportion of dominant species accounting for more than 10% of total population on any occasion between
March 2006 and February 2007.
around 70% of total abundance at that depth (Fig. 6).
Chaetoceros socialis was the most dominant diatom through the water column dominating 47.07% of total phytoplankton population during the mixed I period (Table 2). The exception was on March 16th 2006, when Skeletonema costatum was dominant throughout the water column (around 70% and 6.2
×10
4cells l
-1at 30 m) (Fig. 5 and 6). The presence of Leptocylindrus danicus was observed on May 17th 2006 above 75 m (>49% and 6.9
×10
4cells l
-1at 10 m) (Fig. 5 and 6). Apart from the three species mentioned above, on at least one occasion Bacteriastrum sp., Chaetoceros sp . , Cylindrotheca closterium , Detonula pumila, Eucampia zodiacus , and Lauderia annulata dominated over 10% of total phytoplankton population during the mixed I period (Table 2).
-Stratified period
Total cell densities of phytoplankton during the stratified period between June 20th and November 3rd 2006 ranged from 1.1
×10
4cells l
-1to 5.0
×10
5cells l
-1(Fig. 5). Apart from June 20th, when highest total phytoplankton abundance was found at 30 m (5.0
×10
5cells l
-1), total phytoplankton cell abundance was generally at least 2.9
×10
5cells l
-1through the water column during this period (Fig. 5).
Averaged proportion of water column integrated nanoplankton population during the stratified period dominated 82.63% of total phytoplankton abundance, while diatom and dinoflagellate made up 10.35% and 6.85%
respectively (Table 2). The dominance of nanoplankton was observed at most depths (>55%), except on September 28th during the stratified period (Fig. 6). On September 28th, diatoms dominated abundance in the upper 50 m of the water column (around 67% and 1.2
×10
5cells l
-1at 5 m) (Fig. 5 and 6). The most dominant diatom species on September 28th was Chaetoceros compressus (around 43% and 6.2
×10
4cells l
-1at surface), while cell densities of Thalassionema nitzshioides ranged from 6.3
×10
2to 6.3
×10
3cells l
-1throughout the water column (Fig. 5 and 6). Averaged proportion of water column integrated Thalassionema nitzshioides population was 1.32% during the stratified period, while that of dinoflagellates, Gymnodinium sp. and Gyrodinium sp. yielded 0.90% and 4.28%, respectively (Table 2). Gyrodinium sp. was the most dominant species during the stratified period. Apart from diatom, dinoflagellate and nanoplankton groups, two Dictyochophyceae ( Dictyocha fibula and Dictyocha speculum ) and one Ebriidea ( Ebria tripartita ) species were classified as ‘other classes’. The averaged proportion
of water column integrated ‘other classes’ was 0.16%
during the stratified period (Table 2).
-Mixed II period
During the mixed II period, nanoplankton dominated abundance on December 11th (>81%) and January 10th (>42%) (Fig. 6). Chaetoceros socialis bloom began from January 18th, while surface cell density of this species reached over 8.7
×10
5cells l
-1(around 81%) on February 5th (Fig. 5 and 6). Highest total cell density among the three periods was found on February 5th (11
×10
5cells l
-1at 5 m) (Fig. 5). The averaged proportion of depth integrated Chaetoceros socialis during mixed II was 29.43%, while that of Paralia sulcata and Skeletonema costatum was 1.37% and 2.45%, respectively (Table 2).
Paralia sulcata and Skeletonema costatum made up over 10% of total phytoplankton population on January 10th at the depth of 100 m (around 27%) and at surface (around 16%) (Fig. 6). Averaged proportions of water column integrated nanoplankton and diatom during the mixed II period were 50.11% and 47.84%, respectively (Table 2).
Averaged proportion of integrated nanoplankton was slightly higher than that of diatom during this period, while the dominance of nanoplankton lasted until January 2007 (Table 2, Fig. 6). The averaged proportion of integrated
‘other classes’ was 0.06% of total phytoplankton population during the mixed II period (Table 2).
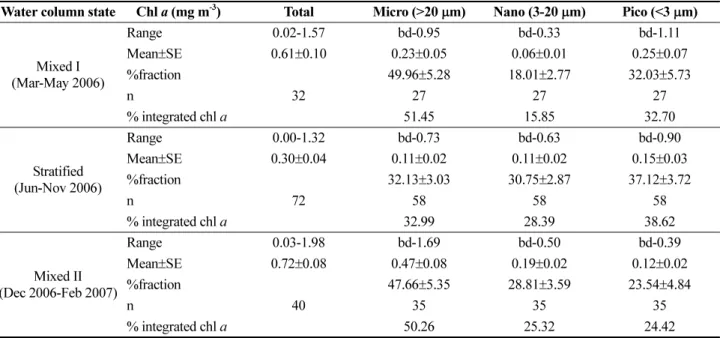
Chlorophyll
adistribution
Averaged total chl a concentrations during the mixed I and II periods were 0.61 mg m
-3and 0.72 mg m
-3, respectively. This was more than a two-fold increase compared to the stratified period (0.30 mg m
-3) (Table 3).
As expected, the vertical mixing and convection process
led to higher chl a concentration during the mixed periods
than during the stratified period (Arin et al . 2005). The
averaged proportion of microplanktonic (>20
μm) chl a ,
which was 49.96% of the total chl a , was higher than that of
nanoplanktonic (3-20
μm) and picoplanktonic chl a
(<3
μm), which was 18.01% and 32.03%, respectively,
during the mixed I period (Table 3). Similar pattern was
observed during the mixed II period. Averaged micro-
planktonic chl a contribution to total chl a during this
period was 47.66%, while averaged nanoplanktonic and
picoplanktonic chl a contributions were 28.81% and
23.54%, respectively. However, concentration of pico size
fractionated chl a was highest (37.12%) during the
stratified period, compared to that of micro and nano size
fractionated chl a (32.13% and 30.75%, respectively)
270 Shon, D. H. et al.
(Table 3). These results indicate that the process of vertical mixing and nutrient supply from the bottom would benefit the growth of larger cells during the mixed period (Margalef 1978). However, smaller cells which have higher cell surface to volume ratios, are better competitors at low nutrient environments during stratification (Kiørboe 1993).
Fig. 7 shows the concentration of total chl a and each sized-fractionated chl a during the study period. Total chl a concentrations at depth of 10 m on March 8th (1.24 mg m
-3) and March 16th (1.57 mg m
-3) 2006 were highest through the water column during the mixed I (Fig. 7).
Microplanktonic chl a concentrations were higher than the other two size-fractionated chl a concentrations throughout the water column on March 8th, while microplanktonic and picoplanktonic chl a fractions competed on April 27th and May 17th, respectively (Fig. 7).
During the stratified period, higher concentration of picoplanktonic chl a was observed on July 7th, July 24th, October 10th and October 27th at the depth of SCM (0.75 mg m
-3at 20 m, 0.32 mg m
-3at 10 m, 0.03 mg m
-3at 10 m and 0.77 mg m
-3at 10 m, respectively) (Fig. 7). On September 28th, higher concentration of microplanktonic chl a was established in the upper 20 m of the water column (Fig. 7). The microplanktonic chl a concentration at 10 m on September 28th was 0.73 mg m
-3, while nano- planktonic and picoplanktonic chl a concentrations were 0.03 mg m
-3and 0.36 mg m
-3, respectively. The higher
microplanktonic chl a concentration above 20 m of the water column on September 28th coincided with bloom of Chaetoceros compressus , which was the dominant diatom on that day (Fig. 5 and 6).
During the mixed II period, the highest total chl a concentration was observed on February 5th (Fig. 7).
Total chl a concentration at 75 m on February 5th was 1.98 mg m
-3, while microplanktonic chl a concentration at that depth was 1.69 mg m
-3(Fig. 7). As physicochemical dynamics were on transition from the stratified to the mixed periods in December (Lee et al . 1984), dominance of small size-fractionated chl a biomass was still observed on December 11th (at the beginning of mixed II period) (Fig. 7). The picoplanktonic chl a concentration at 5 m on December 11th was 0.37 mg m
-3, while microplanktonic and nanoplanktonic chl a concentrations were 0.01 mg m
-3and 0.08 mg m
-3, respectively. The higher concentrations of microplanktonic chl a were observed above 20 m of the water column on January 18th and February 21st, and through the water column on February 5th 2007. Micro- planktonic chl a concentrations at 20 m on January 18th, February 5th and February 21st were 0.60 mg m
-3, 1.18 mg m
-3and 0.29 mg m
-3, respectively (Fig. 7).
4. Discussion
Interaction between the northward Tsushima Warm Current (Kawabe 1982; Isobe 1999) and the southward Table 3. Total and size fractionated chl a during the mixed and stratified periods
Water column state Chl a (mg m
-3) Total Micro (>20
μm) Nano (3-20
μm) Pico (<3
μm)
Mixed I (Mar-May 2006)
Range 0.02-1.57 bd-0.95 bd-0.33 bd-1.11
Mean
±SE 0.61
±0.10 0.23
±0.05 0.06
±0.01 0.25
±0.07
%fraction 49.96
±5.28 18.01
±2.77 32.03
±5.73
n 32 27 27 27
% integrated chl a 51.45 15.85 32.70
Stratified (Jun-Nov 2006)
Range 0.00-1.32 bd-0.73 bd-0.63 bd-0.90
Mean
±SE 0.30
±0.04 0.11
±0.02 0.11
±0.02 0.15
±0.03
%fraction 32.13
±3.03 30.75
±2.87 37.12
±3.72
n 72 58 58 58
% integrated chl a 32.99 28.39 38.62
Mixed II (Dec 2006-Feb 2007)
Range 0.03-1.98 bd-1.69 bd-0.50 bd-0.39
Mean
±SE 0.72
±0.08 0.47
±0.08 0.19
±0.02 0.12
±0.02
%fraction 47.66
±5.35 28.81
±3.59 23.54
±4.84
n 40 35 35 35
% integrated chl a 50.26 25.32 24.42
Total and fractionated chl a range, mean and the proportion of each fraction to total chl a are given as well as mean proportion of
water column integrated chl a . bd = below detection.
bottom cold water (Lim and Chang 1969; Han 1972; Lim 1973; Kim and Lee 2004), led to the formation of thermohaline at intermediate depths during the stratified period in the western channel of the Korea Strait. Vertical mixing induced by intense surface cooling in late autumn through to winter was observed during the mixed I and II periods (Lee et al . 1984). Vertical mixing and convection process of the water column induced nutrient supply from the bottom layer up to the euphotic zone and the dominance of diatom during the mixed periods (Arin et al . 2005). As a result of this physicochemical process, chl a concentration was higher during the mixed periods than during the stratified period. In addition, microplanktonic chl a contribution to total chl a concentration was higher than nanoplanktonic and picoplanktonic chl a contributions during the mixed periods (Table 3). Chl a concentration measured by Park et al. (1999b) across the Korea Strait in August and October 1996 ranged from 0.01 mg m
-3to 1.28 mg m
-3. In this study, chl a concentration during the stratified periods range from 0.00-1.32 mg m
-3. Averaged proportion of picoplanktonic chl a concentration was
higher (37.12%) than that of micro and nano size fractionated chl a concentrations (32.99% and 30.75%
respectively) during the stratified period. In other words, as stratification blocked the upward movement of nutrients to subsurface, small phytoplankton prevailed over large phytoplankton in the competition (Arin et al . 2005). In July 1999, averaged proportion of water column integrated microplanktonic chl a and nano+pico size fractionated chl a was measured by Park (2006) in the southwestern East Sea. The nearest station from her study is approximately 60 km northeastward from our study area. Microplanktonic and nano+picoplanktonic chl a proportions measured by Park (2006) at that station (B4) were 34% and 66%, respectively. These values were also comparable to the present study during the stratified period (32.99% and 67.01%, respectively) (Table 3).
During transition from the stratified period to the mixed II period, dominance of nanoplanktonic and picoplanktonic chl a fractions was still observed on December 11th 2006 (Fig. 7). This may suggest that autotrophic microplankton, such as diatoms, require some time to adapt a new water Fig. 7. Total and fractionated chl a concentration (mg m
-3); microplanktonic (>20
μm), nanoplanktonic (3-20
μm) and
picoplanktonic (<3
μm) chl a .
272 Shon, D. H. et al.
column environment. Higher averaged water temperature through the water column was found during the mixed II than during the mixed I, as the highest water temperature in the upper part of the water column during the stratified period influenced on the early stage of mixed II (Fig. 3).
As a result, small size-fractionated organisms (pico and nano) still dominated abundance at the beginning of the mixed II period. Averaged proportion of water column integrated diatom population was lower during the mixed II (47.84%) than during the mixed I (88.61%), while that of nanoplankton population was higher during the mixed II (50.11%) than during the mixed I (10.00%) (Table 2).
The dominance of Chaetoceros socialis was observed during the mixed I and II periods (over 47% and 29%, respectively) (Table 2). The presence of Chaetoceros socialis in the Korea Strait was reported by Chae (1969) in May 1967, and Shim and Lee (1983) in September 1981. Chaetoceros socialis is known as a neritic species along the Norwegian coast (Eilertsen et al . 1981), but it is also found in both neritic and deep-water environments through the water column in Northern Waters (Booth and Smith 1997; Booth et al . 2002) and in Georges Bank (Norrbin et al . 1996). As an individual cell, the size of Chaetoceros socialis is 2-14
μm (Tomas 1997). However as a chain form, the size of this species extends to over 100
μm. Chaetoceros socialis has one specialized long seta with three other setae on each cell, while colonies of this species contain coiled chains of cells in a gelatinous matrix (Tomas 1997; Booth et al . 2002). These mats of polymer gels make the mucoid Chaetoceros socialis colonies aggregate further, and settle rapidly to the bottom (Norrbin et al . 1996). In the present study, Chaetoceros socialis mostly formed chains in subsurface waters at the early stage of the mixed I period, and throughout mixed II period. However, this species formed aggregates and had a firm structure of long setae uniting the chains into clusters toward the end of the mixed I (on May 17th 2006) when available nutrient concentrations decreased in subsurface waters (Fig 4a, b and c). In addition, this species was found at the bottom of the water column through the mixed I and II periods as mucoid colonies.
The formation of Chaetoceros socialis colonies is sudden and contribute to faster sinking compared to a single cell or chains (Booth et al . 2002). Norrbin et al . (1996) also suggested that such large, and perhaps unpalatable colonial forms discourage predation by copepods and appendicularians at the bottom of the water column.
The dominance of Skeletonema costatum on March 16th 2006 may have originated from an episodic coastal
influence, as this species is one of the most common bloom causative organisms from February to November (except April) in Masan and Jinhae bays where located northwestward from the station M (see Fig. 1) (Lee and Kim 2008). Skeletonema costatum appeared within a wide range of water temperatures (6.3-27.1
oC) and salinities (24.79-33.00 PSU) in Jinhae bay between 1984 and 2006 (Lee and Kim 2008). The dominance of Leptocylindrus danicus was observed in the upper 50 m of the water column on May 17th 2006 (Fig. 6) when nutrient concentrations were almost depleted above 30 m of the water column (Fig 4a, b and c). In the western Mediterranean Sea, Leptocylindrus danicus was reported as one of the most abundant species in subsurface waters, while there were low nutrients at the end of upwelling period and the beginning of stratification (Barcena et al . 2004).
According to Barcena et al . (2004), Leptocylindrus danicus bloom is indicative of nutrient depletion just before and after water stratification. Leptocylindrus danicus , which is one of the dominant summer diatoms in cold water regions (Tomas 1997), was also reported by Chae (1969) as one of the most dominant diatoms in the Korea Strait in May 1967. Paralia sulcata , which has a competitive advantage in low light, is generally known as both planktonic and benthic diatom (McQuoid and Nordberg 2003). As Paralia sulcata has a tychopelagic nature, this species is mostly reported in the water column during upwellings (Bao et al . 1997; McQuoid and Nordberg 2003). In this study, Paralia sulcata did not typically form large blooms, but was found during the mixed I (0.83%) and II (1.37%) periods (Table 2), when the upward movement of the water column was much more robust than during the stratified period.
On September 28th, diatom dominance was observed (ex. Chaetoceros compressus , Thalassionema nitzshioides ), while nanoplakton dominated the water column during the stratified period (Fig. 6). The 13th typhoon ‘Shanshan’
passed directly above the Korea Strait on September 17th (KORDI 2006). While the influence of fresh water is great in summer and autumn in the Korea Strait due to heavy rainfall and inflow of less saline water from the East China Sea (Shim et al . 1989), the typhoon might have been responsible for triggering the observed diatom bloom in September 2006.
Nanoplankton, which was smaller than 10
μm (ranged
3
μm-10
μm) and difficult to identify under light
microscopy, dominated abundance during the stratified
period (82.63%, Table 2). Shim and Lee (1983) identified
cryptophytes as one of the most abundant nano sized
algae in the southwestern East Sea, followed by Gymnodinium sp. and Chroomonas sp. Park and Park (1997) and Park et al . (1999b) investigated phytoplankton community structure in the Korea Strait using quantitative measurements of phytoplankton marker pigments by HPLC. They classified diatoms and pymnesiophytes as dominant groups, while cyanobacteria, prasinophytes and prochlrolophytes were classified as secondarily important groups. In addition, they confirmed the presence of dinoflagellates and cryptophytes as minor groups.
According to reports from Park and Park (1997) and Park et al . (1999b), nanoplankton enumerated in this study may contain pymnesiophytes, prasinophytes and crytophytes.
There was no numerically enumerated data available for picoplankton during this study. However, the measurement of picoplanktonic chl a provided valuable information on its contribution to total biomass. Pico size- fractionated chl a in this study may be associated with the presence of cyanobacteria and prochlrolophytes according to Park and Park (1997) and Park et al . (1999b).
Annual interaction of water masses passing through the western channel of the Korea Strait influenced chemico- physical characteristics of mixing and stratification processes of the water column. The nutrient distribution was homogeneous through the water column during the mixed periods, compared to during the stratified period when nutrients were depleted in the upper layer. Vertical mixing and convection process of the water column induced nutrient supply from the bottom layer up to the euphotic zone, and the dominance of microplankton, such as diatom. Small sized organisms (pico and nanoplankton), which are better competitors at low nutrient environments, largely increased their population density during the stratified period. In terms of total chl a biomass, the mixed periods provided more productive environments than the stratified period. In addition, microplanktonic chl a contribution to total chl a concentration was higher than nanoplanktonic and picoplanktonic chl a contributions during the mixed periods. Picoplanktonic chl a contribution was the highest during the stratified period.
Annual variation of phytoplankton community structure induced by the interaction of water masses passing through the western channel of the Korea Strait may provide the first step to understanding interrelationships between adjacent phytoplankton ecosystems in the Northwest Pacific region. In particular, the influence of Kuroshio intrusion through the northeast of Taiwan or the southwest of Kyushu on phytoplankton ecosystem in the Korea Strait is being looked at by the POSEIDON project.
As the POSEIDON project is scheduled for three years from 2006 to 2008, results discussed here will only reflect the first phase of long-term monitoring. The fragmented knowledge-base of annual phytoplankton community pattern associated with physicochemical variation of the water column in the western channel of the Korea Strait may benefit from comparison with successive monitoring programs in the region.
Acknowledgements
This study was supported by a grant from KORDI’s project (PP00690). We thank the crew on R/V Jangmok for their assistance during sampling.
References
Arin, L., M. Estrada, J. Salat, and A. Cruzado. 2005. Spatio- temporal variability of size fractionated phytoplankton on the shelf adjacent to the Ebro river (NW Mediterra- nean). Cont. Shelf Res., 25, 1081-1095.
Baecena, M.A., J.A. Flores, F.J. Sierro, M. Perez-Folgado, J.
Fabres, A. Calafat, and M. Canals. 2004. Planktonic response to main oceanographic changes in the Alboran Sea (Western Mediterranean) as documented in sedi- ment traps and surface sediments. Mar. Micropaleon., 53, 423-445.
Bao, R., M. Varela, and R. Prego. 1997. Mesoscale distribu- tion patterns of diatoms in surface sediments as tracers of coastal upwelling of the Galician shelf (NW Iberian Peninsula). Mar. Geo., 144, 117-130.
Beardsley, R.C., R. Limeburner, H. Yu, and G.A. Cannon.
1985. Discharge of the Changjiang (Yangtze River) into the East China Sea. Cont. Shelf Res., 4, 57-76.
Booth, B.C. and W.O. Smith. 1997. Autotrophic flagellates and diatoms in the Northeast Water Polynya, Green- land: Summer 1993. J. Mar. Sys., 10, 241-261.
Booth, B.C., P. Larouche, S. Blanger, B. Klein, D. Amiel, and Z.-P. Mei. 2002. Dynamics of Chaetoceros Socialis blooms in the North Water Polynya, Baffin Bay, Can- ada. Deep-Sea Res. II, 49, 5003-5025.
Byun, S.K. and S.D. Chang. 1984. Two branches of Tsush- ima Warm Current in the Western Channel of the Korea Strait. J. Oceanol. Soc. Korea, 19, 200-209.
Choe, S. 1969. Phytoplankton studies in Korean Waters. III.
Surface phytoplankton survey of the North-eastern Korea Strait in May of 1967. J. Oceanol. Soc. Korea, 4, 1-8.
Chung, I.K. and Y.H. Kang. 1996. A marine picoplankton from Korea: Pycnococcus provasoli Guillard. J. Oceanol.
Soc. Korea, 31, 150-154.
Eilertsen, H.C., B. Schei, and J.P. Taasen. 1981. Investiga- tion of the phytoplankton community of Balsfjorden, Northern Norway: The phytoplankton 1976-1978. Abun- dance, species composition, and succession. Sarsia, 66,
274 Shon, D. H. et al.
129-141.
Fang, G., B. Zhao, and Y. Zhu. 1991. Water volume trans- port through the Taiwan Strait and the continental shelf of the East China Sea measured with current meters. p.
345-358. In: Oceanography of Asian Marginal Seas, ed.
by K. Takano. Elsevier, New York.
Guo, X., Y. Miyazawa, and T. Yamagata. 2006. The Kuro- shio onshore intrusion along the shelf break of the East China Sea: The origin of the Tsushima Warm Current. J.
Phys. Oceanogr., 36, 2205-2231.
Han, Y.H. 1972. Heat budget over the south-western part of the Japan Sea in the month of January and cold water mass in the Korea Strait. J. Oceanol. Soc. Korea, 7, 19- Isobe, A. 1999. On the origin of the Tsushima Warm Cur-23.
rent and its seasonality. Cont. Shelf Res., 19, 117-133.
Johnson, D.R. and W.J. Teague. 2002. Observations of the Korea Strait bottom cold water. Cont. Shelf Res., 22, 821-831.
Kang, J.H., W.S. Kim, K.I. Chang, and J.H. Noh. 2004.
Distribution of plankton related to the mesoscale physi- cal structure within the surface mixed layer in the south western East Sea, Korea. J. plankton Res., 26, 1515- 1528.
Kawabe, M. 1982. Branching of the Tsushima current in the Japan Sea. Part 1. Data Analysis. J. oceanogr. Soc.
Japan., 38, 95-108.
Kim, C.H. and K. Kim. 1983. Characteristics and origin of the cold water mass along the east coast of Korea. J.
Oceanol. Soc. Korea, 18, 73-83.
Kim, I.N. and T. Lee. 2004. Physicochemical properties and the origin of summer Bottom Cold Waters in the Korea Strait. Ocean and Polar Res., 26, 595-606.
Kim, Y.J., T. Takikawa, H.S. An, and J.H. Yoon. 2004. The seasonal and interannual variability of the Volume Transport through the Western Channel of the Korea Strait. J. Korean Soc. Oceanogr., 39, 155-162.
Kiørboe, T. 1993. Turbulence, phytoplankton cell size, and the structure of pelagic foodwebs. Advan. Mar. Bio., 29, 1-73.
KORDI. 2006. Pacific Ocean Study on Environment and interactions between Deep Ocean and National Seas (POSEIDON). KORDI, BSPP 06401-1828-1. 553 p. (in Korean)
Lee, J.C., J.Y. Na, and S.D. Chang. 1984. Thermohaline structure of the shelf front in the Korea Strait in early winter. J. Oceanol. Soc. Korea, 19, 56-67.
Lee, M.O. and H.K. Kim. 2008. Characteristics of algal blooms in the southern coastal waters of Korea. Mar.
Envir. Res., 65, 128-147.
Lee, W.H. and J.H. Shim. 1990. Distribution of phytoplank- ton standing crop and associated T-S properties in the Southwestern East Sea (Sea of Japan). J. Oceanol. Soc.
Korea, 25, 1-7.
Lie, H.J. and C.H. Cho. 1994. On the origin of the Tsush- ima Warm Current. J. Geophys. Res., 99, 25081-25091.
Lim, C.H. and H.S. An. 1985. The comparison of volume transport in the Korea Strait and in the Middle of the East Sea (Japan Sea). J. Oceanol. Soc. Korea, 20, 50-55.
Lim, D.B. 1973. The movement of the cold water in the Korea Strait. J Oceanol. Soc. Korea, 8, 46-52.
Lim, D.B. and S.D. Chang. 1969. On the cold water mass in the Korea Strait. J. Oceanol. Soc. Korea, 4, 71-82.
Margalef, R. 1978. Life-forms of phytoplankton as survival alternatives in an unstable environment. Oceanol. Acta, 1, 493-509.
McQuoid, M.R. and K. Nordberg. 2003. The diatom paralia sulcata as an environmental indicator species in coastal sediments. Estuar., Coast. Shelf Sci., 56, 339-354.
Nitani, H. 1972. Beginning of the Kuroshio. p. 353-369. In:
Kuroshio, ed. by H. Stommel and K. Yoshida. Univer- sity of Tokyo Press, Tokyo.
Noh, J.H., S. Yoo, J.A. Lee, H.C. Kim, and J.H. Lee. 2005.
Phytoplankton in the waters of the Ieodo Ocean Research Station Determined by microscopy, flow cytometry, HPLC pigment data and remote sensing.
Ocean and Polar Res., 27, 397-417.
Norrbin, M.F., C.S. Davis, and S.M. Gallager. 1996. Differ- ences in fine-scale structure and composition of zoop- lankton between mixed and stratified regions of Georges Bank. Deep-Sea Res. II, 43, 1905-1924.
Park, M.J., S.R. Lee, J.C. Lee, and S.K. Byun. 1999a. Tidal nontidal fluctuations of currents in the Western Channel of the Korea Strait. J. Korean Soc. Oceanogr., 34, 133- Park, M.O. 2006. Composition and distribution of phy-143.
toplankton with size fraction results at Southwestern East/Japan Sea. Ocean Sci. J., 41, 301-313.
Park, M.O. and J.S. Park. 1997. HPLC method for the anal- ysis of chlorophylls and carotenoids from marine phy- toplankton. J. Korean Soc. Oceanogr., 32, 46-55.
Park, M.O., C.H. Moon, H.S. Yang, and J.S. Park. 1999b.
Distribution of phytoplankton pigments in the Korea Strait. J. Korean Soc. Oceanogr., 34, 95-112.
Parsons, T.R., Y. Marita, and C.M. Lalli. 1984. A manual of chemical and biological methods for seawater analysis.
Pergamon Press, Oxford. 173 p.
Seung, Y.H. 1986. On the response of coastal water to the intensification of East Korea Warm Current along the East Coast of Korea - A theoretical consideration J.
Oceanol. Soc. Korea, 21, 229-235.
Shim, J.H. and W.H. Lee. 1983. Plankton study in the Southeastern Sea of Korea (I)-Phytoplankton distribu- tion in September, 1981. J. Oceanol. Soc. Korea, 18, 91- 103.
Shim, J.H., S.R. Yang, and W.H. Lee. 1989. Phytohydrogra- phy and the vertical pattern of nitracline in the southern waters of the Korean East Sea in early spring. J.
Oceanol. Soc. Korea, 24, 15-28.
Sournia, A. 1978. Phytoplankton Manual. Unesco, Paris, 337 Strickland, J.D.H. and Parsons, T.R. 1972. A practical hand-p.
book of sea water analysis. Bull. Fish. Res. Board Can., 167, 1-310.
Takikawa, T., J.H. Yoon, and K.D. Cho. 2005. The Tsush- ima Warm Current through Tsushima Straits estimated from ferryboat ADCP data. J. Phys. Oceanogr., 35, 1154-1168.
Teague, W.J., G.A. Jacobs, H.T. Perkins, J.W. Book, K.I.
Chang, and M.S. Suk. 2002. Low-frequency current observation in the Korea/Tsushima Strait. J. Phys.
Oceanogr., 32, 1621-1641.
Tomas, C.R., 1997. Identifying marine phytoplankton. Aca- demic press, San Diego, 858 p.
Yentsch, C.S. and D.W. Menzel. 1963. A method for deter- mination of phytoplankton chlorophyll and phaeophytin by fluorescence. Deep-Sea Res., 10, 221-231.
Received Jun. 30, 2008 Accepted Aug. 14, 2008