*1 Received on February 20, 2012; accepted on March 24, 2012
*2 Department of Wood Science and Technology, Kyungpook National University, Daegu 702-201, Republic of Korea
*3 Department of Wood Science, The University of British Columbia, Vancouver, B.C., V6T 1Z4, Canada
† Corresponding author : Byung-Dae Park (e-mail: [email protected])
Thermal Curing Behavior and Tensile Properties of Resole Phenol-Formaldehyde Resin/Clay/Cellulose
Nanocomposite*
1Byung-Dae Park*2† and John F. Kadla*3 ABSTRACT
This study investigated the effects of layered clay on the thermal curing behavior and tensile properties of resole phenol-formaldehyde (PF) resin/clay/cellulose nanocomposites. The thermal curing behavior of the nanocomposite was characterized using conventional differential scanning calorimetry (DSC) and tem- perature modulated (TMDSC). The addition of clay was found to accelerate resin curing, as measured by peak temperature (Tp) and heat of reaction (ΔH) of the nanocomposite’ curing reaction increasing clay ad- dition decreased Tp with a minimum at 3∼5% clay. However, the reversing heat flow and heat capacity showed that the clay addition up to 3% delayed the vitrification process of the resole PF resin in the nano- composite, indicating an inhibition effect of the clay on curing in the later stages of the reaction. Three different methods were employed to determineactivation energies for the curing reaction of the nanocomposite. Both the Ozawa and Kissinger methods showed the lowest activation energy (E) at 3%
clay content. Using the isoconversional method, the activation energy (Eα) as a function of the degree of conversion was measured and showed that as the degree of cure increased, the Eα showed a gradual decrease, and gave the lowest value at 3% nanoclay. The addition of clay improved the tensile strengths of the nanocomposites, although a slight decrease in the elongation at break was observed as the clay con- tent increased. These results demonstrated that the addition of clay to resole PF resins accelerate the curing behavior of the nanocomposites with an optimum level of 3% clay based on the balance between the cure kinetics and tensile properties.
Keywords : cellulose, clay, cure kinetics, nanocomposite, resole phenolic resin, modulated differential scanning calorimetry, tensile properties
1. INTRODUCTION
In recent years, there has been a tremendous increase in the amount of research, and the number of publications on nanocomposite using nanomaterials such as carbon nanotubes (Shen et al., 2007; Coleman et al., 2006), nanoclay (Tjong, 2006; Ray and Okamoto, 2003; Pavlidou and Papaspyrides, 2008), and nanofibers (Cheng et al., 2009; Prolongo et al., 2009). Nanoma- terial-reinforced polymer composites have its roots in the pioneering work of researchers at Toyota (Kojima et al., 1993; Usuki et al., 1993). They first reported on the improvement inthe properties of nylon nanocomposites by in- corporating nanoclay into the polymer matrix.
Subsequently, an enormous amount of research has been done on nanocomposite materials based on a variety of polymers (Ray and Okamoto, 2003). Although the majority of re- search and development has focused on thermo- plastics, a large volume of work has been done on nano-reinforced thermosetting polymers. In Particular, nanocomposites based on layered nanoclay and epoxy resins have been widely studied (Tjong, 2006; Ingram et al., 2007;
McIntyre et al., 2005; Park and Jana, 2003). In these systems, the elastic forces exerted by the cross-linking epoxy molecules inside the clay galleries lead to clay exfoliation, and accelerate gel formation in the extra-gallery regions.
Among thermosetting polymers, phenol-form- aldehyde (PF) resins are one of the most versa- tile resins, providing outstanding performance in adhesion, high temperature resistance, flame re- sistance and electric insulation. Thus, PF resins have been used to improve mechanical proper- ties, moisture resistance, or fire resistance in many applications. For example, PF resin is im- pregnated into cellulose paper to fabricate deco- rative or protective laminates on the surface of wood-based composite products. These laminate
papers are hot-pressed onto the surface of com- posite wood products to provide a hard surface finish.
In general, PF resin has a three dimensional structure, which makes it tough for the layered silicate gallery to intercalate even if the lamella of the layered silicate can be easily intercalated by linear polymers. Therefore, a limited number of attempts have been made to understand lay- ered silicates in PF resins. Early studies on or- ganoclay reinforced linear novolac PF resin nanocomposite demonstrated that the structural affinities between the clay modifier and the pol- ymer enhance intercalation (Choi et al., 2000;
2003). The same research group also reported an ideal silicate concentration of 3% which greatly improved tensile strength, tensile mod- ulus, toughness, and elongation-at-break (Byun et al., 2001).
The first study on producing nanocomposi- tes from resole PF resins demonstrated that ex- foliation was more difficult with resole PF res- ins than novolac PF resins, since the former possessed more three-dimensional structure even prior to curing (Wang et al., 2004). However, the authors reported that 3∼5% clay in resole PF resins was completely exfoliated, thereby significantly improving impact strength of the resultant nanocomposite. Employing a suspen- sion condensation polymerization method, Wu et al. (2002) showed that both novolac and re- sole PF resins was suitable for preparation of PF resin/clay nanocomposite. However, they al- so reported that the clay exfoliation or inter- calation in novolac was easier than in resole.
Kaynak and Tasan (2006) also showed that the cure method, clay amount, and clay mod- ification had significant impact on the mechan- ical properties of the PF resin/clay nanocom- posites. The same group found that unmodified pristine Na-montmorillonite clay provided better strength improvement, ∼16% in Charpy impact
strength, and 66% in fracture toughness values (Tasan and Kaynak, 2009). These results sug- gested that nanoclay could be used to improve the properties of cellulose/PF resin-based sur- face laminates.
It is well known that; the curing behavior of PF resin-based nanocomposite is very important as it impacts the majority of properties in the resulting nanocomposite. However, the curing behavior of resole PF resin/clay/cellulose nano- composites has not been fully investigated as a potential candidate for surface laminates. Conse- quently, the object of this study was to prepare nanocomposites based on resole PF resin, nano- clay, and cellulose paper, and to characterize the curing behavior and tensile properties of the resulting nanocomposite in order to assess the feasibility as surface laminates for wood-based composite products.
2. MATERIALS and METHODS
2.1. Materials
A commercial resole PF resin tailored for the impregnation of paper laminates was donated by a local resin company (Tae Yang Chemical Ltd.
Co., Incheon, Korea). The resole PF resin had the formaldehyde/phenol mole ratioof 2.2 and non-volatile solids content of 48.2%, and was used as received. The cellulose paper used for the impregnation of PF resin/clay mixtures was donated by a local low pressure laminate (LPL) manufacturer (Samsun Gratech Inc., Incheon, Korea). It was a grade of LPL with a basis weight of 80 g/m2.
Cloisite®-Na+ clay, a hydrophilic, pristine montmorillonite was purchased from Southern Clay Products Inc., Texas, USA. The clay had a density of 2.86 g/cm3 and more than 90% of its particles were greater than 13 µm in size. It was used without further treatment.
2.2. Preparation of Nanocomposite
Clay particles and PF resin were stirred by hand in order to produce mixtures with 0, 1, 3, 5 and 10 wt% clay. The clay particles were subsequently dispersed in the resin by ultra- sonication at 700 W for 30 min. The ultra- sonicator had a 135 mm long horn. These mix- tures were impregnated into cellulose paper by soaking the paper into the clay/resin mixture, subsequently removing excess resin with a roller. The resulting impregnated paper had a target resin loading of 60%, which gave a paper weight of about 200 g/m2. The resin impreg- nated papers were dried at room temperature for three hours and then pre-curedat 60°C in a dry- ing oven overnight. These nanocomposite sam- ples were stored in a desiccator for future analysis.
2.3. DSC Measurements of the Nano- composite
About 5 mg of the nanocomposite sample was weighed into a hermetic aluminum pan and then scanned using a TMDSC (Q1000, TA Instruments, New Castle, DE, USA). For dy- namic scanning, 5, 10, 15 and 20°C/min heating rates were used for each clay level. The con- ventional DSC scans were conducted in dupli- cate over the temperature range from 30 to 300°C.
The samples were also run from -50 to 300°C with a TMDSC option and a heating rate of 5°C/min., amplitude of ± 0.66°C, a period of 50 s, and a mass of approximately 2 mg in the same type of aluminum pan. These parameters were chosen to maintain ‘heat only’ condition during a TMDSC scan.
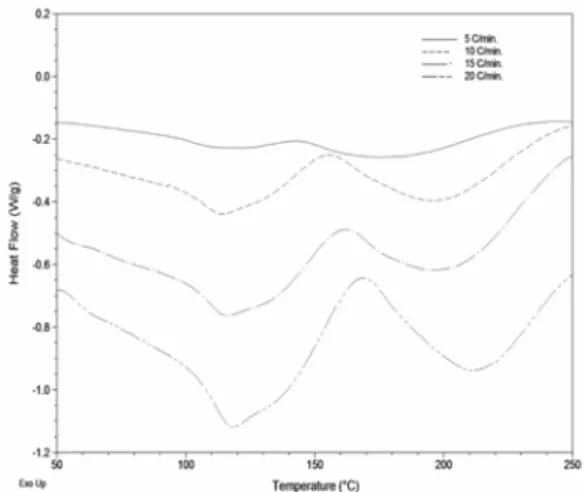
Fig. 1. Typical DSC thermograms for the control nanocomposites (0% clay) at different heat- ing rates.
Fig. 2. Effect of clay addition on the peak temper- ature (Tp) for resole PF resin/clay/cellulose nanocomposites at different heating rates.
2.4. Measurements of tensile proper- ties of the nanocomposite
The tensile tests were performed using a test- ing machine (model 3343, Instron, USA with a load cell of 1 kN). The cross head speed was 5 mm/min. The specimens were cut with width of 15 mm and a length of 50 mm. The thick-
ness of samples was calculated before test. The gauge between top and bottom clamp was 25 mm.
3. RESULTS and DISCUSSION
3.1. Cure Kinetics by the Ozawa and Kissinger Methods Using Con- ventional DSC
Fig. 1 shows the typical DSC thermograms for the control (no clay) composites at different heating rates (5∼20°C/min). In all cases, there is an initial decrease in heat flow as temperature is increased. This is likely due to the softening of the impregnated resole PF resins prior to curing. After reaching a minimum, the heat flow increases to a maximum peak temperature (Tp) due to the exothermic curing of the resole PF resins.
Fig. 2 shows the variation in Tp for the vari- ous nanocomposites with different clay contents and DSC heating rates. As the clay content in- creased, the Tp decreases up to 3∼5% clay, and then increases upon further addition to 10%
clay regardless of the heating rate. This result suggeststhat the addition of 3∼5% clay to the resole PF resin accelerates curing of the nano- composite. The accelerated cure rate could be caused by the Lewis acidity of the clay used in this study (Yong et al., 1997). Clay cations like Al3+, Fe3+, or Na+ act as Lewis acids, which can accept electrons from various aromatic com- pounds (Lopez et al., 2008; 2009). The oxidiz- ing power of the clay is proportional to its Lewis acidity. However, the addition of more than 10% clayretarded the cure rate, possibly due to agglomeration and, consequently, poor dispersion throughout the nanocomposite. As expected, the Tp of the nanocomposite increased as the heating rate increased. This result sug- geststhat the curing of the resole PF resin is a
Fig. 3. Activation energy (E) of resole PF res- in/clay/cellulose nanocomposites as a func- tion of the clay content using the Kissinger and Ozawa methods.
function of temperature, which makes it possi- ble to calculate the activation energy by apply- ing different methods such as the Ozawa, Kissinger and isoconversional methods.
DSC is typically used to monitor either heat evolution or absorption for any reactions that may have taken place during the heating pro- cess. The basic assumption underlying the appli- cation of conventional DSC to cure kinetics is that the measured heat flow (dH/dt) is propor- tional to the reaction rate (dα/dt). In practice, it has proven to be a good assumption. All ki- netic analysis of non-isothermal data is based on the following equation (Park et al., 1999):
) ( )
exp( α
β α
α f
RT Z E
dT d dt
d = = − (1)
Typically, multi-heating rate methods such as the Ozawa, Kissinger, and isoconversional methods are utilized. The Ozawa method is based on a simple relationship between the acti- vation energy (E) and the heating rate (β) (Ozawa, 1965). If the sample temperature is in- creased by a controlled and constant β, the variation in the degree of conversion can be an-
alyzed as a function of temperature, this tem- perature being dependent on the time of heating. Therefore, this method relates heating rate to E, as is shown by the Eq. (2), and per- mits the calculation of E from a plot of logβ versus 1/Tp.
( )α
β F
R ZE RT
E
p
log log
456 . 0 315 . 2
log ⎟−
⎠
⎜ ⎞
⎝ + ⎛
⎟⎟
⎠
⎞
⎜⎜
⎝
− ⎛
−
=
(2)
The Kissinger (1957) suggests a similar rela- tionship:
⎟⎠
⎜ ⎞
⎝
− ⎛
⎟=
⎟
⎠
⎞
⎜⎜
⎝
− ⎛
E ZR RT
E
Tp p
ln ln β2
(3)
where again, E is can be calculated from the slope of the straight line generated from a plot of -ln(β/Tp2 ) and 1/Tp, and the pre-exponential factor (Z) from the y-intercept. Thus, the Kiss- inger method provides a single value of activa- tion energy for the whole reaction process.
Fig. 3 illustrates the changes in of the E de- termined by the Ozawa and Kissinger methods using Eq. (2) and (3), respectively. The E val- ues obtained by the Ozawa method were greater than those of the Kissinger method. However, the E values obtained by both methods behave almost identically with increasing clay content.
The higher E values obtained using the Ozawa method is consistent with the results previously reported for resole PF resins (Alonso et al., 2004). As the clay was increased, the E values determined using both methods increased to a maximum at 1% clay content and then de- creased to a minimum at 3% clay content fol- lowed by a slow increase to 10% clay content.
The increase in E value at 1% clay could be due to exfoliation of the clay. It has been re- ported that the presence of exfoliated clays act
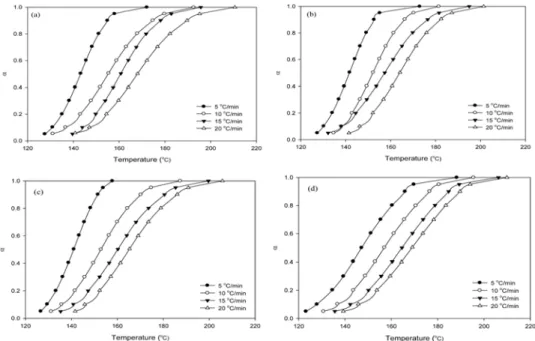
Fig. 4. Apparent degree of conversion versus temperature profiles for the resole PF resin/clay/cellulose nano- composites at different clay levels and heating rates. (a) 0% clay, (b) 1% clay (c) 3% clay, and (d) 10%
clay.
as a barrier to networkformation during the cur- ing of epoxy resins (McIntyre et al., 2005).
Thus, a similar effectmay likely be happening here, wherein the exfoliated clay increase the activation energy for the cross-linking process.
Another possibility is that at 1% clay loading, there is increased inhomogeneity in the nano- composite, which acts as a barrier to the curing of the resole PF resin. More work is required to clearly explain what factors contribute to this phenomenon.
3.2. Cure Kinetics by the isocon- versional method using con- ventional DSC
A third kinetic method is the isoconversional kinetic analysis or so-called “model-free ki- netics” method, and has been used to character- ize cure kinetics of both neat and modified PF
resins (Kissinger, 1957; He et al., 2003; He and Riedl, 2004; Vyazovkin and Sbirrazzuoli, 2006;
Wang et al., 2005; Alonso et al., 2004; Tejado et al., 2008; Lopez et al., 2008; 2009). This method requires a series of experiments per- formed at different temperature programs and yields the effective activation energy (Eα) as a function of conversion (α). In this case:
α α α α α
β
E R Z RT
E
T i i
i ln
ln
2 , ,
−
⎟⎟⎠=
⎜⎜⎝ ⎞
− ⎛
(4)
where β is the heating rate, T is temperature (i denoting thedifferent heating rates), R is the gas constant, and Z is the pre-exponential factor. Eα can be calculated from the slope of the plot of -ln(βi/T2α) vs. 1/Tα, and the pre-exponential factor from the intercept.
Fig. 4 illustrates the relationships between the
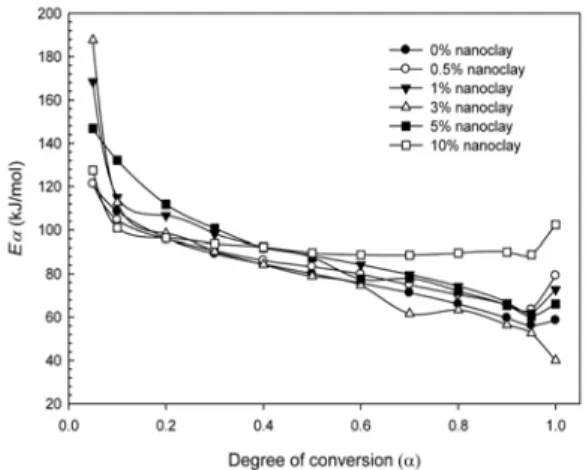
Fig. 5. Relationship between Eα and degree of con- version for the resole PF resin/clay/cellulose nanocomposite at different clay contents.
degree of conversion and temperature profiles for various resole PF/clay nanocomposites.
Comparing the various profiles the clear impact of clay content on curing rate is evident; the curing reaction was accelerated as the clay con- tent increased from 0 to 3% and then retarded with further increases to 10% clay content. As anticipated, the cure temperature decreases with increasing clay loading up to 3% clay, and then increased with further clay addition. At the same degree of conversion (α=0.4) and heating rate (5ºC/min), the cure temperatures for the re- sole PF resins were 141, 139, 139 and 164 for 0, 1, 3 and 10% clay levels, respectively.
Using the isoconversional method the Eα as a function of α was calculated and is presented in Fig. 5. All of the resole PF resin/clay nano- composites showed similar behavior in calcu- lated Eα values as a function of degree of con- version (α). For all clay contents there was an initial sharp decrease in Eα at α up to 0.1, fol- lowed by a slow gradual decrease with increas- ing degree of conversion α. At α > 0.9 all of the nanocomposites showed an increase in Eα except for the 3% clay nanocomposites with sharply decreased. The Eα values ranged from 40 to 187 kJ/mol, with those obtained for α between 0.1 and 0.9 falling within the reported range between 60∼120 kJ/mole for the cure of resole PF resins (Yong et al., 1997; Park et al., 2002; Wang et al., 2005). The reduction in Eα values with increasing α between 0.1 and 0.9 could be ascribed to a cure acceleration of re- sole PF resins by the clay. In fact, a similar trend in Eα value has been reported for resole PF resins (He et al., 2003; He et al., 2005). An interesting point is that the Eα of the nano- compositewith 10% clay does not seem to de- crease with increasing α as per the other clay loadings, which may suggest a different curing behavior. This may be due to agglomeration of clay particles in the resole PF resins, which hin-
der resin network formation as a result of the increased Eα. As well this may be a result of transition from a chemical-controlled curing re- action regime to one controlled by diffusion (Tejado et al., 2008).
3.3. Cure Kinetics by Temperature Modulation using TMDSC
To further study the cure kinetics of the re- sole PF resin/clay nanocomposites temperature modulated DSC (TMDSC) was utilized. Unlike conventional DSC, TMDSC permits simulta- neous measurement of heat flow and heat ca- pacity by applying the sinusoidal oscillation on a DSC temperature ramp and separately analyz- ing the sinusoidal and non-sinusoidal response (Reading et al., 1992; 1994). In particular, this technique has received considerable attention for monitoring the cure kinetics of thermoset- ting systems (Van Assche et al., 1995; 1996;
1997). In TMDSC, the heat flow equation has the following form:
Fig. 6. Typical TMDSC thermograms for the resole PF resin/clay/cellulose nanocomposites at (a) 0% clay, and (b) 3% clay contents. Included are the total heat flow (solid line), reversing heat flow (medium dash line), non-reversing heat flow (long dash line) and reversing heat capacity (short dash line) curves.
) ( Tt, dt f C dT dt
dH = p + (5)
where dH/dT is the total heat flow (J/s or W), Cp is the heat capacity (J/K) and dT/dt is the heating rate. The reversing heat flow component
‘Cp(dT/dt)’ is dependent on the rate of change of temperature and the heat capacity. The re- versing heat flow includes the glass transition, and the melting of slow-melting polymers, or highly impure materials. By contrast, the ‘non- reversing’ heat flow component, f(t,T), contains the heat flow contribution from kinetically con- trolled events that are dependent on both tem- perature and time. So, the non-reversing heat
flow contains all kinds of kinetic transitions such as crystallization, curing reactions, evapo- ration, degradation, and the melting of fast- melting polymers and pure crystalline materials.
The Cp component is calculated from the re- sponse to the oscillation via
mhr p mhf
A KA
C = (6)
where Amhf is the amplitude of the modulated heat flow, Amhr is the amplitude of the heating rate signal and K is the heat capacity calibration constant. The non-reversing signal is calculated as the difference between the total heat flow re- sponse and the reversing signal which is ob- tained from the Eq. (5).
Fig. 6 shows the typical dynamic TMDSC thermograms for the control nanocomposite without clay, and the nanocomposite with 3%
clay; included are the total, reversing, non-re- versing heat flows, and the reversing heat ca- pacity curves. The total and non-reversing heat flow curves were very close to each other and displayed an exothermic reaction due to the cur- ing of resole PF resin (Fig. 6(a) and 6(b)). This phenomenon was pretty much the same for the nanocomposite of with clay contents greater than 3%. This suggeststhat the curing reaction of resole PF resin becomes a predominant event in the thermal behavior of the nanocomposite.
However, the reversing heat flow curve of the control nanocomposite shows a rapid decrease around 57.8ºC (empty arrow in Fig. 6(a)) and then an increase around 136.7ºC (filled arrow in Fig. 6(a)). As temperature increases, the resole PF resin softens to a molten state at first, and then starts to cure by cross-linking, leading to a network formation. After reaching the maximum cure rate at a peak temperature, vitrification begins. Vitrification is a transition from a liq- uid-rubberystate with high molecular mobility to
Fig. 7. Effects of clay content on the Tp of the resole PF resin/clay/cellulose nanocomposite as de- termined by TMDSC.
Fig. 8. Effect of clay content on the curing reaction heat (ΔH) of the resole PF resin/clay/cellu- lose nanocomposite as determined by TM- DSC.
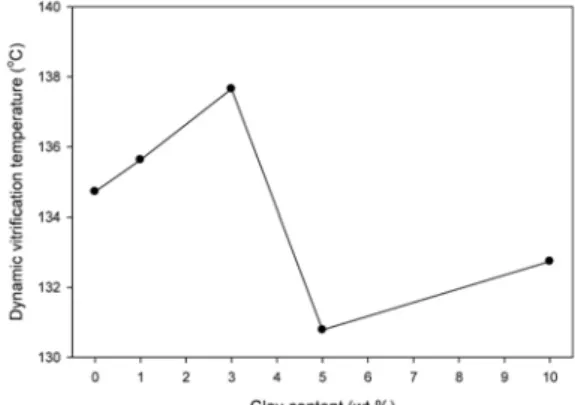
Fig. 9. Effect of clay content on the dynamic vitri- fication temperature (Tdv.) of the resole PF resin/clay/cellulose nanocomposite determined from the reversing heat flow of the TMDSC thermograms.
a glassy state with much lower molecular mobility. The reversing heat capacity of the nanocomposite was closely related to the exo- thermic cure reaction of the resole PF resin gradually decreasing from a maximum to lower values as the resole PF resin changed from a gel state to a glassy state. The dynamic vitri- fication temperature (Tdv) was defined as the midpoint of the reversible heat flow curve right after the endothermic peak (filled arrow in Fig.
6(a) and 6(b)).
As for the conventional DSC, the TMDSC thermograms also provided Tp values for the re- sole PF resin cure in the nanocomposite. Fig. 7 illustrates the effect of clay content on the Tp
values. The Tp values from both total heat flow and non-reversing heat flows of the clay nano- composites decreased with increasing clay con- tent up to 5%, and then rapidly increased at 10% clay content. This is again consistent with a cure acceleration of resole PF resin by adding clay as shown in Fig. 2. In fact, the Tp range of the total heat flow from the TMDSC was quite similar to that from conventional DSC at a heating rate of 5ºC/min. However, the Tp val- ues obtained from the non-reversing heat flow were lower than those from the total heat flow curve. This is because the non-reversing heat flow is equal to the difference between the total heat flow and the reversing heat flow for the nanocomposites. That is, the Tp of the non-re- versing heat flow from TMDSC represents only the cure of resole PF resin in the nano- composite.
However, the curing reaction heat (ΔH) val-
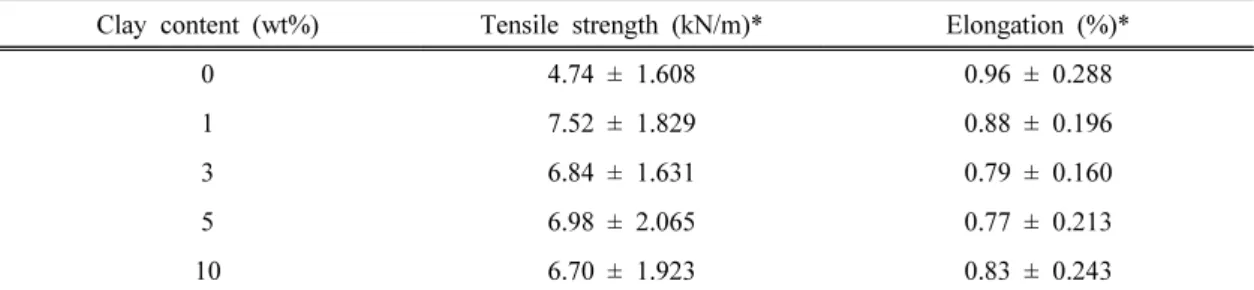
Table 1. Tensile strength and elongation of the resole PF resin/clay/cellulose nanocomposites as a function of the clay content
Clay content (wt%) Tensile strength (kN/m)* Elongation (%)*
0 4.74 ± 1.608 0.96 ± 0.288
1 7.52 ± 1.829 0.88 ± 0.196
3 6.84 ± 1.631 0.79 ± 0.160
5 6.98 ± 2.065 0.77 ± 0.213
10 6.70 ± 1.923 0.83 ± 0.243
*The values are presented an average and standard deviation.
ues from the total and non-reversing heat flow curves were greater than those obtained from the total heat flow of the nanocomposite. Fig. 8 shows that the ΔH values for the total and non-reversing heat flows decreased with in- creasing clay content up to ∼3% and then in- creased as clay content increased. Again, this could be due to the cure acceleration effect of the added clay the addition of clay accelerates the cure of resole PF resin by lowering the Tp, which results in a decrease in the area under the exothermic curve (ΔH).
Fig. 9 shows the relationship between Tdv and clay content for the resole PF resin/clay nanocomposites. As the clay content increased, the Tdv increased reaching a maximum at 3%
clay content. Increasing the clay content beyond 3% led to a sharp decrease in Tdv. This indicates that the vitrification of the resole PF resin is de- layed up to a clay content of 3%. Thus, the ad- dition of clay restricted the vitrification process even though it accelerated the initial cure re- action in the nanocomposites. The lower Tdv values at clay contents of 5 and 10% could also be due to an aggregation of the clay particles, resulting in an increased viscosity of resole PF resin as per finding for epoxy resin curing (Fraga et al., 2008).
3.4. Tensile Properties of the Nano- composites
The effect of clay addition on the mechanical properties of the resole PF resin/clay nano- composites is presented in Table 1. When com- pared to the control nanocomposite (i.e., the ones lacking clay), tensile strength of the nano- composite was improved by the addition of 1%
clay tensile strength decreased at higher clay contents. These results show are inforcement ef- fect of the added clay in the nanocomposite through either exfoliation or intercalation. As shown in Table 1, the elongation at break was reduced up to 3% clay and then leveled off afterwards. Since the added clay reinforced re- sole PF resin matrix in the nanocomposite, the resultant nanocomposite consequently became stiffer, which reduced the elongation at break.
4. CONCLUSIONS
This study investigated the thermal curing be- havior and tensile properties of resole phe- nol-formaldehyde (PF) resin/clay/cellulose nano- compositeas a potential surface laminate materi- al for wood-based composite panels. In order to study influences of clay addition on the thermal curing behavior of the nanocomposite, two dif- ferent calorimetric techniques (DSC and TMDSC)
were employed. As the clay content increased, Tp values of the nanocompositecuring reaction decreased up to 3∼5% clay content, showing the cure acceleration effect of the clay. The Ozawa, Kissinger, and isoconversional DSC methods were employed to determine activation energies for the curing reaction of the na- nocomposite. Both the Ozawa and Kissinger method showed the lowest E at 3% clay con- tent. The isoconversional method provided the Eα as a function of the degree of conversion, wherein the Eα showed a gradual decrease with increasing degree of conversion, the lowest val- ue at 3% clay loading. TMDSC further con- firmed the cure acceleration effect of clay addi- tion to the resole PF resin system, as indicated both Tp and heat of reaction (ΔH) measu- rements. Interes- tingly, the reversing heat flow and heat capacity values showed that the addi- tion of clay up to 3% delayed the vitrification process of PF resin in the nanocomposite, in- dicating an inhibition effect of the clay in the final stage of the curing reaction. Tensile st- rengths of the nanocomposite were slightly im- proved by the addition of small amounts of lay- ered clay, showing a reinforcing effect, while the elongation at break slightly decreased as the clay content increased. These results demon- strate that an optimum level of clay addition to resole PF resin/cellulose nanocomposites is a balance between the impact on cure kinetics and tensile strength.
REFERENCES
1. Alonso, M. V., M. Oliet, J. M. Perez, F.
Rodriguez, and J. Echeverria. 2004. Determina- tion of curing kinetic parameters of lignin-phe- nol-formaldehyde resol resins by several dynamic differential scanning calorimetry methods. Ther- mochim. Acta 419: 161∼167.
2. Byun, H. Y., M. H. Choi, and I. J. Chung. 2001.
Synthesis and Characterization of resol type phenolic resin/layered silicate nanocomposite.
Chem. Mater. 13: 4221∼4226.
3. Cheng, Q., S. Wang, and T. G. Rials. 2009.
Poly(vinyl alcohol) nanocomposite reinforced with cellulose fibrils isolated by high intensity ultrasonication. Composites: Part A. 40: 218∼ 224.
4. Choi, M. H., I. J. Chung, and J. D. Lee. 2000.
Morphology and curing behaviors of phenolic resin-layered silicate nanocomposite prepared by melt intercalation. Chem. Mater. 12: 2977∼ 2983.
5. Choi, M. H. and I. J. Chung. 2003. Mechanical and thermal properties of phenolic resin-layered silicate nanocomposite synthesized by melt inter- calation. J. Appl. Polym. Sci. 90: 2316∼2321.
6. Coleman, J. N., U. Khan, W. J. Blau, and Y. K.
Gun’ko. 2006. Small but strong: A review of the mechanical properties of carbon nanotube- poly- mer composites, Carbon 44: 1624∼1652.
7. Fraga, I., S. Montserrat, and J. M. Hutchison.
2008. Vitrification during the isothermal cure of thermosets. Part I. An investigation using TOPEM, a new temperature modulated technique. J. Therm.
Anal. Cal. 91: 687∼695.
8. Gill, P. S., S. R. Sauerbrunn, and M. Reading.
1993. Modulated differential scanning calorimetry.
J. Thermal. Anal. 40: 931∼939.
9. He, G. B., B. Riedl, and A. Ait-Kadi. 2003.
Model-free kinetics: Curing behavior of phenol formaldehyde resins by differential scanning calorimetry. J. Appl. Polym. Sci. 87: 433∼440.
10. He, G. B. and B. Riedl. 2004. Curing kinetics of phenol formaldehyde resin and wood-resin inter- actions in the presence of wood substrates. Wood Sci. Tech. 38: 69∼81.
11. Ingram, S., I. Rhoney, J. J. Liggat, N. E. Hud- son, and R. A. Pethrick. 2007. Some factors in- fluencing exfoliation and physical property en- hancement in clay epoxy resins based on dig- lycidyl ethers of bisphenol A and F. J. Appl.
Polym. Sci. 106: 5∼19.
12. McIntyre, S., I. Kaltzakorta, J. J. Liggat, R. A.
Pethrick, and I. Rhoney. 2005. Influence of the epoxy structure on the physical properties of epoxy resin nanocomposite, Ind. Eng. Chem.
Res. 44: 8573∼8579.
13. Kaynak, C. and C. C. Tasan. 2006. Effects of production parameters on the structure of resol type phenolic resin/layered silicate nano- com- posite. Euro. Polym. J. 42: 1908∼1921.
14. Kissinger, H. E. 1957. Reaction kinetics in differential thermal analysis. Anal. Chem. 29:
1702∼1706.
15. Kojima, Y., A. Usuki, M. Kawasumi, A. Okada, T. Kurauchi, and O. Kamigaito. 1993. Synthesis of nylon 6-clay hybrid by montmorillonite inter- calated with e-caprolactam. J. Polym. Sci. Part A: Polym. Chem. 31: 983∼986.
16. López, M., M. Blanco, A. Vazquez, N.
Gabilondo, A. Arbelaiz, J. M. Echeverría, and I.
Mondragon. 2008. Curing characteristics of re- sol-layered silicate nanocomposites. Thermchim.
Acta. 467: 73∼79.
17. López, M., M. Blanco, A. Vazquez, J. A. Ramos, A. Arbelaiz, N. Gabilondo, J. M. Echeverría, and I. Mondragon. 2009. Isoconversional kinetic analysis of resol-clay nanocomposite. J. Therm.
Anal. Cal. 96: 567∼573.
18. Ozawa, O. A. 1965. A new method of analyzing thermogravimetric data. Bull. Chem. Soc. of Japan 38: 1881~1886.
19. Park, B. D., B. Riedl, H. J. Bae, and Y. S. Kim.
1999. Differential scanning calorimetry of phenol-formaldehyde adhesives. J. Wood Chem.
Tech. 19: 265∼286.
20. Park, B. D., B. Riedl, Y. S. Kim, and W. T. So.
2002. Effect of synthesis parameters on thermal behavior of phenol-formaldehyde resole resin. J.
Appl. Polym. Sci. 83: 1415∼1424.
21. Park, J. H. and S. C. Jana. 2003. Mechanism of exfoliation of nanoclay particles in epoxy-clay nanocomposite. Macromol. 36: 2758∼2768.
22. Pavlidou, S. and C. D. Papaspyrides. 2008. A review on polymerlayered silicate nanocomposite.
Prog. Polym. Sci. 33: 1119∼1198.
23. Prolongo, S. G., M. Campo, M. R. Gude, R.
Chaos-Moran, and A. Urena. 2009. Thermo- physical characterization of epoxy resin rein- forced by amino-functionalized carbon naono- fibers. Composite Sci. Tech. 69: 349∼357.
24. Ray, S. S. and M. Okamoto. 2003. Polymer/
layered silicate nanocomposite: a review from preparation to processing. Prog. Polym. Sci. 28:
1539∼1641.
25. Reading, M., D. Elliott, and V. L. Hill. 1992.
Some aspects of the theory and practice of modulated differential scanning calorimetry. In:
Proceedings of the 21st NATAS Conference, pp.
145∼150.
26. Reading, M. 1993. Modulated differential scan- ning calorimetry- a new way forward in materi- als characterisation. Trends Polym. Sci. 8: 248∼ 253.
27. Reading, M., D. Elliot, and V. L. Hill. 1993. A new approach to the calorimetric investigation of physical and chemical transitions. J. Thermal.
Anal. 40: 949∼955.
28. Reading, M., A. Luget, and R. Wilson. 1994.
Modulated differential scanning calorimetry. Th- ermochim. Acta, 238: 295∼307.
29. Shen, J., W. Huang, L. Wu, Y. Hu, and M. Ye.
2007. Thermo-physical properties of epoxy na- nocomposite reinforced with aminofunctiona li- zed multi-walled carbon nanotubes. Composites:
Part A. 38: 1331∼1336.
30. Tasan, C. C. and C. C. Kaynak. 2009. Me- chanical performance of resol type phenolic re- sin/layered silicate nanocomposite. Polym. Com- pos. 30: 343∼350.
31. Tejado A., G. Kortaberria, J. M. Echeverria, and I. Mondragon. 2008. Isoconversional kinetic ana- lysis of novolac-type lignophenolic resin cure.
Thermchim. Acta 471: 80∼85.
32. Tjong, S. C. 2006. Synthesis and Structure Pro-
perty Characteristics of Clay Polymer Nanoco- mposite. In: Tjong, S.C. (ed), Nano-crystalline Materials, Elsevier Ltd., Chapter 10, pp:
311-348.
33. Usuki, A., Y. Kojima, M. Kawasumi, A. Okada, Y. Fukushima, T. Kurauchi, and O. Kamigaito.
1993. Synthesis of nylon 6-clay hybrid. J. Mater.
Res. 8: 1179∼1184.
34. Van Assche, G., A. Van Hemelrijck, H. Rahier, and B. Van Mele. 1995. Modulated differential scanning calorimetry: isothermal cure and vitrifi- cation of thermosetting systems. Thermo- chim.
Acta, 268: 121∼142.
35. Van Assche, G., A. Van Hemelrijck, H. Rahier, and B. Van Mele. 1996. Modulated differential scanning calorimetry: Non-isothermal cure, vitri- fication, and devitrification of thermosetting sys- tems. Thermochim. Acta, 286: 209∼224.
36. Van Assche, G., A. Van Hemelrijck, H. Rahier, and B. Van Mele. 1997. Modulated temperature differential scanning calorimetry; Consideration for aquantitative study of thermosetting systems.
J. Therm. Anal. 49: 443∼447.
37. Vyazovkin, S. and N. Sbirrazzuoli. 2006. Iso- conversional kinetic analysis of thermally stimu-
lated processes in polymers. Macromol. Rapid Comm. 27: 1515∼1532.
38. Wang, J., M.-P.G. Laborie, and M. P. Wolcott.
2005. Comparison of model-free kinetic methods for modeling the cure kinetics of commercial phenol-formaldehyde resins. Thermochim. Acta 439: 68∼73.
39. Wang, H., T. Zhao, Y. Y and Y. Yu. 2004.
Synthesis of resol-layered Silicate nanocomposite by reaction exfoliation with acid-modified mon- tmorillonite, J. Appl. Polym. Sci. 92: 791∼797.
40. Wu, Z., C. Zhou, and R. Qi. 2002. The pre- paration of phenolic resin/montmorillonite na- nocomposite by suspension condensation poly- merization and their morphology. Polym. Com- pos. 23: 634∼646.
41. Wunderlich, B., Y. Jin, and A. Boiler. 1994.
Mathematical description of differential scanning calorimetry based on periodic temperature modu- lation, Thermochim. Acta 238: 277∼293.
42. Yong, R. N., S. Desjardins, J. P. Farant, and P.
Simon. 1997. Influence of pH and exchangeable cation on oxidation of methylphenols by a montmorillonite clay. Appl. Clay Sci. 12: 93∼ 110.