1. Introduction
The demand for electrical power in Korea keeps increasing and the construction of new power supply facilities is inevitable. However, power companies suffer from conflicts with residents who have a strong aversion to this expansion, caused by perceived health problems and property rights. With NGO arbitration the relationship between the two stake holders, namely the power company and the resident has become less adversarial. The harmlessness of the ELF electric field long been known.
Household appliances, transmission lines, and substations are the sources of the ELF magnetic field, which has been thought to have a connection to an etiological cause of Childhood Leukemia. However, after much research no valid conclusion for this has been reached.
Three main categories of research methods have been
applied to the risk analysis of ELF EMF, namely epidemiological surveys, mechanism studies, and laboratory experiments. Only in the epidemiological studies do we see a mixture of positive and negative results connecting ELF EMF to Childhood Leukemia; the other methods shows no evidence of this.
Recently, even though the origin of this discrepancy is still unrevealed, the WHO set a higher basic restriction value, although no other dramatic results for which to change its frame of policy were ever found1,2).
An exposure assessment using the human body is required prior to a valid risk analysis of ELF EMF. In this paper the different methodologies regarding the exposure assessment of humans under ELF EMF is presented.
Real-world experiments and the related numerical methods are used and comparisons are made to assess methodological suitability.
극저주파 자계의 노출 평가에 대한 연구
김응식⋅김명훈†⋅민석원*
호서대학교 안전보건학과․*순천향대학교 전기공학과
(2015. 7. 15. 접수 / 2016. 10. 20. 수정 / 2017. 1. 11. 채택)
A Study on the Exposure Assessment of Extremely Low Frequency Magnetic Fields
Eung-Sik Kim⋅Myeong -Hun Kim†⋅Suk -Won Min* Department of Safety and Health Engineering, Hoseo University
*Department of Electrical Engineering, Soonchunhyang University (Received July 15, 2015 / Revised October 20, 2016 / Accepted January 11, 2017)
Abstract : This paper addresses the assessment methods used to evaluate the magnetic exposure of a human to ELF EMF (Extremely Low Frequency Electromagnetic Field) which is caused by the process of power delivery from 60 Hz commercial power. These days the main concern is primarily focused on the magnetic field. For the exposure assessment, both numerical studies and laboratory experiments were studied and the results of the two compared for methodological suitability. The numerical analyses employ the Impedance Method (IM), Boundary Element Method (BEM), and Finite Element Method (FEM) and the laboratory experiments used various human phantom models made with conductivities congruent to human organs and then exposed to uniform/non-uniform magnetic fields to produce eddy currents.
Under these conditions a number of examples have been evaluated and the reliability assessed to present the pros and cons of each methodology.
Key Words : magnetic field, exposure assessment, ELF EMF
†Corresponding Author : Myeoung Hun Kim, Tel : +82-41-540-9935, E-mail : [email protected]
Department of Safety Engineering, Hoseo University, 20, Hoseo-ro 79beon-gil, Baebang-eup, Asan-si, Chungcheongnam-do 31499, Korea
2. The Experiment Methodology
There is no direct way to directly measure the current density in a human body. Therefore we indirectly measure the magnetically induced voltage in a human phantom which is made to have the same conductivities as human organs. The voltage measured from the probe is then translated into current density.
2.1 The Apparatus for Magnetic Field Generation Fig. 1 shows the apparatus used to generate a uniform magnetic field that ranges between 0.0 and 0.5 mT. This apparatus consists of four parallel coils and a cubic space is formed inside the apparatus for placement of the phantom model. The uniformity is measured at three different layers with four check points per layer. The uniformity error is below 3%.
For the non-uniform field generation a high current single-phase two wire system was used to make currents up to 1500 A. The magnitude of the field is controlled by both the source current and the distance between the two lines. Fig. 2 shows an example of the field distribution for
Fig. 1. The apparatus used to generate the uniform 0.5 mT magnetic field (unit : mm).
Fig. 2. The non-uniform magnetic field.
700 A with 16 cm clearance. The phantom is centrally located between the two lines.
2.2 The Measurement System
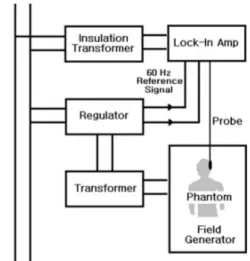
The physical and electrical configuration of the measurement system is shown in Fig. 3. The system consists of a lock-in amp, insulation transformer, voltage regulator, and uniform field apparatus. The 60 Hz signal produced by the regulator is transmitted into the lock-in amp (Stanford Research System, DSP Lock-In-Amplifier Model SR 830) as a reference and is used to cancel the extraneous 60 Hz noise found on the signal from the probe.
The current to the field generation apparatus is controlled by the voltage transformer. In the case of the non-uniform field generation, the voltage transformer is replaced by the high current generator. To obtain the induced voltage the human phantom with the probe is located inside the cubic space where the field distribution is already known.
Fig. 3. The measurement system.
2.3 The Probe Implementation
The principle of measurement of the induced voltage is displayed in Fig. 4(a). Media with conductivity σ are placed under magnetic field B. The eddy current flows by loop voltage motivation. After the measurement of the voltage (Vm) with distance (d) between the two probe electrodes, the current density (J) can be calculated using (1) and (2)3).
Vm = Ed (1)
J = σE = σVm /d (2)
where
V : Potential difference [V]
E : Induced electric field [V/m]
σ : Conductivity [S/m]
J : Induced current density [A/m2] d : Distance between probe electrodes [m]
a) Uniform field b) Non-uniform field Fig. 4. The iInduced voltage measurement.
A cylinder in which the analytical solution of current density under a uniform magnetic field is known was made for the calibration of the probe. As the measurements proceeded, comparisons between the theoretical and measured value are made. Every time the probe lost its operational reliability, a new probe was made in order to maintain perfect calibration. There are several points to note in this process. Since the order of the measured voltage is as low as several μV up to scores of μV, the value is very susceptible to environmental noise, conducting noise, probe materials, grounding conditions, and the probe configuration, most of which should be determined cautiously. The ground resistance is as low as 16Ω and so the probe is produced by trial and error. The measurement of the voltages is carried out where the vertical component of the current is zero, as shown in Fig. 4(a). The vertical uniform field by the apparatus shown in Fig. 1 only generates voltages on the 2 dimensional x-y plane. Under the non-uniform field conditions the measurement spots are on the same plane as the two conductors, as shown in Fig. 4(b). This is because when the all 3 dimensional voltages are to be measured in one spot, technical problems such as correct positioning of the probe and the crushing of the agar phantom can occur.
Consequently, 2 dimensional measurements are recommended for cases without precise position measuring instrumentation.
Fig. 5. The probe.
As shown in Fig. 5, the probe employs a dually shielded structure. Its core consists of a twisted wire pair wrapped by a braided shield and aluminum tape. The probe has three electrodes, one of which comes from the grounded braided shield wire and is placed in the middle of the other two electrodes. The electrode housing is filled with silicone and epoxy resin. The length of the electrode is set at 10 mm and the width between the two sensing electrodes is set at 2.5 mm. The average error of measurement is kept to under 5% by calibration before every measuring process.
3. Numerical method
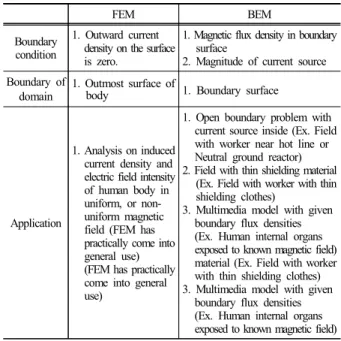
Table 1. The FEM and BEM comparison
FEM BEM
Boundary condition
1. Outward current density on the surface is zero.
1. Magnetic flux density in boundary surface
2. Magnitude of current source Boundary of
domain 1. Outmost surface of
body 1. Boundary surface
Application
1. Analysis on induced current density and electric field intensity of human body in uniform, or non- uniform magnetic field (FEM has practically come into general use) (FEM has practically come into general use)
1. Open boundary problem with current source inside (Ex. Field with worker near hot line or Neutral ground reactor) 2. Field with thin shielding material
(Ex. Field with worker with thin shielding clothes)
3. Multimedia model with given boundary flux densities (Ex. Human internal organs exposed to known magnetic field) material (Ex. Field with worker with thin shielding clothes) 3. Multimedia model with given
boundary flux densities (Ex. Human internal organs exposed to known magnetic field)
For the calculation of induced current density, methods such as IM, FEM, and BEM are employed. IM has the simplest algorithm, but it is used less frequently and commercially available programs are not as common as those that offer the FEM and BEM algorithms. Table 1 provides comparisons of the FEM and BEM methods from an application point of view. Whereas FEM is the most contributory method, BEM has the some merits of convenience in specific models.
3.1 The Impedance Method (IM)
IM is a type of Transmission Line Matrix Method modeling the conductive media as a transmission line. As
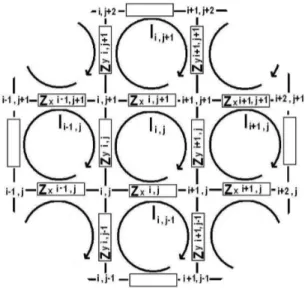
Fig. 6. The 2D impedance method.
a consequence, a steady state lumped constant circuit is formed that can be analyzed with an easy to handle sparse matrix4,5).
j) 1, Ii j (Ii, j 1, iy Z 1) j Ii, j (Ii, 1 j i,x Z
j) 1, Ii j (Ii, j i,y Z 1) j Ii, j (Ii, j i,x Z
ds ABi,j n j t
Vi,
(3)
Fig. 6 shows that the media to be investigated is comprised of square cells in the 2-D IM modeling.
Recent research shows that the size and shape of a cell in the media boundary can be adaptively determined.
Equation (3) determines the induced voltage Vi,j by Magnetic flux Bi,j ; Ii,j is the loop current. The human conductivity is σ + jωε, which turns out to be σ at the extremely low frequency of 60Hz (σ ≫ jωε). Then the complex impedance Zi,j is also determined by (3). The current density is obtained by solving the equations simultaneously.
3.2 The Boundary Element Method (BEM)
The BEM produces a solution using triangular surface elements projected on human skin or other organs.
Magnetic flux B in (4) is given as the boundary condition on the skin. The induced electric field E in (4) is set to the unknown nodal variables. With E obtained the induced current density J is determined simply by
multiplying it with conductivity σ. The basic equations related to the magnetic field induction current analysis are as follows and the time differential is transformed into jω.
∇ × E = - jωB (4)
∇ · J = 0 (5)
J =σE (6)
In this study we used the “Faraday 3D” program with a 3 dimensional BEM made by IES (Integrated Engineering Software) in Canada.
3.3 The Finite Element Method (FEM)
In order to analyze induced current J in a human body, we additionally used FEM, which is a type of numerical method used to solve various partial differential equations6,7).
For this problem, the governing equations are (7) and (8).
∇·(σ∇Ф) = -∇·(σA) (7)
E = -j2πf (A+∇Ф) (8)
where σ and A are the electrical conductivity of human tissue and the magnetic vector potential given by an external electromagnetic field or electric current, respectively8,9). Equation (7) is adopted for convenient formulation, although it is a physically wrong definition of electric field intensity E. The induced current can be derived after obtaining the electric scalar potential Ф, using (6) and (7). Because electric current cannot penetrate the air from human skin, the outward normal current density on the surface is zero at the boundary.
For the FEM analysis, we used tetrahedral elements; the approximated electric potential is interpolated by linear shape functions. Therefore, the electric field intensity and current density have a constant value in an element.
4. The Case Studies
Using both the laboratory and numerical approaches mentioned above, several exposure assessments have been carried out; the results of the two approaches have been compared and cross-checked.
4.1 The IM Case Study
As shown Fig. 7 the multi-media model, which resembles a cross-section of a human abdomen consisting of liver, kidney, bone, and blood is made of agar with the different conductivities controlled by salts. The model is 400 mm in diameter and is 40 mm tall and is modeled after the human tomogram found8,9).
Table 2 shows the conductivity of each organ.
Fig. 7. The construction of the cross-sectional human phantom model.
Table 2. The tissue conductivity
(Unit : S/m) Tissue Conductivity in 50/60 Hz
Liver Kidney
Bone Blood Other substances
0.13 0.16 0.04 0.60 1.39(0.9% NaCl solution)
Fig. 8 shows the IM calculation results in which the model has 33×33 cells under the same magnetic field 0.3
Fig. 8. The 2-D distribution of the induced current inside the human model.
Fig. 9. The comparison between the measurement and the IM calculation.
mT as in the experiment found10). Fig. 9 shows the comparison of the two results. The two figures show that the current is focused on the side which has the higher conductivity in the boundary layer of the different materials and the results by the two methods are reliable within certain boundary limits.
4.2 The BEM Case Study
For the BEM study, the current densities induced inside the body of a lineman from a 765 kV transmission line was analyzed both with and without a protective cloth, as found11,12). We calculated the current densities induced in organs inside the worker for locations 15, 30, 50, and 100 cm from a prefabricated jumper. In this case the current source and thin clothes, both of which are suitable for the BEM model, are included in the calculation.
3308 A, 60% of the maximum load current, was assumed to flow in the prefabricated jumper with the lineman working 15cm outside it. Various protective materials have been tried for the shielding cloth. In case of permalloy, which has a relative permeability of 3.8×10³ and a conductivity of 1.666×10⁶, the maximum induction current density at the heart and brain is 0.46 and 0.31 mA/m2, respectively. This means that the higher the
Fig. 10. The simulation model of a lineman and a prefabricated jumper.
Table 3. The maximum induction current densities for organs with various shielding materials
(Unit : mA/m2)
Organ Materials
Copper Silicon Permalloy
Brain Heart Lungs Liver Intestines
9.839 19.151 3.270 3.550 0.8252
2.096 3.950 0.5978 0.6472 0.2933
0.3050 0.4594 0.0746 0.1798 0.0485
permeability of the material used for a shielding cloth, the smaller the current density induced inside the human body. The maximum induction current densities of organs for various shielding cloth materials in the above cases are summarized in Table 3 when a lineman works at 15 cm outside the jumper.
From the results of this study, we found that the maximum current density induced in all organs may be higher than 10 mA/m2 if the lineman does not wear protective clothes.
We also found that high permeability materials lower current density more than high conductivity materials.
4.3 The FEM Case Study
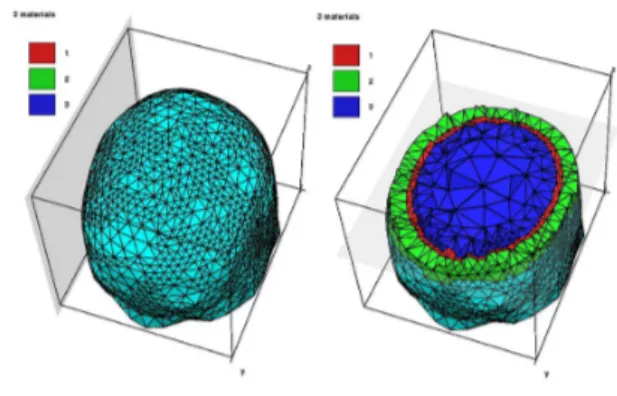
The process used to make the phantom head molds with 3 different media and measurement of current density is represented in Fig. 11. FRP (Fiberglass Reinforced Plastics) and plaster moulds were used for casting the agar models.
All the molds except the outermost one were removed from the finished phantom for measurement. The conductivities of the three layers in the head were 0.341, 0.016 and 0.14 S/m for the scalp, skull, and brain, respectively.
Fig. 11. The FRP head molds and finished model.
Fig. 12. The FEM input data.
For the FEM current density calculation under a uniform magnetic field of 0.3 mT, the phantom head from Fig. 11 was modeled using 6,721 nodes and 35,905 elements, as shown in Fig. 12. The measured current densities were compared to the numerical values calculated by FEM for both the Sagittal and frontal planes. The measurements were carried out twice with a new phantom each time. The current density results are shown in Fig. 13. The three sets of values do not agree exactly, but show a similar tendency with a permissible level of error.
Fig. 13. The comparison between the measurement and FEM calculation on the sagittal plane.
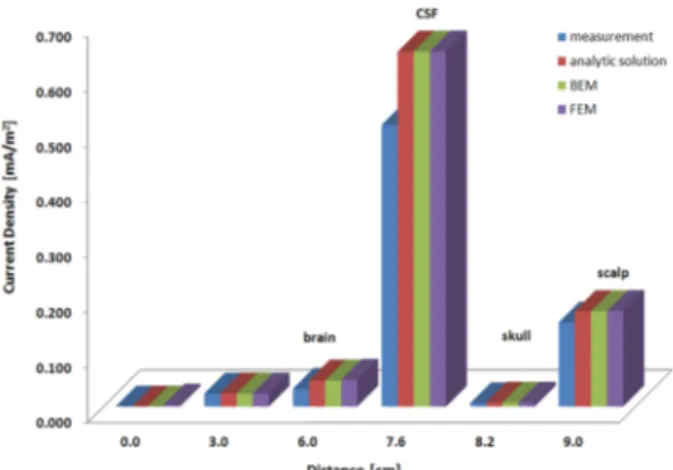
4.4 The Accuracy Comparison of the Different Tools
The comparison of solutions obtained through BEM and FEM were carried using simple 2-D vertical concentric cylinders which have analytical solutions under a uniform magnetic field. The tests consisted of four media with different conductivities: brain: 0.14 S/m, cerebrospinal fluid: 1.5 S/m, skull: 0.016 S/m, and scalp:
0.341 S/m. The conductivity of the cerebrospinal fluid is about 94 times that of the skull, which may be assumed
Fig. 14. The comparison of the current densities obtained by the various methods.
to cause an inaccurate calculation. As shown in Fig 14, the degree of precision for each method is substantially the same except for the measurement. However, the measured values are close to the calculated values. The consequence is that if the numerical calculation method is used, the accuracy is not a large issue except in special cases.
5. Conclusions
1) Before carrying out an assessment according to the application model
- FEM should be adopted if the model has complex composite media like a human inner organ.
- BEM should be used in cases of existing of inner current sources with thin plate-like shielding screens
2) Although the accuracy of the laboratory methods is less than that found for the calculations, the direct measurement method is recommended if the model demands various postures. This is because data generation from a whole human body is difficult at the present time.
3) Multi-material models can be characterized by the three numerical methods used in this study and precise solutions can be obtained. Therefore if a numerical method is chosen, the numerical error is of no particular importance except for special cases.
4) In a real human body the situation is more complicated, as many different types of material are present. Therefore the accurate modeling of a body is directly related to the evaluation of the exact values. This means that the prospective problem to be solved concerns the modeling of the human body with accurate geometry and conductivity.
5) The probe should be cautiously produced and frequently calibrated. It should have a dually shielded structure and a core consisting of a twisted wire pair shielded by a braided ground wire.
6) The current density distributions measured in a human phantom and the concurrent calculations show similar patterns in each case, which proves that all of the assessment tools used for ELF EMF exposure are reasonable.
References
1) International Commission on Non-Ionizing Radiation Protection, “ICNIRP Guidelines for Limiting Exposure to Time-Varying Electric, Magnetic, and Electromagnetic Fields (up to 100 kHz)”, Health Phys., Vol. 99, pp. 818-836, 2010.
2) International Commission on Non-Ionizing Radiation Protection, “Guidelines for Limiting Exposure to Time- Varying Electric, Magnetic, and Electromagnetic Fields (up to 300 GHz)”, Health Phys., Vol. 74, pp. 494-522, 1998.
3) D. L. Miller, “Miniature-Probe Measurements of Electric Fields and Currents Induced by 60Hz Magnetic Field in Rat and Human Models”, Bioelectromagnetics, Vol. 17 No. 3 pp. 167-173, 1991.
4) M. Eberdt, P. K. Brown, and G. Lazzi, “Two-Dimensional SPICE-Linked Multiresolution Impedance Method for Low-Frequency Electromagnetic Interactions”, IEEE Trans. on Biomedical Eng., Vol. 50, No. 7, 2003.
5) Mohammad Nadeem, Thorleif Thorlin, Om P. Gandhi and Mikael Persson, “Computation of Electric and Magnetic Stimulation in Human Head Using the 3-D Impedance Method”, IEEE Trans. on Biomedical Eng., Vol. 50, No. 7, 2003.
6) A. J. Davies, “The Finite Element Method: A First Approach”, The Mathematical Gazette, Vol. 65, No. 431, pp.60-60, 1981.
7) V. Thomée, “From Finite Differences to Finite elements: A Short History of Numerical Analysis of Partial Differential Equations”, J. Comput. Appl. Math., Vol.128, pp.1-54, 2001.
8) T. W. Dawson, K. Caputa and M. A. Stuchly, “A Comparison of 60 Hz Uniform Magnetic and Electric Induction in the Human Body”, Phy. Med. Biol., Vol.42, pp.
2319-2329, 1997.
9) T. W. Dawson, K. Caputa and M. A. Stuchly, “Numerical Evaluation of 60 Hz Magnetic Induction in the Human
Body in Complex Occupational Environments”, Phy. Med.
Biol., Vol.44, pp.1025-1040, 1999.
10) H. I. Ahn, “A Study on Current Distribution Induced in Human Models by Low-Frequency Magnetic Fields”, Ph.
D. Thesis, Safety Eng. Hoseo Univ. 2003.
11) S. -W. Min and J. -H. Park, “Magnetic Field Reduction Characteristics of Hot-Line Worker's Shielding Wear for
765 ㎸ Double Circuit Transmission Line”, Trans. KIEE.
Vol. 56, No. 9, pp. 1521-1706, 2007.
12) K. Yamazaki, T. Kawamoto, H. Fujinami and T.
Shigemitsu, “Investigation of ELF Magnetically Induced Current Inside Human Body - Development of Estimation Tools and Effect of Organ Conductivity”, Trans. IEE Japan, Vol. 120-A, pp. 81-87, 2000.