• 검색 결과가 없습니다.

Multi-temporal Analysis of Deforestation in Pyeongyang and Hyesan, North Korea

N/A
N/A
Protected

Academic year: 2021

Share "Multi-temporal Analysis of Deforestation in Pyeongyang and Hyesan, North Korea"

Copied!
11
0
0

로드 중.... (전체 텍스트 보기)

전체 글

(1)

1. Introduction

In North Korea, economic crisis has been worse since 1990s. Because of economic aggravation, food shortages got worse and it caused deforestation to clear

a field for food or fuel. Moreover, the deforestation have been causing a variety of additional problems. In particular, the deforestation can increase vulnerability to climate change and possibilities to have significant damage to natural disasters such as floods. Especially,

Multi-temporal Analysis of Deforestation in Pyeongyang and Hyesan, North Korea

Sunmin Lee, Sung-Hwan Park and Hyung-Sup Jung

Department of Geoinformatics, University of Seoul

Abstract : Since forest is an important part of ecological system, the deforestation is one of global substantive issues. It is generally accepted that the climate change is related to the deforestation. The issue is worse in developing countries because the forest is one of important natural resources. In the case of North Korea, the deforestation is on the rise from forest reclamation for firewood collection and food production.

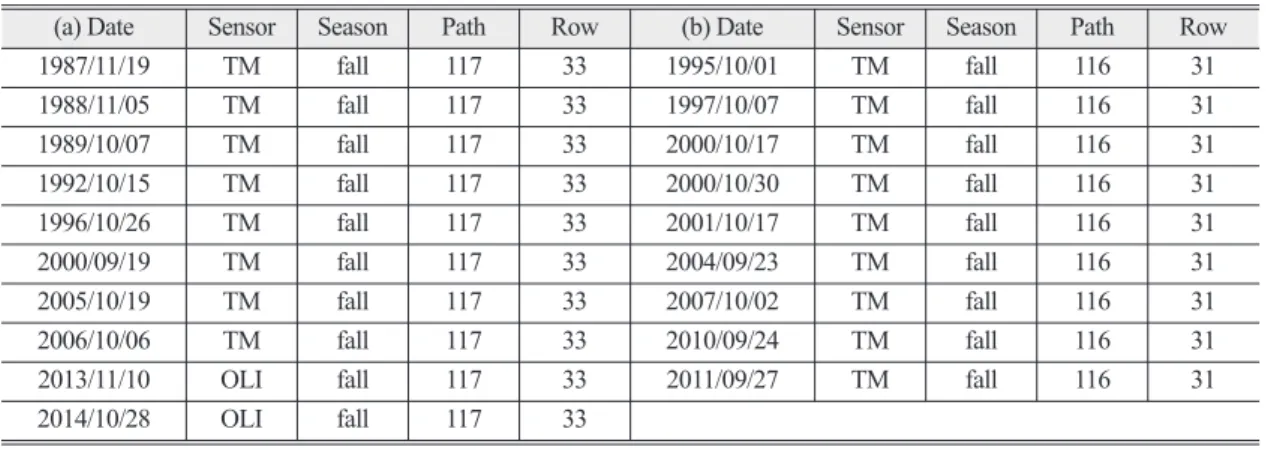
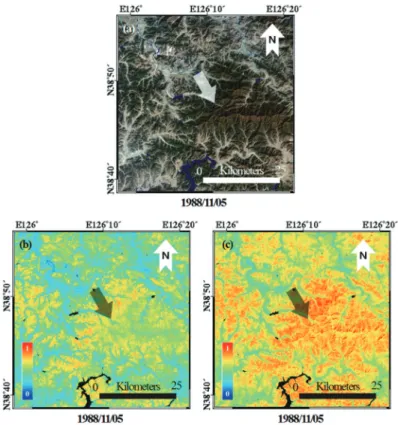
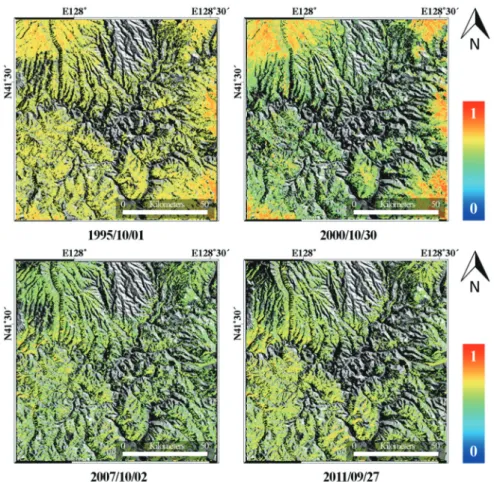
Moreover, a secondary effect from flood intensifies the damage. Also, the political situation in North Korea presents difficulty to have in-situ measurements. It means that the accurate information of North Korea is nearly impossible to obtain. Thus, assessing the current situation of the forest in North Korea by indirect method is required. The objective of this study is to monitor the forest status of North Korea using multi- temporal Landsat images, from 1980s to 2010s. Since the deforestation in North Korea is caused by local residents, we selected two study areas of high population density: Pyeongyang and Hyesan. In North Korea, most of clean Landsat images are acquired in fall season. The fall images have an advantage that we can easily distinguish agriculture areas from forest areas, also have an disadvantage that the forests cannot be easily identified because some of trees have turned red. To identify the forests exactly, we proposed a modified Normalized Difference Vegetation Index (mNDVI) value. The deforestation in Pyeongyang and Hyesan was analyzed by using mNDVI. The dimension of forest has decreased approximately 36% in Pyeongyang for 27 years and approximately 25% in Hyesan for 16 years. The results show that the forest areas in Pyeongyang and Hyesan have been steadily reduced.

Key Words : Deforestation, Degraded forest, North Korea, Normalized Difference Vegetation Index(NDVI), Pyeongyang, Hyesan

Received February 16, 2016; Revised February 23, 2016, Accepted February 25, 2016.

Corresponding Author: Hyung-Sup Jung ([email protected])

This is an Open-Access article distributed under the terms of the Creative Commons Attribution Non-Commercial License (http://creativecommons. org/licenses/by-nc/3.0) which permits unrestricted non-commercial use, distribution, and reproduction in any medium, provided the original work is properly cited

Article

(2)

in the case of North Korea, most of the land is made up of mountainous forest. The characteristic increases the damage such as a flood disaster in 1995. Harm leads to secondary damage even greater, such as landslides (Myeong, 2013).

Forest decline increases the carbon dioxide emissions and impacts on climate change (IPCC, 2013). In the Korean peninsula, 100 years average temperature rise is about 1.5˚C which is twice faster than world average temperature rise of 0.74˚C. The climate change is going faster in the North Korea (Myeong, 2013). Since the issues arose, many internal and external institutions and researchers released the statistics for the North Korea to monitor the deforestation. However, the differences between the different statistics of the deforestation led policy makers to confusion (Park, 2013). Thus, in order to make systematic and efficient forest management policies, more accurate forest information of North Korea is required.

Pyeongyang and Hyesan in North Korea are representative cities which have a big problem of deforestation. It should be noted that the two cities are included in five pilot project cities for forest restoration.

The residents in and nearby the cities have devastated forest due to their economic distress. It is one of main reasons of the deforestation occurs in the cities (Park, 2013). However, owing to North Korea’s geographical and social characteristics, it is almost impossible to access the forest in North Korea and acquire in-situ measurement data. Thus, the remote sensing technique is an adequate method to overcome the limitation of an inaccessible area. The social demand for the application of remote sensing has been increased steadily (Ka, 2000). The remote sensing methods are widely used in Earth surface monitoring and change detection (Roy et al., 2014; Cho et al., 2013; Park et al., 2012; Kim et al., 2014). Among the various remote sensing satellite images, the Landsat satellite images have been operated from 1972 with 16 days repeat cycle. Due to various

spectral bands as well as the long operation period, the Landsat images have been used for the Earth surface observation in many field (Park et al., 2012; Kim et al., 2014; Hong et al., 2013). Thus, the remote sensing method is allowed to minimize the limitations of accessibility in North Korea through satellite image utilization. Furthermore, for the sustainable forest management, the time-series analysis of forest in current situation is valuable. Among various methods, the Normalized Difference Vegetation Index (NDVI) algorithm is widely used for identifying forest areas (Ryu et al., 2013; Lenney et al., 1996; Yue et al., 2007).

The purpose of this paper is to monitor the deforestation in Pyeongyang and Hyesan cities using multi-temporal Landsat satellite images. For the multi- temporal analysis, 10 and 9 Landsat images from 1987 to 2014 are used for the deforestation monitoring of Pyeongyang and Hyesan, respectively. Since most of the images were acquired in fall season, we proposed and used a modified NDVI (mNDVI) in order to reduce the effect of red-turned trees. The deforestation in Pyeongyang and Hyesan is analyzed by using the mNDVI.

2. Study Area and Data

1) Study Area

Pyeongyang is the capital city of North Korea, administered as a directly governed city located on the Taedong River. The latitude and longitude are respectively 38.41°S ~ 39.17°S and 125.31°W ~ 126.41°W (Fig. 1). Pyeongyang is almost the only city where the number of the population kept growing since North Korea’s economy dropped down (Ko, 1996;

Hong et al., 2013). According to results from the

population census, its population is around 3 million in

2008; it is the most populated city. Pyeongyang is

influenced by continental monsoon so that the

(3)

difference of temperature is large between summer and winter. It has average annual temperature of 9.6 degrees, and the average annual rainfall is about 987 mm. Pyeongyang is composed of sedimentary plains and peneplain made by Taedong river and surrounded by scattered low hills: Chungryong Mountain (400 m), Chungwoon Mountain (363 m), Guksabong (448 m), etc (Hong et al., 2013).

Second spatial extent of this study is Hyesan which is one of the main industrial cities in the northern part of Ryanggang province of North Korea. The latitude and longitude are respectively 37.50°S ~ 38.05°S and 126.07°W ~ 126.24°W and the population of the city was about 86,300 (Fig. 1). Hyesan is far from the ocean and located in the highlands. It has strong characteristic of a continental climate. The average annual temperature is 3.9 degrees and annual precipitation is only around 600 mm. Hyesan is one of the coldest

places on the Korean peninsula. In 1915, Hyesan recorded a lowest temperature of -42 degrees. Hyesan is in the highlands, the elevation up to 700m and it is located where the two rivers converged: Yalu River and Heocheon River. In a macro perspective, Hyesan is in the heart of Hyesan basin surrounded by mountains up to around elevation 2000m. Elevation is high in south and becomes low to the north (Kim and Kim, 2005).

2) Data

Landsat-5 TM and Landsat-8 OLI images are used

for the multi-temporal analysis of the deforestation

area. The Landsat images of 8 Landsat-5 TM images

and 2 Landsat-8 OLI images for Pyeongyang and 9

Landsat-5 TM images for Hyesan are used for

monitoring the deforestation of the forest area around

the city (Table 1). To correct the misalignments, the

geometric coregistration has been also performed

Fig. 1. Location of the Study Areas: (b) Pyeongyang and (c) Hyesan.

(4)

through the images. Most of the images were obtained in fall season because the weather in the fall season is normally good.

3. Methods

To determine the deforested area and the temporal variation of forest area, a few steps are required. The

procedure can be divided into three steps: 1) atmospheric correction: it is performed on every single image using the cosine approximation (COST) atmospheric correction model by assuming the atmosphere effects are nearly equivalent in an image, 2) forest area extraction: it is conducted by using the mNDVI algorithm, and 3) multi-temporal analysis of the deforestation. The detailed workflow is represented in Fig. 2.

Fig. 2. Detailed workflow of this study.

Table 1. The data of this study: (a) Pyeongyang, (b) Hyesan

(a) Date Sensor Season Path Row (b) Date Sensor Season Path Row

1987/11/19 TM fall 117 33 1995/10/01 TM fall 116 31

1988/11/05 TM fall 117 33 1997/10/07 TM fall 116 31

1989/10/07 TM fall 117 33 2000/10/17 TM fall 116 31

1992/10/15 TM fall 117 33 2000/10/30 TM fall 116 31

1996/10/26 TM fall 117 33 2001/10/17 TM fall 116 31

2000/09/19 TM fall 117 33 2004/09/23 TM fall 116 31

2005/10/19 TM fall 117 33 2007/10/02 TM fall 116 31

2006/10/06 TM fall 117 33 2010/09/24 TM fall 116 31

2013/11/10 OLI fall 117 33 2011/09/27 TM fall 116 31

2014/10/28 OLI fall 117 33

(5)

1) Atmospheric Correction

In this study, the NDVI algorithm is used to extract the forest area from the Landsat images. When the satellite observes the Earth’s surface, the electromagnetic energy is detected by a satellite imaging system. In this process, the energy is influenced by the atmosphere and it causes scattering, absorption and refraction through the atmosphere.

Thus, an atmospheric correction should be performed before analyzing satellite images. For the atmospheric correction, the COST atmospheric correction model has been proposed by Chavez (1996). This method has been widely used among image based atmospheric correction models, which requires the assumption that atmospheric effect is equivalent in each image. Because the atmospheric transmittances for all spectral bands are approximated by the cosine function of the solar zenith angle, the COST model does not need any measurement data of the atmosphere. The spectral reflectance of each bands from the COST model is as follows (Chavez, 1996).

ρ = (1) where ρ is spectral reflectance of the surface; L

λ

is spectral radiance of satellite sensor; L

p

is the path radiance which is derived from the dark-object area; d is Earth-Sun distance; ESUN

λ

is solar spectral irradiance on a surface perpendicular to the sun’s ray outside of the atmosphere; θ

z

is solar zenith angle; T

θ0

is cosine solar zenith angle adjust to COST model.

2) Modified NDVI

To extract the forest area from Landsat multi-spectral imagery, it is necessary to distinguish forest from the others. Usually, the forest identification is done by using visible and Near-InfraRed (NIR) spectral regions.

It is because green plants have a low reflectance in the red region while it have a high reflectance in the NIR region, especially from 0.7 to 1.1 μm (Lenney et al.,

1996; Brown et al., 2006; Ryu et al., 2013). The NDVI algorithm offers the vegetation identification based on the reflectance difference between the Red and NIR regions. The NDVI algorithm is calculated from (Lenney et al., 1996; Yue et al., 2007).

NDVI = (2) As aforementioned, the weather condition in North Korea exerts a strong influence on the rate of satellite image acquisition. Thus, most satellite images were obtained in fall season, and hence the fall season is an optimum period of time to analyze the temporal variation of the deforestation in North Korea. The fall season image is easy to distinguish forest areas from grass and agriculture areas. However, the NDVI values of red-turned trees in fall season images are low due to relatively high reflectance in the red region (Fig. 3).

Although the NDVI values are low the area could still belong to the forest which should be detected as forest.

To overcome the drawback, we introduced modified NDVI as given by:

mNDVI = (3) In mNDVI algorithm, the reflectance of the red band is replaced into averaging the reflectance of the red, green and blue bands. In this study, it is assumed that mNDVI values of more than 0.4 are extracted to forest area. Consequently, we have produced mNDVI maps from Landsat images after atmospheric correction. The forest areas have been extracted from the mNDVI maps using the threshold of 0.4.

3) NDVI Threshold Value

The threshold value of NDVI could be used to discriminate mixed forests from the image, for example, and also could be used to derive various other seasonal metrics (Wang and Tenhunen, 2004). In the NDVI maps from optical images, pixels that has NDVI values over 0.5 are considered vegetation (Sobrino et al., 2006). However, in this study, since fall season π(L

λ

_ L

p

)·d

2

ESUN

λ

· cosθ

z

· T

θ0

NIR _ RED NIR + RED

NIR _ mean(R + G + B)

NIR + mean(R + G + B)

(6)

Fig. 3. Comparison between NDVI and mNDVI maps: (a) RGB composite image, (b) NDVI map and (c) mNDVI map.

Fig. 4. Determination of NDVI threshold: (a) Landsat image, (b) high-resolution image and (c) NDVI map.

(7)

Landsat images and the mNDVI is used, the threshold value needs to be changed. The mNDVI values in the red-turned tree areas are higher than the NDVI values, but overall mNDVI values are a little bit lower than overall NDVI. Thus, the threshold value of mNDVI must be lower than that of NDVI. A visual analysis is performed to determine the threshold of mNDVI, and high-resolution satellite images are used to validate the threshold determination, as seen in Fig. 4.

Consequently, the determined mNDVI threshold value is 0.4 in this study.

4. Results

In this study, the deforestation in Pyeongyang and Hyesan was observed from multi-temporal Landsat

satellite images. Since optical sensors cannot observe land and ocean surfaces in a cloudy day, we usually use optic images with mostly no clouds. The weather condition in North Korea is not good in the spring, summer and winter seasons, and hence we cannot acquire Landsat satellite images with mostly no clouds in these seasons. This is the reason why most of the Landsat images used for this study were obtained in the fall season. In order to extract the red or yellow leaves as well as the green leaves in the fall Landsat images, the mNDVI maps at Pyeongyang and Hyesan were generated. After the COST atmospheric correction, we generated NDVI maps to validate the improvement of performance of mNDVI map and compared the performances of the NDVI and mNDVI maps.

Figs. 5 and 6 represent the mNDVI maps observed from the Landsat images in Pyeongyang and Hyesan,

Fig. 5. mNDVI maps in Pyeongyang acquired in (a) 19 November 1987, (b) 26 October 1996, (c) 19 October 2005 and (d) 28 October

2014.

(8)

respectively.

Fig. 5(a-d) present the mNDVI maps of Pyeongyang acquired in 1987, 1996, 2005 and 2014, respectively, and Fig. 6(a-d) show the mNDVI maps of Hyesan acquired in 1995, 2000, 2007 and 2011, respectively.

The figures indicate the temporal variation of the deforestation derived from the mNDVI algorithm. As shown in Fig. 5, the forest area in 19 Nov. 1987 is much larger than the forest area in 28 Oct. 2014. It means that the forest area in Pyeongyang has been declined steadily from 1987 to 2014. It would indicate that the deforestation has been caused by city residents because of the economic situation in North Korea. A similar tendency appears in Fig. 6 which is extracted by mNDVI maps. The deforestation in Hyesan has the tendency to decrease gradually.

Fig. 7 compares the deforestation estimated from the

mNDVI maps with the deforestation from the NDVI maps in Pyeongyang and Hyesan. Fig. 7(a,c) represent the forest area extracted by using NDVI while Fig.

7(b,d) show the forest area extracted by mNDVI. In Pyeongyang and Hyesan, the forest area extracted by the NDVI maps is much smaller than the forest area from the mNDVI maps because red-turned trees cannot be detected by the NDVI maps. The forest area from NDVI maps in Pyeongyang does not have a decreasing trend from 1987 to 2006, but decreases steeply in 2013 and 2014 (Fig. 7(a)). As shown in Fig. 7(b), the forest area from the NDVI maps does not show the deforestation but the afforestation. As aforementioned, it is caused by the effect of the red-turned trees.

However, we can find a distinct decreasing tendency

in forest area extracted from mNDVI at both the cities

(Fig. 7(b,d)). It could be recognized that mNDVI is

Fig. 6. mNDVI maps in Hyesan acquired in (a) 1 October 1995, (b) 30 October 2000, (c) 2 October 2007 and (d) 27 September 2011.

(9)

superior to NDVI in the forest extraction from fall multi-spectral images. Moreover, the tendency of the deforestation can be more estimated much more precisely by using mNDVI maps when satellite images are obtained in the fall season. The forest area decreased about 35.79% for 27 years from 1987 to 2014 in Pyeongyang and about 24.90% for 16 years from 1995 to 2011 in Hyesan, as shown in Fig. 7. The deforestation rates were -3,580 and -2,490 ha/yr in Pyeongyang and Hyesan, respectively. The result demonstrates that the forest area in North Korea can be identified by using mNDVI algorithm from fall season Landsat images. Moreover, the result confirms that mNDVI is an efficient method to monitor the changes of the forest area in Pyeongyang and Hyesan, North Korea.

5. Conclusion

The Landsat satellite images can be used to monitor the Earth observation with 30 m ground resolution and

multi-spectral bands in visible, NIR, SWIR and TIR spectral regions. The Landsat images have been acquired since 1972 and have indicated that it could be used to successful research material for monitoring Earth surface variations including forest. Nearly eighty percent of North Korean territory is covered with mountains. Forest resources are one of the major resources to local residents. In this study, we have examined the changes of the forest area in Pyeongyang and Hyesan in North Korea from 10 and 9 Landsat images. The COST atmospheric correction was applied to the Landsat images and the mNDVI maps were calculated from the Landsat images. The forest area of Pyeongyang and Hyesan were estimated from the mNDVI maps.

The deforestation rate is about 36% in Pyeongyang

between 1987 and 2013, and about 25% in Hyesan

between 1995 and 2011. The results from mNDVI

maps show that the deforestation has been ongoing

since 1980s. The results demonstrate 1) that the forest

area can be estimated by using mNDVI algorithm from

fall season images and 2) that the forest area in

Fig. 7. Comparison between the forest areas estimated from (a,c) NDVI and (b,d) mNDVI maps.

(10)

Pyeongyang and Hyesan has been deforested since 1980s.

Acknowledgment

This research (NRF-2015R1A2A2A01005018) was supported by Mid-career Researcher Program through National Research Foundation of Korea (NRF) grant funded by the Ministry of Education, Science and Technology (MEST).

References

Brown, M. E., Pinzon, J. E., Didan, K., Morisette, J. T.

and Tucker, C. J., 2006. Evaluation of the consistency of long-term NDVI time series derived from AVHRR, SPOT-vegetation, SeaWiFS, MODIS, and Landsat ETM+

sensors, Geoscience and Remote Sensing, IEEE Transactions on, 44 (7): 1787-1793.

Chavez, P.S., 1996. Image-based atmospheric corrections revisited and improved, American Society for Photogrammetry and Remote Sensing, 62(9): 1025-1036.

Cho, M., Z. Lu and C.-W. Lee, 2013. Time-series Analysis of Pyroclastic Flow Deposit and Surface Temperature at Merapi Volcano in Indonesia Using Landsat TM and ETM+, Korean Journal of Remote Sensing, 29(5): 443- 459 (In Korean with English abstract).

IPCC, Climate Change 2013, 2013. The physical science basis: Summary for policymakers, Fifth Assessment Report, Cambridge University Press.

Hong, S.-Y, S.-K. Rim, S.-H. Lee, J.-C. Lee and Y.-H.

Kim, 2008. Spatial Anaylsis of Agro- Environment of North Korea Using Remote Sensing: I. Landcover Classification from

Landsat TM imagery and Topography Analysis in North Korea, Korean Journal of Environmental Agriculture, 27(2): 120-132 (In Korean with English abstract).

Hong, G.D., S.H. Kim and I. Son, 2013. A Study on Distributions and Spatial Properties of Geomorphological Mountain Area, The Korean Journal of Geographical Society, 12(2): 11-26 (in Korean with English abstract).

Ka, M.H., 2000. Application of Spaceborne Earth Remote Sensing Information, Korean Journal of Remote Sensing, 16(3): 261-279 (in Korean with English abstract).

Kim, J.-C., D.-H. Kim, S.-H. Park, H.-S. Jung and H.- S. Shin, 2014. Application of Landsat images to Snow Cover Changes by Volcanic Activities at Mt. Villarica and Mt. Lliama, Chile, Korean Journal of Remote Sensing, 30(3): 341-350 (in Korean with English abstract).

Kim, J.-Y. and J.-Y. Kim, 2005. A Review on the Study of Landforms in North Korea, Journal of the Korean Geomorphological Association, 12(2):

11-26 (in Korean with English abstract).

Ko, S.-H., 1996. Process and Characteristics of North Korea’s Urbanization, Study of Unification, 8(1): 137-157 (in Korean).

Lenney, M.P., C.E. Woodcock, J.B. Collins. and H.

Hamdi, 1996. The status of agricultural lands in Egypt: the use of multitemporal NDVI features derived from Landsat TM, Remote Sensing of Environment, 56(1): 8-20.

Myeong., S.-J., 2013. A Study on Constructing a Cooperative System for South and North Koreas to Counteract Climate Change on the Korean Peninsula 3, Korean Environment Institute.

Park K., 2013. The Status of Forest and Forest Policy of North Korea, Quarterly Agricultural Trends in North Korea, 15(3): 1-21 (In Korean).

Park, S.-H., H.-S. Jung and M. Lee, 2012. Analysis on

(11)

the snow cover variations at Mt. Kilimanjaro using Landsat satellite images, Korean Journal of Remote Sensing, 28(4): 409-420 (In Korean with English abstract).

Roy D.P., M.A. Wulder, T.R. Loveland, C.E.

Woodcock, R.G. Allen, M.C. Anderson, D.

Helder, J.R. Irons, D.M. Johnson, R.Kennedy, T.A. Scambos, C.B. Schaaf, J.R. Schott, Y.

Sheng, E.F. Vermote, A.S. Belward, R.

Bondschadler, W.B. Cohen, F. Gao, J.D.

Hipple, P. Hostert, J. Huntington, C.O. Justice, A. Kilic, V. Kovalskyy, Z.P. Lee, L. Lymburner, J.G. Masek, J. McCorkel, Y. Shuai, R. Trezza, J. Vogelmann, R.H. Wynne and Z. Zhu, 2014.

Landsat-8: Science and product vision for terrestrial global change research, Remote Sensing of Environment, 145: 154-172.

Ryu, J.-H., K.-S. Han, K.-J. Pi and M.-J. Lee, 2013.

Analysis of Land Cover Change Around Desert

Areas of East Asia, Korean Journal of Remote Sensing, 29(1): 105-114 (in Korean with English abstract).

Sobrino, J.A., Y. Julien, and L. Morales, 2006.

Multitemporal analysis of PAL images for the study of land cover dynamics in South America, Global and Planetary Change, 51(3- 4): 172-180.

Wang, Q. and Tenhunen, J. D. 2004. Vegetation mapping with multitemporal NDVI in North Eastern China transect (NECT), International Journal of Applied Earth Observation and Geoinformation, 6(1): 17-31.

Yue, W., Xu, J., Tan, W. and Xu, L. 2007. The

relationship between land surface temperature

and NDVI with remote sensing: application to

Shanghai Landsat 7 ETM+ data, International

Journal of Remote Sensing, 28(15): 3205-3226.

수치

Fig. 2.  Detailed workflow of this study.
Fig. 3.  Comparison between NDVI and mNDVI maps: (a) RGB composite image, (b) NDVI map and (c) mNDVI map.
Fig. 5.  mNDVI maps in Pyeongyang acquired in (a) 19 November 1987, (b) 26 October 1996, (c) 19 October 2005 and (d) 28 October 2014.
Fig. 7 compares the deforestation estimated from the

참조

관련 문서

I have applied to Dankook University in (Jukjeon or Cheonan), Korea for 2021 academic year and I agreed that Dankook University could rightfully make a

It has been observed that different kinds of images have varying texture and structure complexions Therefore, the fixed patch size may not provide equally good results.

Since then, many research applications of 10 Be for both terrestrial and extraterrestrial applications have been developed, which parallel the wide range

This study confirmed that the characteristics of cyberspace, hypermedia and multi-sensory experience of new media in the fourth industrial revolution era can

North Korea is not the country which deserves to be invested, but it could play a crucial role in the process of propelling the South Korea's new

Background: 8,000 children died in North Korea in 2013 before they could reach 1 year of age. Consequently, the health of children has been at risk. The

Since the two countries have established diplomatic relations in 1992, the trade between Korea and China has been developing rapidly, By the end of 2006, Korea

For more than 70 years, North Korea and the United States have faced hostile relations and mutual distrust through military conflicts in the DMZ,