D I A B E T E S & M E T A B O L I S M J O U R N A L
This is an Open Access article distributed under the terms of the Creative Commons Attribution Non-Commercial License (http://creativecommons.org/licenses/by-nc/4.0/) which permits unrestricted non-commercial use, distribution, and reproduction in any medium, provided the original work is properly cited.
Prevalence and Risk Factors of Gastroesophageal Reflux Disease in Patients with Type 2 Diabetes Mellitus
Jun Ouk Ha1,*, Tae Hee Lee2,*, Chang Won Lee1, Ja Young Park1, Seong Ho Choi1, Hee Seung Park1, Jae Seung Lee1, Seung Heon Lee1, Eun Hee Seo1, Young Hwan Kim1, Young Woo Kang2
1Department of Internal Medicine, Busan St. Mary’s Hospital, Busan,
2Department of Internal Medicine, Konyang University College of Medicine, Daejeon, Korea
Background: Gastrointestinal symptoms are common in patients with type 2 diabetes mellitus (T2DM). The prevalence of gas- troesophageal reflux disease (GERD) in Korea appears to be increasing. Some studies have shown that T2DM is a risk factor for symptomatic GERD. However, this possibility is still debated, and the pathogenesis of GERD in T2DM is not yet fully under- stood. The aim of this study was to analyze the prevalence and risk factors (including autonomic neuropathy) of GERD in patients with T2DM.
Methods: This cross-sectional case-control study enrolled T2DM patients (n=258) and healthy controls (n=184). All partici- pants underwent physical examinations and laboratory tests. We evaluated medical records and long-term diabetes complica- tions, including peripheral and autonomic neuropathy in patients with T2DM. Esophagogastroduodenoscopy was performed in all patients. The Los Angeles (LA) classification was used to grade GERD. GERD was defined as LA grade A (or higher) or mini- mal change with GERD symptoms. GERD symptoms were examined using a frequency scale. Data were expressed as mean±standard error. Independent t-tests or chi-square tests were used to make comparisons between groups.
Results: The prevalence of GERD (32.6% vs. 35.9%, P=0.266) and GERD symptoms (58.8% vs. 59.2%, P=0.503) was not signifi- cantly different between T2DM patients and controls. We found no significant differences between T2DM patients with GERD and T2DM patients without GERD with respect to diabetic complications, including autonomic neuropathy, peripheral neuropa- thy, duration of DM, and glucose control.
Conclusion: The prevalence of GERD in patients with T2DM showed no difference from that of controls. GERD was also not as- sociated with peripheral and cardiovascular autonomic neuropathy, age, or duration of DM in patients with T2DM.
Keywords: Diabetes mellitus; Diabetic neuropathy; Gastroesophageal reflux
Corresponding author: Chang Won Lee http://orcid.org/0000-0002-6184-7171 Department of Internal Medicine, Busan St. Mary’s Hospital, 25-14 Yongho- ro 232beon-gil, Nam-gu, Busan 48575, Korea
E-mail: [email protected]
INTRODUCTION
Gastrointestinal (GI) symptoms are common in patients with type 2 diabetes mellitus (T2DM) [1]. These symptoms can in- fluence the patient’s health-related quality of life and affect di- etary habits, productivity, and employment status [2,3]. The prevalence of gastroesophageal reflux disease (GERD) is re-
ported as 10% to 20% in Western countries [4,5], whereas Asian countries have a lower prevalence. However, recent studies have shown that the prevalence of GERD is increasing in Asia [4,6]. A Korean study reported a prevalence of 18% for erosive esophagitis among patients with diabetes mellitus (DM) who underwent esophagogastroduodenoscopy (EGD) due to various GI symptoms [7].
http://dx.doi.org/10.4093/dmj.2016.40.4.297 pISSN 2233-6079 · eISSN 2233-6087
An association is suspected between GI symptoms and DM complications (autonomic neuropathy, peripheral neuropa- thy, and microvascular complications) and poor glycemic control in patients with DM [8-10]. Some studies have shown that T2DM is a risk factor for symptomatic GERD [11], and a higher prevalence (28%) of abnormal GE reflux appeared among asymptomatic diabetic patients than among the gen- eral population [12]. However, this relationship is still debat- ed, and the pathogenesis of GERD in T2DM is not yet fully understood.
The aim of this study was to analyze the prevalence and risk factors (including peripheral and cardiovascular autonomic neuropathy) of GERD in Korean patients with T2DM.
METHODS
Study population
This study received the approval of the Clinical Ethics Com- mittee (BSM 2010-03). The research subjects included pa- tients with T2DM and a healthy control group, all over 40 years of age, who received a general checkup (including public corporation checkup) during the period between March 2010 and December 2010 and who provided informed consent for data usage.
Exclusion criteria included stomach or esophagus diseases found by endoscopy during the previous 6 months, current treatment with a gastric acid blocker, cardiovascular diseases or severe heart diseases (hospitalization due to cardiac infarc- tion, stroke, or heart failure during the previous 3 months), renal diseases (creatinine over 2.0 mg/dL), type 1 diabetes, and failure to acquire consent. This study was designed by the division of endocrinology and metabolism at Busan St. Mary’s Hospital, and informed consent was received by the Division of Endocrinology and Metabolism and other departments (the Health Examination Center, etc.). Due to a lack of active cooperation with other departments, the number of control group patients who provided informed consent was less than that of patients with T2DM, and this threshold resulted in a discrepancy of age and gender, etc., between T2DM patients and control group patients.
Study protocol
General anthropometry items (height, weight, waist measure- ment, and blood pressure), smoking and alcohol consump- tion history, and past and current medical histories were ex-
amined for all subjects. The subjects fasted for 8 hours and underwent blood tests in a public corporation checkup (fast- ing blood glucose, lipid profile, aspartate aminotransferase [AST], alanine aminotransferase [ALT], gamma-glutamyl- transpeptidase (γ-GTP), and creatinine) and an upper GI en- doscopy. The diabetes patients were also assessed for diabetes duration, glycosylated hemoglobin (HbA1c), complications (autonomic nerve disorder, peripheral nerve disorder, macro- vascular complications, peripheral arteriosclerosis, diabetic retinopathy, and diabetic nephropathy), and any current medi- cations.
Diagnosis of gastroesophageal reflux disease
All patients underwent an EGD. All study procedures were performed by five expert endoscopists who had each more than 1,000 endoscopies per year. The experts looked for esophageal mucosal breaks. Reflux esophagitis was graded us- ing the Los Angeles (LA) classification (Supplementary Table 1) [13]. Later, endoscopists were asked to decode the pictures, and the differences are shown in Table 1. In this study, the in- terobserver reliability of the endoscope result was included in substantial agreement (κ=0.703, P<0.001).
All patients completed a frequency scale for symptoms of GERD (FSSG) questionnaire to assess GERD symptoms. The FSSG consisted of 12 questions, scored to indicate the fre- quency of symptoms as follows: never, 0; occasionally, 1;
sometimes, 2; often, 3; and always, 4. Patients with FSSG scores of more than 8 were considered positive for GERD.
When the cut-off score is set at 8 points, this test shows a sen- sitivity of 62%, a specificity of 59%, and an accuracy of 60%
(Supplementary Table 2) [14]. In this study, GERD was diag- nosed when a patient had erosive esophagitis or nonerosive esophagitis with an FSSG score ≥8 and minimal change.
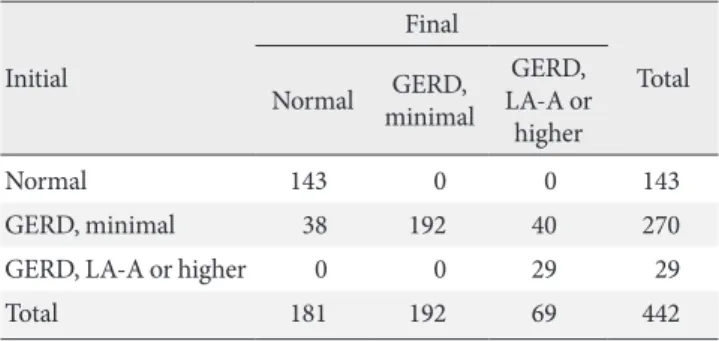
Table 1. Comparison of endoscopic GERD findings between initial decodes and final decodes (κ=0.703, P<0.001)
Initial
Final
Total Normal GERD,
minimal
GERD, LA-A or higher
Normal 143 0 0 143
GERD, minimal 38 192 40 270
GERD, LA-A or higher 0 0 29 29
Total 181 192 69 442
GERD, gastroesophageal reflux disease; LA-A, Los Angeles grade A.
Measurement of brachial-ankle pulse wave velocity
Brachial-ankle pulse wave velocity (baPWV) measurements were performed using our previously published method [15].
Left and right baPWVs were measured, and the largest value was defined as the maximum baPWV (max-baPWV) [15].
Diagnosis of cardiovascular autonomic neuropathy
The cardiovascular autonomic nervous function test was con- ducted using the DiCAN method (Medicore, Seoul, Korea), which was similar to the method used in our previous research [16]. Measurements included the heart rate change during a Valsalva maneuver, posture change, and repetitive exhalation and inhalation, as well as the blood pressure change during standing and grasping power injection. The scores for these five items were 0 for normal, 0.5 for borderline anomaly, and 1 for anomaly, where a score of 5 was defined as the maximum value. Any case with a total score over 1.5 was defined as hav- ing a cardiovascular autonomic nervous disease [16].
Diagnosis of peripheral neuropathy
All neurologic examinations were performed using our previ-
ously published algorithms [15]. The total symptom score (TSS) was based on the severity and frequency of pain, burning, par- esthesia, and numbness. Symptom scores were summed, and the TSSs ranged from 0 to 14.64 (Supplementary Table 3). A monofilament examination, ankle reflex test, and vibration test were performed to evaluate sensory function.
Patients with a TSS of at least 2 and who showed abnormal sensory function tests were defined as having probable pe- ripheral neuropathy. Patients who had symptoms or abnormal tests were defined as having possible peripheral neuropathy.
Statistical methods
Statistical analyses were performed using SPSS version 14.0 (SPSS Inc., Chicago, IL, USA). Data were expressed as mean±
standard error. An independent t-test or chi-square test was used to make comparisons between the groups. Continuous variables were tested with an independent t-test, and discrete variables were tested with a chi-square test. A P value less than 0.05 was considered statistically significant.
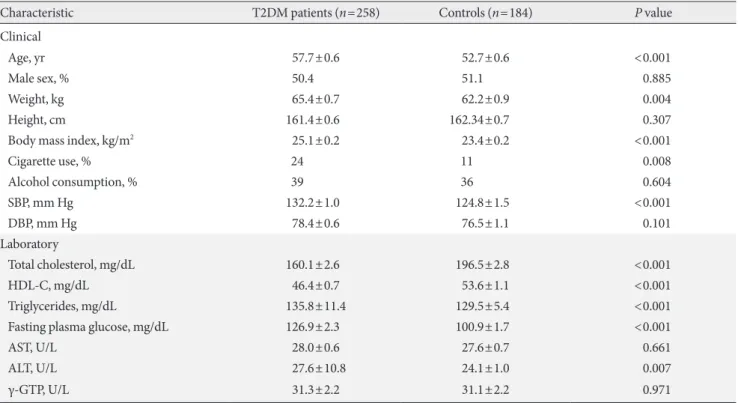
Table 2. Comparison of baseline characteristics between the two groups
Characteristic T2DM patients (n=258) Controls (n=184) P value
Clinical
Age, yr 57.7±0.6 52.7±0.6 <0.001
Male sex, % 50.4 51.1 0.885
Weight, kg 65.4±0.7 62.2±0.9 0.004
Height, cm 161.4±0.6 162.34±0.7 0.307
Body mass index, kg/m2 25.1±0.2 23.4±0.2 <0.001
Cigarette use, % 24 11 0.008
Alcohol consumption, % 39 36 0.604
SBP, mm Hg 132.2±1.0 124.8±1.5 <0.001
DBP, mm Hg 78.4±0.6 76.5±1.1 0.101
Laboratory
Total cholesterol, mg/dL 160.1±2.6 196.5±2.8 <0.001
HDL-C, mg/dL 46.4±0.7 53.6±1.1 <0.001
Triglycerides, mg/dL 135.8±11.4 129.5±5.4 <0.001
Fasting plasma glucose, mg/dL 126.9±2.3 100.9±1.7 <0.001
AST, U/L 28.0±0.6 27.6±0.7 0.661
ALT, U/L 27.6±10.8 24.1±1.0 0.007
γ-GTP, U/L 31.3±2.2 31.1±2.2 0.971
Values are presented as mean±standard error.
T2DM, type 2 diabetes mellitus; SBP, systolic blood pressure; DBP, diastolic blood pressure; HDL-C, high density lipoprotein cholesterol; AST, aspartate aminotransferase; ALT, alanine aminotransferase; γ-GTP, gamma-glutamyltranspeptidase.
RESULTS
Patient characteristics
A total of 442 participants were included in this study. The participants were divided into T2DM patients (n=258) and controls (n=184). The characteristics of each group are sum- marized in Table 2.
The mean age of patients was higher (57.7±0.6 years vs.
52.7±0.6 years, P<0.001), body mass index (BMI) was higher (25.1±0.2 vs. 23.4±0.2, P<0.001), and cigarette use was more frequent (24% vs. 11%, P=0.008) in the patient group. Systolic blood pressure was also higher (132.2±15.3 mm Hg vs.
124.8±14.1 mm Hg, P<0.001) in the patient group. Diastolic pressure was not significantly different between the two groups (78.4±8.9 mm Hg vs. 76.5±9.8 mm Hg, P=0.101).
Laboratory tests showed that total cholesterol (160.1±42.1 vs.
196.5±37.5, P<0.001) and high density lipoprotein cholester- ol (46.4±11.4 vs. 53.6±15.2, P<0.001) were lower and triglyc- erides (135.8±83.9 vs. 129.5±72.1, P<0.001) and fasting plas- ma glucose (126.9±37.2 vs. 100.9±20.4, P<0.001) were high- er in the T2DM patient group. No significant differences were noted in gender, weight, height, alcohol consumption, AST, ALT, or γ-GTP.
GERD and GERD symptoms
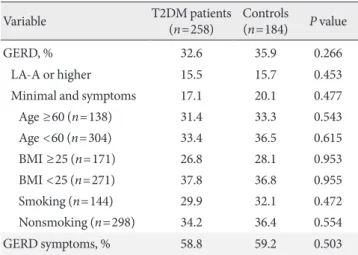
The prevalence of GERD showed no difference between the T2DM patient group and the control group (32.6% vs. 35.9%, P=0.266). In endoscopic diagnosis, LA grade A or higher in-
dicated no difference between the two groups either (15.5%
vs. 15.7%, P=0.453). Because of the significant differences in age, BMI, and cigarette use between the T2DM patient group and the control group, a Cochran-Mantel-Haenzel test was conducted using an age of 60, BMI of 25, and cigarette use.
However, the prevalence of GERD still showed no difference after the revision for risk factors such as age, BMI, and ciga- rette use, as shown in Table 3.
The prevalence of GERD symptoms also showed no signifi- cant difference between the two groups (58.8% vs. 59.2%, P=
0.503) (Table 3).
GERD group and non-GERD group
This study evaluated the differences in clinical characteristics between the GERD group (n=150) and the non-GERD group (n=292) (Table 4). No significant differences were noted be-
Table 3. Prevalence of GERD and GERD symptoms in T2DM patients and controls
Variable T2DM patients
(n=258) Controls
(n=184) P value
GERD, % 32.6 35.9 0.266
LA-A or higher 15.5 15.7 0.453
Minimal and symptoms 17.1 20.1 0.477
Age ≥60 (n=138) 31.4 33.3 0.543
Age <60 (n=304) 33.4 36.5 0.615
BMI ≥25 (n=171) 26.8 28.1 0.953
BMI <25 (n=271) 37.8 36.8 0.955
Smoking (n=144) 29.9 32.1 0.472
Nonsmoking (n=298) 34.2 36.4 0.554
GERD symptoms, % 58.8 59.2 0.503
GERD, gastroesophageal reflux disease; T2DM, type 2 diabetes mel- litus; LA-A, Los Angeles grade A; BMI, body mass index.
Table 4. Comparison of clinical characteristics between the GERD group and the non-GERD group
Characteristic GERD
(n=150) Non-GERD (n=292) P value Clinical
Age, yr 55.0±0.7 56.1±0.5 0.241
Male sex, % 58.7 51.0 0.639
Weight, kg 63.2±1.0 64.6±0.6 0.223
Height, cm 162.0±0.8 161.4±0.5 0.581
Body mass index, kg/m2 23.9±0.3 24.8±0.2 0.026
Cigarette use, % 16.0 21.0 0.227
Alcohol consumption, % 35.0 38.0 0.566
SBP, mm Hg 129.2±1.4 130.7±1.0 0.390
DBP, mm Hg 78.4±0.9 77.6±0.6 0.437
Laboratory
Total cholesterol, mg/dL 182.0±4.1 171.7±2.4 0.681
HDL-C, mg/dL 50.5±1.3 48.8±0.7 0.219
Triglycerides, mg/dL 157.8±19.5 120.5±3.9 0.013 Fasting plasma glucose,
mg/dL 115.6±2.8 118.2±2.2 0.483
AST, U/L 28.5±0.8 27.6±0.5 0.340
ALT, U/L 26.7±1.3 25.9±0.7 0.565
γ-GTP, U/L 35.3±3.7 29.2±1.5 0.069
Values are presented as mean±standard error.
GERD, gastroesophageal reflux disease; SBP, systolic blood pressure;
DBP, diastolic blood pressure; HDL-C, high density lipoprotein cho- lesterol; AST, aspartate aminotransferase; ALT, alanine aminotrans- ferase; γ-GTP, gamma-glutamyltranspeptidase.
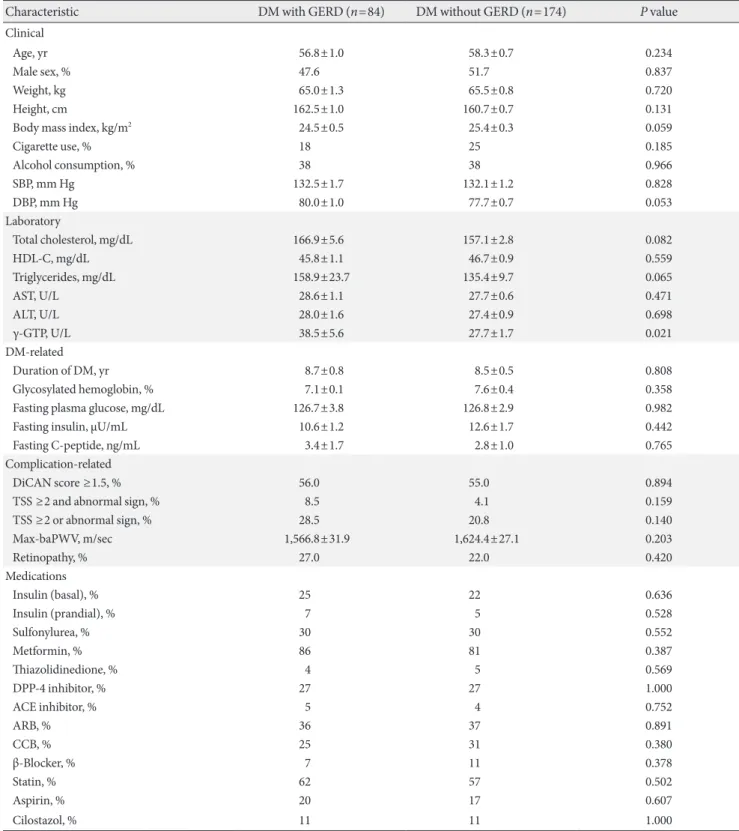
Table 5. Comparison of clinical characteristics between the GERD group and the non-GERD group in DM patients
Characteristic DM with GERD (n=84) DM without GERD (n=174) P value
Clinical
Age, yr 56.8±1.0 58.3±0.7 0.234
Male sex, % 47.6 51.7 0.837
Weight, kg 65.0±1.3 65.5±0.8 0.720
Height, cm 162.5±1.0 160.7±0.7 0.131
Body mass index, kg/m2 24.5±0.5 25.4±0.3 0.059
Cigarette use, % 18 25 0.185
Alcohol consumption, % 38 38 0.966
SBP, mm Hg 132.5±1.7 132.1±1.2 0.828
DBP, mm Hg 80.0±1.0 77.7±0.7 0.053
Laboratory
Total cholesterol, mg/dL 166.9±5.6 157.1±2.8 0.082
HDL-C, mg/dL 45.8±1.1 46.7±0.9 0.559
Triglycerides, mg/dL 158.9±23.7 135.4±9.7 0.065
AST, U/L 28.6±1.1 27.7±0.6 0.471
ALT, U/L 28.0±1.6 27.4±0.9 0.698
γ-GTP, U/L 38.5±5.6 27.7±1.7 0.021
DM-related
Duration of DM, yr 8.7±0.8 8.5±0.5 0.808
Glycosylated hemoglobin, % 7.1±0.1 7.6±0.4 0.358
Fasting plasma glucose, mg/dL 126.7±3.8 126.8±2.9 0.982
Fasting insulin, μU/mL 10.6±1.2 12.6±1.7 0.442
Fasting C-peptide, ng/mL 3.4±1.7 2.8±1.0 0.765
Complication-related
DiCAN score ≥1.5, % 56.0 55.0 0.894
TSS ≥2 and abnormal sign, % 8.5 4.1 0.159
TSS ≥2 or abnormal sign, % 28.5 20.8 0.140
Max-baPWV, m/sec 1,566.8±31.9 1,624.4±27.1 0.203
Retinopathy, % 27.0 22.0 0.420
Medications
Insulin (basal), % 25 22 0.636
Insulin (prandial), % 7 5 0.528
Sulfonylurea, % 30 30 0.552
Metformin, % 86 81 0.387
Thiazolidinedione, % 4 5 0.569
DPP-4 inhibitor, % 27 27 1.000
ACE inhibitor, % 5 4 0.752
ARB, % 36 37 0.891
CCB, % 25 31 0.380
β-Blocker, % 7 11 0.378
Statin, % 62 57 0.502
Aspirin, % 20 17 0.607
Cilostazol, % 11 11 1.000
Values are presented as mean±standard error.
GERD, gastroesophageal reflux disease; DM, diabetes mellitus; SBP, systolic blood pressure; DBP, diastolic blood pressure; HDL-C, high den- sity lipoprotein cholesterol; AST, aspartate aminotransferase; ALT, alanine aminotransferase; γ-GTP, gamma-glutamyltranspeptidase; TSS, to- tal symptom score; baPWV, brachial-ankle pulse wave velocity; DPP-4, dipeptidyl peptidase-4; ACE, angiotensin-converting enzyme; ARB, angiotensin receptor blocker; CCB, calcium channel blocker.
tween the two groups, which had similar rates of T2DM (56.0% vs. 60.0%, P=0.470), waist measurements (or circum- ferences; 82.2±8.9 cm vs. 84.1±9.2 cm, P=0.064), BMI (23.9±
0.3 vs. 24.8±0.2, P=0.026), rates of cigarette use (16.0% vs.
21.0%, P=0.227), and rates of alcohol consumption (35.0% vs.
38.0%, P=0.566). No differences were detected in blood pres- sure, fasting glucose levels, or lipid levels.
T2DM patients with GERD and T2DM patients without GERD
The study also evaluated the differences between T2DM pa- tients with GERD and T2DM patients without GERD (Table 5).
No significant differences were noted in clinical and labora- tory characteristics. The mean age (56.8±1.0 years vs. 58.3±0.7 years, P=0.234), BMI (24.5±0.5 vs. 25.4±0.3, P=0.059), and cigarette use (18% vs. 25%, P=0.185) showed no differences.
Systolic blood pressure (132.5±1.7 mm Hg vs. 132.1±1.2 mm Hg, P=0.828) and diastolic pressure (80.0±1.0 mm Hg vs.
77.7±0.7 mm Hg, P=0.053) were similar between the two groups. γ-GTP (38.5±5.6 mm Hg vs. 27.7±1.7 mm Hg, P=
0.021) was higher in the DM with GERD group, but alcohol consumption (38% vs. 38%, P=0.966) showed no difference.
The duration of DM (8.7±0.8 years vs. 8.5±0.5 years, P=
0.808), HbA1c levels (7.1%±0.1% vs. 7.6%±0.4%, P=0.358), and fasting C-peptide levels (3.4±1.7 ng/mL vs. 2.8±1.0 ng/
mL, P=0.765) showed no differences. Peripheral neuropathy was also not significantly different between the two groups (probable: 4.1% vs. 8.5%, P=0.159; possible: 28.5% vs. 20.8%, P=0.140). No differences were detected in the percentage of individual treatment drugs (insulin, sulfonylurea, metformin, thiazolidinedione, dipeptidyl peptidase-4 inhibitor, angioten- sin-converting enzyme inhibitor, angiotensin receptor block- er, calcium channel blocker, β-blocker, statin, aspirin, and ci- lostazol) between T2DM patients with GERD and T2DM pa- tients without GERD. The percentages of DiCAN scores rated 1.5 or higher, retinopathy, and max-baPWV also did not differ statistically.
DISCUSSION
The characteristic symptoms of heartburn or acid regurgita- tion are critical in the diagnosis of GERD. However, no specif- ic word exists in the Korean language that can precisely ex- press the characteristic “heartburn,” so the descriptions of symptoms by patients are very diverse. This complicates the
diagnosis of GERD based only on symptoms. GERD patients in Korea also frequently report accompanying atypical symp- toms, such as lung pain, throat irritation, and cough, and these symptoms sometimes manifest only in an atypical man- ner [17]. Hence, objective diagnosis of GERD is important, and this is accomplished in Korea by endoscopy, 24-hour esophageal pH monitoring, and the Bernstein test. Of these methods, endoscopy has very high specificity, at 96%, despite its low sensitivity of 62% to 68% [18]. Diagnosis can be accu- rate when erosion is observed, and the reliability of GERD di- agnosis can be high when correlated with the accompaniment of symptoms in cases of minimal change. In the present study, GERD was defined as LA grade A (or higher) or a minimal change with GERD symptoms.
T2DM has often been identified as a risk factor for GERD occurrence. A study conducted in the United States reported GERD symptoms in approximately 41% of patients with T2DM [9]. Research using a Korean population as a sample determined that 23.1% of T2DM patients complained of typi- cal GERD symptoms [19,20]. In other research, upper GI en- doscopy on DM patients who complained of gut symptoms re- vealed erosive esophagitis in 18% of the DM patients, which was a higher percentage than that seen in persons without DM [7]. A recent meta-analysis also reported a correlation between DM and GERD [21]; however, in the present study, the occur- rence rate of GERD of 32.6% in the T2DM group and 35.9% in the control group indicated no significant correlation between the presence of diabetes and GERD. Typical GERD symptoms showed a prevalence of 58.8% in the T2DM group and 59.2%
in the control group, again indicating no correlation.
Symptoms of GERD are also known risk factors for meta- bolic syndrome [22]. In fact, overweight or obesity is more commonly observed among T2DM patients. Some studies have indicated that overweight and obesity are also risk fac- tors for symptoms of GERD [11,23,24]. Waist measurements were compared in the present study, but no difference was ob- served between the GERD and non-GERD groups. Several studies have reported hypertension, dyslipidemia [22], and poor glycemic control [1] as significant factors for the pres- ence of GERD symptoms among T2DM patients. However, no significant differences were noted in blood pressure, lipid levels, fasting glucose level, and HbA1c between the GERD and non-GERD groups in the present study.
Patients with DM and neuropathy more frequently show GI symptoms when compared with DM patients without neu-
ropathy [11]. Recent research reported a higher prevalence of GERD symptoms among DM patients with neuropathy [9], whereas other research has argued that the existence of neu- ropathy is irrelevant to the GERD symptoms among DM pa- tients, as the prevalence of GERD showed no significant dif- ference between DM patients with neuropathy and DM pa- tients without neuropathy [25]. The present study confirmed that the presence of cardiovascular autonomic neuropathy and peripheral neuropathy in T2DM patients with GERD and T2DM patients without GERD did not affect the prevalence of GERD, with the results indicating similar percentages of TSS ≥2 and abnormal signs (8.5% vs. 4.1%, P=0.159), TSS ≥2 or abnormal signs (28.5% vs. 20.8%, P=0.140), and DiCAN scores of 1.5 or higher (56.0% vs. 55.0%, P=0.894).
The relaxation of the lower esophageal sphincter is held as one reason for GERD, and a variety of medicines are reported to influence this [26]. These medicines include beta-agonists, alpha-adrenergic antagonists, nitrates, calcium channel block- ers, anticholinergics, theophylline, morphine, meperidine, di- azepam, and barbiturates [26]. Many diabetes patients use calcium channel blockers as hypertension medicines. In this study, however, T2DM patients with GERD showed 25% and those without GERD showed 31% (P=0.380) using calcium channel blockers, indicating no significant difference.
This study was performed on patients who visited Busan St.
Mary’s Hospital for general checkups (including public corpo- ration checkups). In Korea, the National Health Insurance Service mandates that everyone over age 40 undergo upper gastrointestinography or EGD for the purpose of early diag- nosis of stomach cancer, regardless of the presence or absence of symptoms. However, the actual inspection rate for the early diagnosis of stomach cancer in 2009 was 41.3% [27], and 46.9% of the patients who received an early diagnosis of stom- ach cancer in 2005 visited the hospital for checkups because of the presence of physical symptoms [28], implying the possibil- ity that the test was performed on subjects that showed symp- toms. That is, the possibility of overestimation of the preva- lence and symptoms of GERD cannot be ruled out in the present study. The present study also has a limitation in that it could not check the factors that influence GERD occurrence, including drugs that affect gastric acid secretion (especially nonsteroidal anti-inflammatory drugs), life habits, and Helico- bacter pylori infection. However, the present study has the ad- vantage that every patient underwent EGD and the existence of neuropathy was confirmed through objective testing.
On balance, DM is an unlikely risk factor for GERD symp- toms and GERD occurrence. No significant correlation was observed between autonomic or peripheral neuropathy and GERD symptoms and occurrence. Further studies that con- trol for the major factors of GERD occurrence, such as diet and lifestyle, as well as H. pylori infection, will be necessary in the future.
CONFLICTS OF INTEREST
No potential conflict of interest relevant to this article was re- ported.
REFERENCES
1. Bytzer P, Talley NJ, Leemon M, Young LJ, Jones MP, Horowitz M. Prevalence of gastrointestinal symptoms associated with diabetes mellitus: a population-based survey of 15,000 adults.
Arch Intern Med 2001;161:1989-96.
2. Revicki DA, Wood M, Maton PN, Sorensen S. The impact of gastroesophageal reflux disease on health-related quality of life. Am J Med 1998;104:252-8.
3. Wahlqvist P. Symptoms of gastroesophageal reflux disease, perceived productivity, and health-related quality of life. Am J Gastroenterol 2001;96(8 Suppl):S57-61.
4. Vakil N, van Zanten SV, Kahrilas P, Dent J, Jones R; Global Consensus Group. The Montreal definition and classification of gastroesophageal reflux disease: a global evidence-based consensus. Am J Gastroenterol 2006;101:1900-20.
5. Dent J, El-Serag HB, Wallander MA, Johansson S. Epidemiol- ogy of gastro-oesophageal reflux disease: a systematic review.
Gut 2005;54:710-7.
6. Wong BC, Kinoshita Y. Systematic review on epidemiology of gastroesophageal reflux disease in Asia. Clin Gastroenterol Hepatol 2006;4:398-407.
7. Park KH, Yoon SB, Jo MH, Hong EK, Lee SJ, Jeong IK, Park CY, Oh KW, Kim HK, Yu JM, Kim DM, Lim SH, Choi MK, Yoo HJ, Park SW, Oh HY, Kim JB, Baek IH, Lee MS. Clinical characteristics and analysis of risk factor for gastroesophageal reflux disease in diabetic patient. J Korean Diabetes Assoc 2005;29:358-66.
8. Bytzer P, Talley NJ, Hammer J, Young LJ, Jones MP, Horowitz M. GI symptoms in diabetes mellitus are associated with both poor glycemic control and diabetic complications. Am J Gas- troenterol 2002;97:604-11.
9. Wang X, Pitchumoni CS, Chandrarana K, Shah N. Increased prevalence of symptoms of gastroesophageal reflux diseases in type 2 diabetics with neuropathy. World J Gastroenterol 2008;
14:709-12.
10. Kase H, Hattori Y, Sato N, Banba N, Kasai K. Symptoms of gastroesophageal reflux in diabetes patients. Diabetes Res Clin Pract 2008;79:e6-7.
11. Nishida T, Tsuji S, Tsujii M, Arimitsu S, Sato T, Haruna Y, Mi- yamoto T, Kanda T, Kawano S, Hori M. Gastroesophageal re- flux disease related to diabetes: analysis of 241 cases with type 2 diabetes mellitus. J Gastroenterol Hepatol 2004;19:258-65.
12. Lluch I, Ascaso JF, Mora F, Minguez M, Pena A, Hernandez A, Benages A. Gastroesophageal reflux in diabetes mellitus. Am J Gastroenterol 1999;94:919-24.
13. Lundell LR, Dent J, Bennett JR, Blum AL, Armstrong D, Galmiche JP, Johnson F, Hongo M, Richter JE, Spechler SJ, Tytgat GN, Wallin L. Endoscopic assessment of oesophagitis:
clinical and functional correlates and further validation of the Los Angeles classification. Gut 1999;45:172-80.
14. Kusano M, Shimoyama Y, Sugimoto S, Kawamura O, Maeda M, Minashi K, Kuribayashi S, Higuchi T, Zai H, Ino K, Hor- ikoshi T, Sugiyama T, Toki M, Ohwada T, Mori M. Develop- ment and evaluation of FSSG: frequency scale for the symp- toms of GERD. J Gastroenterol 2004;39:888-91.
15. Ha BK, Kim BG, Kim DH, Lee SI, Jung SM, Park JY, Lee CW, Kim SS, Kim BH, Kim IJ. Relationships between brachial-an- kle pulse wave velocity and peripheral neuropathy in type 2 diabetes. Diabetes Metab J 2012;36:443-51.
16. Bae YP, Yi BD, Kim BG, Park JH, Kwon YS, Park JY, Lee CW, Kim BH, Jang JS. Relationships between cardiac autonomic neuropathy and the brachial-ankle pulse wave velocity in pa- tients with type 2 diabetes. Endocrinol Metab 2011;26:44-52.
17. Lee SH, Choi MG, Park SH, Choi H, Moon SB, Choo KY, Wang JH, Kim JK, Choi KY, Chung KW, Sun HS. The clinical spectrum of gastroesophagel reflux disease in Korea. Korean J Gastrointest Motil 2000;6:1-10.
18. Richter JE. Diagnostic tests for gastroesophageal reflux dis-
ease. Am J Med Sci 2003;326:300-8.
19. Cho YS, Choi MG, Jeong JJ, Chung WC, Lee IS, Kim SW, Han SW, Choi KY, Chung IS. Prevalence and clinical spectrum of gastroesophageal reflux: a population-based study in Asan-si, Korea. Am J Gastroenterol 2005;100:747-53.
20. Jeong JJ, Choi MG, Cho YS, Lee SG, Oh JH, Park JM, Cho YK, Lee IS, Kim SW, Han SW, Choi KY, Chung IS. Chronic gastro- intestinal symptoms and quality of life in the Korean popula- tion. World J Gastroenterol 2008;14:6388-94.
21. Sun XM, Tan JC, Zhu Y, Lin L. Association between diabetes mellitus and gastroesophageal reflux disease: a meta-analysis.
World J Gastroenterol 2015;21:3085-92.
22. Hirata A, Kishida K, Nakatsuji H, Inoue K, Hiuge-Shimizu A, Funahashi T, Shimomura I. High prevalence of gastroesopha- geal reflux symptoms in type 2 diabetics with hypoadiponec- tinemia and metabolic syndrome. Nutr Metab (Lond) 2012;
9:4.
23. El-Serag HB, Graham DY, Satia JA, Rabeneck L. Obesity is an independent risk factor for GERD symptoms and erosive esophagitis. Am J Gastroenterol 2005;100:1243-50.
24. Nilsson M, Johnsen R, Ye W, Hveem K, Lagergren J. Obesity and estrogen as risk factors for gastroesophageal reflux symp- toms. JAMA 2003;290:66-72.
25. Lee SD, Keum B, Chun HJ, Bak YT. Gastroesophageal reflux disease in type II diabetes mellitus with or without peripheral neuropathy. J Neurogastroenterol Motil 2011;17:274-8.
26. Feldman M, Sleisenger MH, Friedman LS. Sleisenger &
Fordtran’s gastrointestinal and liver disease: pathophysiology, diagnosis, management. 7th ed. Philadelphia: W.B. Saunders;
2002. Chapter 33, Gastroesophageal reflux disease and its complications, including Barrett’s metaplasia; p599-622.
27. National Health Insurance Corporation. 2009 National health screening statistical yearbook. Seoul: National Health Insur- ance Corporation; 2010.
28. Kwak MS, Park EC, Bang JY, Sung NY, Lee JY, Choi KS. Fac- tors associated with cancer screening participation, Korea. J Prev Med Public Health 2005;38:473-81.
Supplementary Table 1. The Los Angeles classification of gastroesophageal reflux disease and minimal change
Grade Definition
Minimal change No mucosal breaks, but esophageal mucosal changes exist: erythema, whitish turbidity, edema, mucosal coarseness, mucosal friability, and blurring
LA-A One or more mucosal breaks no longer than 5 mm that do not extend between the tops of 2 mucosal folds LA-B One or more mucosal breaks more than 5 mm long that do not extend between the tops of 2 mucosal folds
LA-C One or more mucosal breaks that are continuous between the tops of 2 or more mucosal folds but which involve less than 75% of the circumference
LA-D One or more mucosal breaks which involves at least 75% of the esophageal circumference LA, Los Angeles grade.
Supplementary Table 2. The FSSG questionnaire
Question Fill-in space
Never Occasionally Sometimes Often Always
1 Do you get heartburn? 0 1 2 3 4
2 Does your stomach get bloated? 0 1 2 3 4
3 Does your stomach ever feel heavy after meals? 0 1 2 3 4
4 Do you sometimes subconsciously rub your chest with your hand? 0 1 2 3 4
5 Do you ever feel sick after meals? 0 1 2 3 4
6 Do you get heartburn after meals? 0 1 2 3 4
7 Do you have an unusual (e.g., burning) sensation in your throat? 0 1 2 3 4
8 Do you feel full while eating meals? 0 1 2 3 4
9 Do some things get stuck when you swallow? 0 1 2 3 4
10 Do you get bitter liquid (acid) coming up into your throat? 0 1 2 3 4
11 Do you burp a lot? 0 1 2 3 4
12 Do you get heartburn if you lean over? 0 1 2 3 4
Sum of points: [ ]+[ ]+[ ]+[ ]=[ ] (total points).
FSSG, frequency scale for the symptoms of gastroesophageal reflux disease.
Supplementary Table 3. Scoringa approach for neuropathic symptomsb included in the total symptom score
Symptom frequency Symptom intensity
Slight Moderate
Absent 0 0
Occasional 1.00 2.00
Frequent 1.33 2.33
Almost continuous 1.66 2.66
aScoring: total score 0 to 14.64, bPain, burning, paresthesia, numbness.