D I A B E T E S & M E T A B O L I S M J O U R N A L
This is an Open Access article distributed under the terms of the Creative Commons Attribution Non-Commercial License (http://creativecommons.org/licenses/by-nc/4.0/) which permits unrestricted non-commercial use, distribution, and reproduction in any medium, provided the original work is properly cited.
Serum Betatrophin Concentrations and the Risk of Incident Diabetes: A Nested Case-Control Study from Chungju Metabolic Disease Cohort
Seung-Hwan Lee1, Marie Rhee1, Hyuk-Sang Kwon2, Yong-Moon Park3, Kun-Ho Yoon1,4
1 Division of Endocrinology and Metabolism, Department of Internal Medicine, Seoul St. Mary’s Hospital, College of Medicine, The Catholic University of Korea, Seoul,
2 Division of Endocrinology and Metabolism, Department of Internal Medicine, Yeouido St. Mary’s Hospital, College of Medicine, The Catholic University of Korea, Seoul, Korea,
3Epidemiology Branch, National Institute of Environmental Health Sciences, National Institutes of Health, Research Triangle Park, NC, USA,
4Department of Medical Informatics, College of Medicine, The Catholic University of Korea, Seoul, Korea
Background: Betatrophin is a newly identified hormone derived from the liver and adipose tissue, which has been suggested to regulate glucose and lipid metabolism. Circulating levels of betatrophin are altered in various metabolic diseases, although the re- sults are inconsistent. We aimed to examine whether betatrophin is a useful biomarker in predicting the development of diabetes.
Methods: A nested case-control study was performed using a prospective Chungju Metabolic disease Cohort Study. During a 4-year follow-up period, we analyzed 167 individuals who converted to diabetes and 167 non-converters, who were matched by age, sex, and body mass index. Serum betatrophin levels were measured by an ELISA (enzyme-linked immunosorbent assay).
Results: Baseline serum betatrophin levels were significantly higher in the converter group compared to the non-converter group (1,315±598 pg/mL vs. 1,072±446 pg/mL, P<0.001). After adjusting for age, sex, body mass index, fasting plasma glucose, systolic blood pressure, total cholesterol, and family history of diabetes, the risk of developing diabetes showed a stepwise increase across the betatrophin quartile groups. Subjects in the highest baseline quartile of betatrophin levels had more than a threefold higher risk of incident diabetes than the subjects in the lowest quartile (relative risk, 3.275; 95% confidence interval, 1.574 to 6.814;
P=0.010). However, no significant relationships were observed between serum betatrophin levels and indices of insulin resistance or β-cell function.
Conclusion: Circulating levels of betatrophin could be a potential biomarker for predicting new-onset diabetes. Further studies are needed to understand the underlying mechanism of this association.
Keywords: Betatrophin; Biomarker; Case-control study; Risk
Corresponding author: Kun-Ho Yoon https://orcid.org/0000-0002-9109-2208 Division of Endocrinology and Metabolism, Department of Internal Medicine, Seoul St.
Mary’s Hospital, College of Medicine, The Catholic University of Korea, 222 Banpo- daero, Seocho-gu, Seoul 06591, Korea
E-mail: [email protected]
INTRODUCTION
With a steady increase in the prevalence and associated co- morbidities, diabetes has become one of the most significant socioeconomic burdens worldwide [1,2]. Due to the rising population at risk for diabetes [2,3], effective treatment and prevention measures have attracted much interest, recently.
Although blood glucose and glycosylated hemoglobin levels are powerful predictors of diabetes development, there have been considerable efforts to improve the prediction model us- ing several different biomarkers. However, few of these novel circulating and genetic biomarkers have proven valuable thus far [4,5]. From the pathophysiologic point of view, a compen- satory increase in pancreatic β-cell mass or function in re- https://doi.org/10.4093/dmj.2018.42.1.53
pISSN 2233-6079 · eISSN 2233-6087
sponse to insulin resistance precedes glucose intolerance [6].
In this context, biomarkers reflecting these processes may en- hance the identification of individuals in the subclinical stages of diabetes progression.
Dynamic cross-talk between organs is fundamental in main- taining metabolic homeostasis and in the process of develop- ing metabolic diseases [7]. Recently, a liver-derived β-cell growth factor has been suggested to induce β-cell proliferation against insulin resistant state in a liver-specific insulin receptor knockout mouse model [8]. Another study identified a liver and adipose tissue expressed hormone, betatrophin (also known as angiopoietin-like 8 [ANGPTL8], lipasin, TD26, and refeeding induced in fat and liver [RIFL]), which correlated with β-cell proliferation in the mouse model of pharmacologi- cally induced severe insulin resistance [9]. Identification of the hormone betatrophin led to various human studies, which aimed to elucidate its association with metabolic states includ- ing diabetes. Many studies have shown differences in the circu- lating levels of betatrophin in the context of diabetes, insulin resistance, obesity, metabolic syndrome, or dyslipidemia; how- ever, the results were inconclusive [10-28]. The relationship between circulating betatrophin concentrations and the risk of future diabetes is still unknown. Therefore, this study aimed to examine the predictive value of serum betatrophin levels in in- cident diabetes using a nested case-control design in a pro- spective cohort study.
METHODS
Study subjects
The Institutional Review Board at The Catholic University of Korea approved this study (No. KCMC070T076, KC14SI- SI0885) and written informed consent was obtained from all participants. The Chungju Metabolic disease Cohort (CMC) study is a community-based longitudinal study of metabolic diseases, including diabetes, metabolic syndrome, and osteo- porosis, in a population aged 40 years and over living in the rural area of Chungju, Korea [29,30]. A total of 334 districts were selected by stratified random cluster sampling, and par- ticipants were enrolled in the first phase of the study conduct- ed in 2003 to 2006. Follow-up of the participants occured ev- ery 4 years (the second phase in 2007 to 2010 and the third phase in 2011 to 2014). There were 2,624 individuals who par- ticipated in both the second and third phases of the study. The present study was a nested case-control study, using the second
phase as baseline and the third phase as follow-up. Among non-diabetic subjects at baseline, we identified 213 individuals (8.1%) who developed diabetes during the 4-year follow-up period. After excluding subjects lacking laboratory or anthro- pometric data and those without available serum samples, 167 individuals who developed diabetes were included in the anal- ysis. For each of these individuals, we selected an individual from the non-converter group with a 1:1 matching propensity scores. Controls were matched for age, sex, and body mass in- dex (BMI).
Study protocol
Investigators and survey personnel were trained in the study protocol prior to carrying out physical examinations and ad- ministering the questionnaire. Anthropometric measurements were performed with the participants wearing light clothing, and their height, weight, and waist circumference (WC) were measured to the nearest 0.1 cm and 0.1 kg per standardized methods. Blood pressure (BP) was measured twice on the right upper arm while the subjects were in a seated position after 5 minutes of rest, and the average was recorded. Hypertension was defined on the basis of the Joint National Committee 7 re- port as ≥140 (systolic BP)/90 (diastolic BP) mm Hg or when the subjects reported using antihypertensive medications. De- tailed data on the lifestyle behavior and medical history of the participants were obtained by interview, and included inquier- ies concerning the subjects’ alcohol consumption (yes/no) and cigarette smoking (none, ex-smoker, or current smoker). Reg- ular exercise was defined as three or more times per week for at least 30 minutes per session.
Biochemical assays and calculations
Blood samples were collected after the participants had fasted overnight for at least 12 hours and analyzed at a central labora- tory (Neodin Medical Institute, Seoul, Korea). Fasting plasma glucose (FPG) was measured using the hexokinase method, and serum creatinine was measured using an enzymatic meth- od. Estimated glomerular filtration rate (eGFR) was calculated using the abbreviated Modification of Diet in Renal Disease formula: 175×serum Cr (mg/dL)–1.154×Age (yr)–0.203×(0.742 if female). Serum total cholesterol (TC) and triglycerides (TG) were measured using enzymatic colorimetric tests. High den- sity lipoprotein cholesterol was measured using a selective in- hibition method, and low density lipoprotein cholesterol was calculated using the Friedewald formula. Serum high-sensitiv-
ity C-reactive protein levels were measured using a particle en- hanced immunoturbidometric assay. Serum insulin levels were measured using a radioimmunoassay kit (Izotop, Budapest, Hungary), and the intra- and inter-assay coefficient of variance (CV) were <5%. The homeostasis model assessment estimate of β-cell function (HOMA-β) and insulin resistance (HOMA- IR) were calculated using the following formulae: 20×fasting insulin (mIU/L)/[FPG (mmol/L)–3.5] and FPG (mmol/L)×
fasting insulin (mIU/L)/22.5, respectively. Serum betatrophin levels were determined using a commercially available human enzyme-linked immunosorbent assay (ELISA) kit (Wuhan EIAab Science, Wuhan, China; Catalog No. E11644h) per the manufacturer’s instructions. The intra- and inter-assay CV were 7% and 12%, respectively.
Definition of diabetes mellitus and metabolic syndrome Diabetes and prediabetes (impaired fasting glucose and/or im- paired glucose tolerance) were defined according to the Amer- ican Diabetes Association criteria. In the early period of the baseline study, an oral glucose tolerance test (OGTT) was per- formed if the FPG level exceeded 5.6 mmol/L. Beginning in September 2009, however, every participant underwent an OGTT, regardless of their FPG level. Every participant also underwent an OGTT for the diagnosis of glucose tolerance status during the follow-up period. Metabolic syndrome was defined using the American Heart Association/National Heart, Lung and Blood Institute criteria with modification of the WC value according to the World Health Organization–Asian Pa- cific region criteria for abdominal obesity as previously de- scribed [30].
Statistical analysis
Data are expressed as the mean±standard deviation (SD), as medians (interquartile range) or as proportions. The charac- teristics of the subgroups were compared using Student t-tests, chi-squared tests or analysis of variance using the general lin- ear model (GLM) procedure. Spearman’s correlation analysis was used to examine the relationships between serum betatro- phin concentrations and other parameters. A log-binomial re- gression model using the GENMOD procedure was per- formed to calculate the relative risk (RR) of serum betatrophin in predicting the development of diabetes. The variables with significant difference between non-converter and converter at baseline or known risk factors of diabetes were selected as co- variates. RR and 95% confidence interval values of incident di-
abetes for the second through fourth quartiles were calculated using the lowest quartile as the reference category. All statisti- cal analyses were performed using SAS software version 9.4 (SAS Institute Inc., Cary, NC, USA). A P value <0.05 was con- sidered significant.
RESULTS
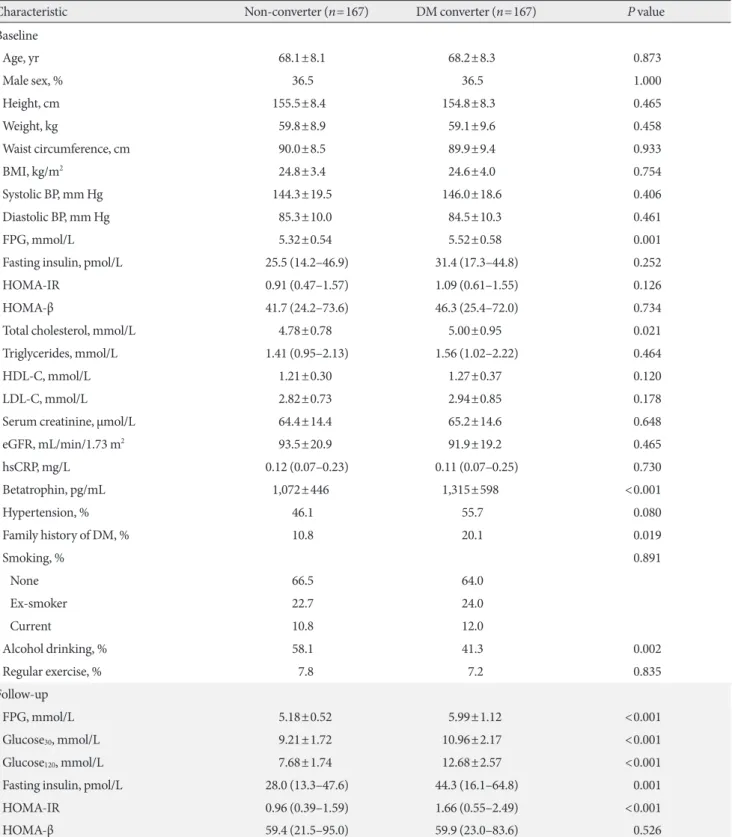
The mean age and BMI were 69.7±7.4 years and 22.9±2.9 kg/m2 for men and 67.3±8.5 years and 25.7±3.4 kg/m2 for women, respectively. Table 1 shows a comparison of participant charac- teristics according to their glucose tolerance status at follow- up. At baseline, the subjects who had converted to diabetes had significantly higher levels of FPG and TC and a higher per- centage of family history of diabetes compared to the non-con- verter group. Serum insulin levels, HOMA-IR, and HOMA-β were not significantly different between the two groups. At fol- low-up, the glucose levels obtained from OGTT, fasting insulin levels, and HOMA-IR were significantly higher in the convert- er group.
Table 2 shows the mean betatrophin concentrations accord- ing to the baseline characteristic subgroups. Serum betatro- phin concentrations were significantly higher in older, men, non-obese, non-abdominally obese, and hypertensive subjects compared to their counterparts. There were no significant dif- ferences between the subgroups according to metabolic syn- drome, TG levels, eGFR, alcohol drinking, or the degree of in- sulin resistance. We calculated correlation coefficients between baseline serum betatrophin concentrations and glucose pa- rameters in the baseline and during the follow-up period. At baseline, there were no significant correlations between be- tatrophin levels and FPG or insulin levels. Betatrophin levels were positively correlated with glucose levels at 120 minutes after OGTT (r=0.201, P<0.001) and negatively correlated with insulin levels at 30 minutes after OGTT (r=–0.187, P=0.006) at follow-up. However, no significant relationships were ob- served between betatrophin levels and HOMA-IR, HOMA-β or insulin/glucose ratio. The correlation between betatrophin levels and lipid profiles was also insignificant.
Baseline serum betatrophin levels were significantly higher in the converter group than in the non-converter group (1,315±
598 pg/mL vs. 1,072±446 pg/mL, P<0.001). When subgroup analyses were performed, significant differences in betatrophin levels between the non-converter and converter groups were noted in both subjects <70 years of age (909±368 pg/mL vs.
Table 1. Characteristics of participants according to their diabetes status at follow-up
Characteristic Non-converter (n=167) DM converter (n=167) P value
Baseline
Age, yr 68.1±8.1 68.2±8.3 0.873
Male sex, % 36.5 36.5 1.000
Height, cm 155.5±8.4 154.8±8.3 0.465
Weight, kg 59.8±8.9 59.1±9.6 0.458
Waist circumference, cm 90.0±8.5 89.9±9.4 0.933
BMI, kg/m2 24.8±3.4 24.6±4.0 0.754
Systolic BP, mm Hg 144.3±19.5 146.0±18.6 0.406
Diastolic BP, mm Hg 85.3±10.0 84.5±10.3 0.461
FPG, mmol/L 5.32±0.54 5.52±0.58 0.001
Fasting insulin, pmol/L 25.5 (14.2–46.9) 31.4 (17.3–44.8) 0.252
HOMA-IR 0.91 (0.47–1.57) 1.09 (0.61–1.55) 0.126
HOMA-β 41.7 (24.2–73.6) 46.3 (25.4–72.0) 0.734
Total cholesterol, mmol/L 4.78±0.78 5.00±0.95 0.021
Triglycerides, mmol/L 1.41 (0.95–2.13) 1.56 (1.02–2.22) 0.464
HDL-C, mmol/L 1.21±0.30 1.27±0.37 0.120
LDL-C, mmol/L 2.82±0.73 2.94±0.85 0.178
Serum creatinine, μmol/L 64.4±14.4 65.2±14.6 0.648
eGFR, mL/min/1.73 m2 93.5±20.9 91.9±19.2 0.465
hsCRP, mg/L 0.12 (0.07–0.23) 0.11 (0.07–0.25) 0.730
Betatrophin, pg/mL 1,072±446 1,315±598 <0.001
Hypertension, % 46.1 55.7 0.080
Family history of DM, % 10.8 20.1 0.019
Smoking, % 0.891
None 66.5 64.0
Ex-smoker 22.7 24.0
Current 10.8 12.0
Alcohol drinking, % 58.1 41.3 0.002
Regular exercise, % 7.8 7.2 0.835
Follow-up
FPG, mmol/L 5.18±0.52 5.99±1.12 <0.001
Glucose30, mmol/L 9.21±1.72 10.96±2.17 <0.001
Glucose120, mmol/L 7.68±1.74 12.68±2.57 <0.001
Fasting insulin, pmol/L 28.0 (13.3–47.6) 44.3 (16.1–64.8) 0.001
HOMA-IR 0.96 (0.39–1.59) 1.66 (0.55–2.49) <0.001
HOMA-β 59.4 (21.5–95.0) 59.9 (23.0–83.6) 0.526
Values are presented as mean±standard deviation or median (interquartile range).
DM, diabetes mellitus; BMI, body mass index; BP, blood pressure; FPG, fasting plasma glucose; HOMA-IR, homeostasis model assessment of insulin resistance; HOMA-β, homeostasis model assessment estimate of β-cell function; HDL-C, high density lipoprotein cholesterol; LDL-C, low density lipoprotein cholesterol; eGFR, estimated glomerular filtration rate; hsCRP, high-sensitivity C-reactive protein.
1,225±657 pg/mL, P<0.001) and ≥70 years of age (1,250±
456 pg/mL vs. 1,405±520 pg/mL, P=0.045), men (1,124±428 pg/mL vs. 1,591±707 pg/mL, P<0.001), and non-obese (1,057±
409 pg/mL vs. 1,473±651 pg/mL, P<0.001) groups, but not in women or obese groups (Fig. 1). However, when the non-con-
verter group was further divided into normal glucose tolerance (NGT) and prediabetes groups, a significant stepwise increase in baseline serum betatrophin levels were observed in both men (NGT, 1,103±419 pg/mL; prediabetes, 1,143±441 pg/mL;
diabetes converter, 1,591±707 pg/mL; P for trend <0.001) and women (NGT, 939±409 pg/mL; prediabetes, 1,096±471 pg/mL;
diabetes converter, 1,155±458 pg/mL; P for trend=0.018) (Fig. 2).
To evaluate the role of serum betatrophin in predicting the development of diabetes, we performed log-binomial regres- sion analyses (Table 3). In the crude analysis, there was a statis- tically significant association between higher betatrophin con- centrations and an increased risk of incident diabetes. After adjusting for age, sex, and BMI (model 1) and further adjusting for fasting glucose, systolic BP, TC, and family history of diabe- tes (model 2), this association remained significant. These re- sults suggest that subjects with serum betatrophin concentra- tions in the highest quartile have more than a threefold in- creased risk of developing diabetes in the future.
DISCUSSION
In this nested case-control study from a population-based pro- spective cohort, we found that baseline serum betatrophin lev- els were significantly higher in the diabetes converter group compared to the non-converter group. There was a stepwise increase in the risk of developing diabetes according to the se- rum betatrophin levels. After 4 years of follow-up, subjects in the highest baseline quartile of betatrophin levels had more than a threefold higher risk of incident diabetes than the sub- jects in the lowest quartile. Our findings indicate a possible role of circulating betatrophin as an additional biomarker for identifying individuals at high risk of developing diabetes.
‘Betatrophin’ was first named by the Melton group [9]. Mi- croarray analysis of mouse liver treated with S961, a peptide that binds to insulin receptors and antagonizes insulin signal- ing, identified an upregulated gene which they called betatro- phin. Betatrophin mRNA was expressed in mouse liver and adipose tissue, whereas liver was the primary organ that ex- pressed betatrophin in human. They also showed that betatro- phin encodes a liver-secreted protein leading to pancreatic β-cell proliferation, β-cell mass expansion, and improved glu- cose tolerance in mice. Although this attractive finding caught attention as a possible candidate of regenerative therapy for di- abetes, subsequent studies strongly argued the effect of be- tatrophin in similar settings [31-34]. ANGPTL8-deficient mice Table 2. Serum betatrophin concentrations according to char-
acteristics of participants
Characteristic No. Mean±SD, pg/mL P value
Age, yra <0.001
<70 171 1,064±552
≥70 163 1,329±494
Sex <0.001
Men 122 1,358±627
Women 212 1,099±459
BMI, kg/m2 0.009
<25 175 1,266±581
≥25 159 1,113±480
WC, cm 0.032
<80 (W), 90 (M) 49 1,347±583 ≥80 (W), 90 (M) 285 1,167±529
Metabolic syndrome 0.130
No 115 1,255±532
Yes 219 1,161±543
Triglycerides, mmol/L 0.274
<1.69 194 1,220±576
≥1.69 140 1,156±487
eGFR, mL/min/1.73 m2 0.124
<60 12 1,429±490
≥60 322 1,185±541
Hypertension 0.026
No 164 1,126±527
Yes 170 1,258±547
Alcohol drinking 0.625
No 168 1,208±481
Yes 166 1,179±596
HOMA-IRa 0.142
<1.0 182 1,233±541
≥1.0 152 1,146±537
BMI, body mass index; WC, waist circumference; W, women; M, men;
eGFR, estimated glomerular filtration rate; HOMA-IR, homeostasis model assessment of insulin resistance.
aSubgroups were divided according to the approximate mean or me- dian value of the study population.
Fig. 1. Baseline serum be- tatrophin levels according to diabetes status at follow-up in the total population (A), men (B), women (C), <70 years- old (D), ≥70 years-old (E), non-obese (F), and obese (G) group. DM, diabetes mellitus.
5,000 4,000 3,000 2,000 1,000 0
5,000 4,000 3,000 2,000 1,000 0
5,000 4,000 3,000 2,000 1,000 0
5,000 4,000 3,000 2,000 1,000 0
5,000 4,000 3,000 2,000 1,000 0
5,000 4,000 3,000 2,000 1,000 0
5,000 4,000 3,000 2,000 1,000
SerSerphin (pg/mL)roatetum bphin (pg/mL)roatetum b um bphin (pg/mL)roatetSerphin (pg/mL)roatetum bSer Serphin (pg/mL)roatetum batphin (pg/mL)roetum bSer atrophin (pg/mL)etum bSer 0
Non-converter
Non-converter
Non-converter
Non-converter
Non-converter
Non-converter
Non-converter DM co
nverter
DM co nverter
DM co nverter
DM co nverter
DM co nverter
DM co nverter
DM co nverter Total population
Age ≥70
Men
Non-obese
Women
Obese
Age <70 P<0.001
P=0.045
P<0.001
P<0.001
P=0.073
P=0.525
P<0.001
A
E
B
F
C
G
D
Fig. 2. Baseline serum betatrophin levels according to glucose tolerance status at follow-up in the total population (A), men (B), and women (C). NGT, normal glucose tolerance; Pre-DM, prediabetes mellitus; DM, diabetes mellitus.
5,000 4,000 3,000 2,000 1,000 0
5,000 4,000 3,000 2,000 1,000 0
5,000 4,000 3,000 2,000 1,000
um betatrophin (pg/mL)Ser etSerum batrophin (pg/mL) atrophin (pg/mL)etum bSer 0
Pre-D M
Pre-D M
Pre-D NGT M
NGT
NGT DM co
nverter
DM co nverter
DM co nverter
Total population Men Women
P<0.001 P<0.001 P=0.018
A B C
showed normal β-cell expansion in response to insulin resis- tance and no alterations in glucose homeostasis [31,32]. Fur- thermore, ANGPTL8 overexpression did not increase β-cell replication in mice [32,34]. The effect of S961 treatment, which induces betatrophin gene expression and β-cell replication in mice, was not replicated in human β-cells [33]. A recent study with a different approach examined the effect of betatrophin- overexpressed adipose-derived mesenchymal stem cells and demonstrated that co-culture of human islets with these cells increased islet proliferation and insulin secretion [35]. Al- though the role of betatrophin is still being debated, the origi- nal article by the Melton group was recently retracted due to a lack of reproducibility.
Despite dissapointing observations in animal studies, many association studies in humans suggest a possible role of be- tatrophin in glucose and lipid metabolism. Circulating betatro- phin levels were generally higher in metabolically disturbed states, such as type 1 diabetes mellitus [10,21], type 2 diabetes mellitus (T2DM) [11,13,15-18,21,22,24,25,36], overweight [19] or obesity [23], metabolic syndrome [37], and nonalco- holic fatty liver disease [38]. However, contradictory results were also reported with either no difference or lower levels of betatrophin in subjects with T2DM, obesity, and dyslipidemia when compared to control groups [12,14,19,26]. Correlation analyses between circulating betatrophin levels and clinical parameters in various studies also yielded inconsistent results.
The role of betatrophin in TG metabolism is evidenced by pre- clinical studies. Overexpression of betatrophin in the liver in- creased TG levels, whereas knockout mice had lower TG lev- els, which was linked to lipoprotein lipase activity [31,32,39].
In humans, several investigations showed a positive correlation between serum betatrophin and TG levels [16,18,21], while we and others [10] found no such relationship. Whether betatro-
phin levels are associated with insulin resistance or β-cell func- tion is also a matter of debate. Our results showed no correla- tion, which is in line with several studies [12,16,27], while oth- er studies suggested either a positive correlation with the insu- lin resistance index [17,19] or a negative correlation with insu- lin secretory capacity [20].
The reason for these inconsistencies remains unclear. A me- ta-analysis suggested a possible difference in the relationship between betatrophin levels and T2DM according to ethnicity [28]. Different ELISA kits, which use antibodies against the N- terminus or C-terminus of betatrophin, detect either the full- length form or both the full-length and the cleaved form, re- spectively [40]. Although it is unclear which form of betatro- phin is functional and how the proteolytic cleavage is con- trolled, it should be noted that use of different ELISA kits could lead to contrasting results. The inconsistency among studies might also arise from the small number of samples with differ- ent clinical characteristics or selection bias. Because the meth- ods used to measure the degree of insulin resistance in previ- ous studies were not the gold standard, further studies using more precise methods and a larger study population are need- ed to draw definitive conclusions.
To the best of our knowledge, our analysis is the first pro- spective study to examine the predictive value of betatrophin levels in identifying subjects at high-risk of developing diabe- tes. In another prospective study, Wang et al. [27] observed that the baseline betatrophin levels were inversely correlated with incident metabolic syndrome in 153 chinese adults after a 3.5-year follow-up. Interestingly, the odds ratio for high blood glucose (≥5.6 mmol/L) component was significantly lower in subjects with three higher quartiles of betatrophin when com- pared to the lowest quartile group in men, but not in women.
Some limitations should be acknowledged. Because our co- Table 3. Risk of developing diabetes according to quartiles of serum betatrophin concentrations
No. of converter (%) Crude Model 1a Model 2b
Q1 33 (39.8) 1 (reference) 1 (reference) 1 (reference)
Q2 37 (44.1) 1.193 (0.645–2.207) 1.301 (0.690–2.452) 1.362 (0.698–2.657)
Q3 46 (55.4) 1.884 (1.016–3.491) 2.167 (1.122–4.183) 2.063 (1.036–4.107)
Q4 51 (60.7) 2.342 (1.259–4.355) 2.854 (1.427–5.708) 3.275 (1.574–6.814)
P value 0.023 0.025 0.012 0.010
Values are presented as relative risks (95% confidence interval).
aModel 1: Adjusted for age, sex, and body mass index, bModel 2: Adjusted for model 1+fasting glucose, systolic blood pressure, total cholesterol, and family history of diabetes.
hort consisted mainly of middle aged or elderly Koreans, the ability to generalize these findings to other populations of dif- ferent ages and ethnicities is limited. In particular, several stud- ies revealed a positive correlation between betatrophin levels and age [15,16,21,27]. Furthermore, the type of diabetes could not be determined due to the lack of C-peptide or autoanti- body data, but we assume that the majority of the cases would be T2DM based on the age of the study population. Lastly, the HOMA index is limited in its ability to precisely reflect the de- gree of insulin resistance and β-cell function, although it is practical for large epidemiologic studies.
In conclusion, we propose that the circulating level of be- tatrophin could be a potential biomarker for predicting new- onset diabetes. Further studies are needed to understand the underlying mechanism of this association and to resolve re- maining contradictory issues.
CONFLICTS OF INTEREST
This study was supported by the grants from Yuhan Co.
through the Catholic Medical Center Research Foundation.
The funder had no role in study design, data collection and analysis, decision to publish, or preparation of the manuscript.
ACKNOWLEDGEMENTS
The authors wish to thank all the team members and survey personnel of the Chungju Metabolic disease Cohort study and the officers in Chungju Health Center for continued support.
REFERENCES
1. Koo BK, Moon MK. Are we in the same risk of diabetes melli- tus? Gender- and age-specific epidemiology of diabetes in 2001 to 2014 in the Korean population. Diabetes Metab J 2016;40:
175-81.
2. Chen L, Magliano DJ, Zimmet PZ. The worldwide epidemiolo- gy of type 2 diabetes mellitus: present and future perspectives.
Nat Rev Endocrinol 2011;8:228-36.
3. Tabak AG, Herder C, Rathmann W, Brunner EJ, Kivimaki M.
Prediabetes: a high-risk state for diabetes development. Lancet 2012;379:2279-90.
4. Herder C, Kowall B, Tabak AG, Rathmann W. The potential of novel biomarkers to improve risk prediction of type 2 diabetes.
Diabetologia 2014;57:16-29.
5. Echouffo-Tcheugui JB, Dieffenbach SD, Kengne AP. Added value of novel circulating and genetic biomarkers in type 2 dia- betes prediction: a systematic review. Diabetes Res Clin Pract 2013;101:255-69.
6. Cho JH, Kim JW, Shin JA, Shin J, Yoon KH. β-Cell mass in people with type 2 diabetes. J Diabetes Investig 2011;2:6-17.
7. Shirakawa J, De Jesus DF, Kulkarni RN. Exploring inter-organ crosstalk to uncover mechanisms that regulate β-cell function and mass. Eur J Clin Nutr 2017;71:896-903.
8. El Ouaamari A, Kawamori D, Dirice E, Liew CW, Shadrach JL, Hu J, Katsuta H, Hollister-Lock J, Qian WJ, Wagers AJ, Kulkar- ni RN. Liver-derived systemic factors drive β cell hyperplasia in insulin-resistant states. Cell Rep 2013;3:401-10.
9. Yi P, Park JS, Melton DA. Betatrophin: a hormone that controls pancreatic β cell proliferation. Cell 2013;153:747-58. Retrac- tion in: Yi P, Park JS, Melton DA. Retraction notice to: betatro- phin: a hormone that controls pancreatic β cell proliferation.
Cell 2017;168:326.
10. Espes D, Lau J, Carlsson PO. Increased circulating levels of be- tatrophin in individuals with long-standing type 1 diabetes.
Diabetologia 2014;57:50-3.
11. Espes D, Martinell M, Carlsson PO. Increased circulating be- tatrophin concentrations in patients with type 2 diabetes. Int J Endocrinol 2014;2014:323407.
12. Fenzl A, Itariu BK, Kosi L, Fritzer-Szekeres M, Kautzky-Willer A, Stulnig TM, Kiefer FW. Circulating betatrophin correlates with atherogenic lipid profiles but not with glucose and insulin levels in insulin-resistant individuals. Diabetologia 2014;57:
1204-8.
13. Fu Z, Berhane F, Fite A, Seyoum B, Abou-Samra AB, Zhang R.
Elevated circulating lipasin/betatrophin in human type 2 dia- betes and obesity. Sci Rep 2014;4:5013.
14. Gomez-Ambrosi J, Pascual E, Catalan V, Rodriguez A, Ramirez B, Silva C, Gil MJ, Salvador J, Fruhbeck G. Circulating betatro- phin concentrations are decreased in human obesity and type 2 diabetes. J Clin Endocrinol Metab 2014;99:E2004-9.
15. Hu H, Sun W, Yu S, Hong X, Qian W, Tang B, Wang D, Yang L, Wang J, Mao C, Zhou L, Yuan G. Increased circulating levels of betatrophin in newly diagnosed type 2 diabetic patients. Dia- betes Care 2014;37:2718-22.
16. Abu-Farha M, Abubaker J, Al-Khairi I, Cherian P, Noronha F, Hu FB, Behbehani K, Elkum N. Higher plasma betatrophin/
ANGPTL8 level in type 2 diabetes subjects does not correlate with blood glucose or insulin resistance. Sci Rep 2015;5:10949.
17. Chen X, Lu P, He W, Zhang J, Liu L, Yang Y, Liu Z, Xie J, Shao S,
Du T, Su X, Zhou X, Hu S, Yuan G, Zhang M, Zhang H, Liu L, Wang D, Yu X. Circulating betatrophin levels are increased in patients with type 2 diabetes and associated with insulin resis- tance. J Clin Endocrinol Metab 2015;100:E96-100.
18. Gao T, Jin K, Chen P, Jin H, Yang L, Xie X, Yang M, Hu C, Yu X.
Circulating betatrophin correlates with triglycerides and post- prandial glucose among different glucose tolerance statuses: a case-control study. PLoS One 2015;10:e0133640.
19. Guo K, Lu J, Yu H, Zhao F, Pan P, Zhang L, Chen H, Bao Y, Jia W. Serum betatrophin concentrations are significantly in- creased in overweight but not in obese or type 2 diabetic indi- viduals. Obesity (Silver Spring) 2015;23:793-7.
20. Tokumoto S, Hamamoto Y, Fujimoto K, Yamaguchi E, Oka- mura E, Honjo S, Ikeda H, Wada Y, Hamasaki A, Koshiyama H. Correlation of circulating betatrophin concentrations with insulin secretion capacity, evaluated by glucagon stimulation tests. Diabet Med 2015;32:653-6.
21. Yamada H, Saito T, Aoki A, Asano T, Yoshida M, Ikoma A, Ku- saka I, Toyoshima H, Kakei M, Ishikawa SE. Circulating be- tatrophin is elevated in patients with type 1 and type 2 diabetes.
Endocr J 2015;62:417-21.
22. Yi M, Chen RP, Yang R, Guo XF, Zhang JC, Chen H. Betatro- phin acts as a diagnostic biomarker in type 2 diabetes mellitus and is negatively associated with HDL-cholesterol. Int J Endo- crinol 2015;2015:479157.
23. Abu-Farha M, Sriraman D, Cherian P, AlKhairi I, Elkum N, Behbehani K, Abubaker J. Circulating ANGPTL8/betatrophin is increased in obesity and reduced after exercise training.
PLoS One 2016;11:e0147367.
24. Al-Daghri NM, Rahman S, Sabico S, Amer OE, Wani K, Ansa- ri MG, Al-Attas OS, Kumar S, Alokail MS. Circulating betatro- phin in healthy control and type 2 diabetic subjects and its as- sociation with metabolic parameters. J Diabetes Complications 2016;30:1321-5.
25. Chen CC, Susanto H, Chuang WH, Liu TY, Wang CH. Higher serum betatrophin level in type 2 diabetes subjects is associated with urinary albumin excretion and renal function. Cardiovasc Diabetol 2016;15:3.
26. Gomez-Ambrosi J, Pascual-Corrales E, Catalan V, Rodriguez A, Ramirez B, Romero S, Vila N, Ibanez P, Margall MA, Silva C, Gil MJ, Salvador J, Fruhbeck G. Altered concentrations in dyslipidemia evidence a role for ANGPTL8/betatrophin in lip- id metabolism in humans. J Clin Endocrinol Metab 2016;101:
3803-11.
27. Wang H, Lai Y, Han C, Liu A, Fan C, Wang H, Zhang H, Ding S,
Teng W, Shan Z. The effects of serum ANGPTL8/betatrophin on the risk of developing the metabolic syndrome: a prospec- tive study. Sci Rep 2016;6:28431.
28. Yue S, Wu J, Zhang J, Liu L, Chen L. The relationship between betatrophin levels in blood and T2DM: a systematic review and meta-analysis. Dis Markers 2016;2016:9391837.
29. Lee SH, Rhee M, Yang HK, Ha HS, Lee JH, Kwon HS, Park YM, Yim HW, Kang MI, Lee WC, Son HY, Yoon KH. Serum preadipocyte factor 1 concentrations and risk of developing di- abetes: a nested case-control study. Diabet Med 2016;33:631-8.
30. Lee SH, Yang HK, Ha HS, Lee JH, Kwon HS, Park YM, Yim HW, Kang MI, Lee WC, Son HY, Yoon KH. Changes in meta- bolic health status over time and risk of developing type 2 dia- betes: a prospective cohort study. Medicine (Baltimore) 2015;
94:e1705.
31. Wang Y, Quagliarini F, Gusarova V, Gromada J, Valenzuela DM, Cohen JC, Hobbs HH. Mice lacking ANGPTL8 (Betatro- phin) manifest disrupted triglyceride metabolism without im- paired glucose homeostasis. Proc Natl Acad Sci U S A 2013;
110:16109-14.
32. Gusarova V, Alexa CA, Na E, Stevis PE, Xin Y, Bonner-Weir S, Cohen JC, Hobbs HH, Murphy AJ, Yancopoulos GD, Groma- da J. ANGPTL8/betatrophin does not control pancreatic beta cell expansion. Cell 2014;159:691-6.
33. Jiao Y, Le Lay J, Yu M, Naji A, Kaestner KH. Elevated mouse hepatic betatrophin expression does not increase human β-cell replication in the transplant setting. Diabetes 2014;63:1283-8.
34. Cox AR, Lam CJ, Bonnyman CW, Chavez J, Rios JS, Kushner JA. Angiopoietin-like protein 8 (ANGPTL8)/betatrophin over- expression does not increase beta cell proliferation in mice. Di- abetologia 2015;58:1523-31.
35. Sun LL, Liu TJ, Li L, Tang W, Zou JJ, Chen XF, Zheng JY, Jiang BG, Shi YQ. Transplantation of betatrophin-expressing adi- pose-derived mesenchymal stem cells induces β-cell prolifera- tion in diabetic mice. Int J Mol Med 2017;39:936-48.
36. Li S, Liu D, Li L, Li Y, Li Q, An Z, Sun X, Tian H. Circulating betatrophin in patients with type 2 diabetes: a meta-analysis. J Diabetes Res 2016;2016:6194750.
37. Abu-Farha M, Abubaker J, Al-Khairi I, Cherian P, Noronha F, Kavalakatt S, Khadir A, Behbehani K, Alarouj M, Bennakhi A, Elkum N. Circulating angiopoietin-like protein 8 (betatro- phin) association with HsCRP and metabolic syndrome. Car- diovasc Diabetol 2016;15:25.
38. Lee YH, Lee SG, Lee CJ, Kim SH, Song YM, Yoon MR, Jeon BH, Lee JH, Lee BW, Kang ES, Lee HC, Cha BS. Association
between betatrophin/ANGPTL8 and non-alcoholic fatty liver disease: animal and human studies. Sci Rep 2016;6:24013.
39. Ren G, Kim JY, Smas CM. Identification of RIFL, a novel adi- pocyte-enriched insulin target gene with a role in lipid metab-
olism. Am J Physiol Endocrinol Metab 2012;303:E334-51.
40. Fu Z, Abou-Samra AB, Zhang R. An explanation for recent discrepancies in levels of human circulating betatrophin. Dia- betologia 2014;57:2232-4.