D I A B E T E S & M E T A B O L I S M J O U R N A L
This is an Open Access article distributed under the terms of the Creative Commons Attribution Non-Commercial License (http://creativecommons.org/licenses/by-nc/4.0/) which permits unrestricted non-commercial use, distribution, and reproduction in any medium, provided the original work is properly cited.
The Protective Effects of Increasing Serum Uric Acid Level on Development of Metabolic Syndrome
Tae Yang Yu1,2, Sang-Man Jin3, Jae Hwan Jee4, Ji Cheol Bae5, Moon-Kyu Lee3, Jae Hyeon Kim3,6,7
1Division of Endocrinology and Metabolism, Department of Medicine, Wonkwang Medical Center, Wonkwang University School of Medicine, Iksan,
2Department of Medicine, Sungkyunkwan University Graduate School of Medicine, Seoul,
3 Division of Endocrinology and Metabolism, Department of Medicine, 4Department of Health Promotion Center, Samsung Medical Center, Sungkyunkwan University School of Medicine, Seoul,
5 Division of Endocrinology and Metabolism, Department of Medicine, Samsung Changwon Hospital, Sungkyunkwan University School of Medicine, Changwon,
6Samsung Biomedical Research Institute, Samsung Medical Center, Seoul,
7 Department of Clinical Research Design & Evaluation, Samsung Advanced Institute for Health Sciences & Technology, Sungkyunkwan University, Seoul, Korea
Background: It has not been determined whether changes in serum uric acid (SUA) level are associated with incident metabolic syndrome (MetS). The aim of the current study was to investigate the relationship between changes in SUA level and development of MetS in a large number of subjects.
Methods: In total, 13,057 subjects participating in a medical health check-up program without a diagnosis of MetS at baseline were enrolled. Cox proportional hazards models were used to test the independent association of percent changes in SUA level with development of MetS.
Results: After adjustment for age, systolic blood pressure, body mass index, fat-free mass (%), estimated glomerular filtration rate, smoking status, fasting glucose, triglyceride, low density lipoprotein cholesterol, high density lipoprotein cholesterol, and baseline SUA levels, the hazard ratios (HRs) (95% confidence intervals [CIs]) for incident MetS in the second, third, and fourth quartiles compared to the first quartile of percent change in SUA level were 1.055 (0.936 to 1.190), 0.927 (0.818 to 1.050), and 0.807 (0.707 to 0.922) in male (P for trend <0.001) and 1.000 (0.843 to 1.186), 0.744 (0.615 to 0.900), and 0.684 (0.557 to 0.840) in female (P for trend <0.001), respectively. As a continuous variable in the fully-adjusted model, each one-standard deviation increase in percent change in SUA level was associated with an HR (95% CI) for incident MetS of 0.944 (0.906 to 0.982) in male (P=0.005) and 0.851 (0.801 to 0.905) in female (P<0.001).
Conclusion: The current study demonstrated that increasing SUA level independently protected against the development of MetS, suggesting a possible role of SUA as an antioxidant in the pathogenesis of incident MetS.
Keywords: Longitudinal studies; Metabolic syndrome; Uric acid
Corresponding author: Jae Hyeon Kim https://orcid.org/0000-0001-5001-963X Division of Endocrinology and Metabolism, Department of Medicine, Samsung Medical Center, Sungkyunkwan University School of Medicine, 81 Irwon-ro, Gangnam-gu, Seoul 06351, Korea
E-mail: [email protected]
INTRODUCTION
Metabolic syndrome (MetS) is a comorbid condition of meta- bolic origin that includes abdominal obesity, atherogenic dys- lipidemia, elevated blood pressure (BP), and elevated plasma glucose level [1]. MetS is increasing in prevalence globally and
has become one of the most important health problems world- wide [2] due to its relationships with cardiovascular disease (CVD) and type 2 diabetes mellitus [3].
Uric acid is the end-product of purine catabolism in humans [4]. The prevalence of MetS has been reported to increase with increasing baseline serum uric acid (SUA) level [5]. We also https://doi.org/10.4093/dmj.2018.0079
pISSN 2233-6079 · eISSN 2233-6087
observed this relationship after adjusting for body composition in our previous study, which included the same subjects as the current study [6]. Elevated SUA level has also been suggested to increase the risk for CVD mortality [7].
However, there is substantial evidence that uric acid might also have an antioxidant capacity as a free radical scavenger [8- 13]. In addition, several studies have demonstrated that uric acid administration improves outcomes in patients with acute stroke [14-16]. Similarly, in our previous study, although elevat- ed serum albumin level, which also has an antioxidant capacity, was linked to increased risk of incident MetS, change in serum albumin concentration was inversely associated with develop- ment of MetS, demonstrating that increase in serum albumin concentration might protect against the risk of MetS [17].
Considering these data, it has been hypothesized that the antioxidant effects of increasing SUA level might protect against the development of MetS. Nevertheless, the longitudi- nal association between changes in SUA level and the develop- ment of MetS has not yet been evaluated. Thus, we designed this study to investigate the longitudinal effects of changing SUA concentration on the development of MetS during a 7-year follow-up period in a healthy study group.
METHODS
Study population and design
A retrospective longitudinal study was designed to evaluate the association between changes in SUA level and development of
MetS. The study subjects were adults aged ≥18 years who par- ticipated in a medical health check-up program at the Health Promotion Center of Samsung Medical Center, Sungkyunk- wan University, Seoul, Korea [18]. The check-up included an- nual or biennial evaluations of medical history, smoking status, anthropometric data, and laboratory data. Initially, 24,185 par- ticipants who attended at least four follow-up visits between January 2006 and December 2012 were assessed for eligibility.
Among these participants, 11,003 were excluded because they were diagnosed with MetS at the baseline examination (n=
3,475); developed MetS within 1 year of the first visit (n=1,443);
had a history of CVD (myocardial infarction, bypass surgery, stroke, n=692); had total bilirubin or liver enzyme level more than twice the upper normal limit (n=248); had an estimated glomerular filtration rate (eGFR) under 60 mL/min/1.73 m2 (n=233); lacked waist circumference (WC) data at baseline or during follow-up (n=7,702); or lacked SUA data at baseline or during follow-up (n=237). Thus, 13,057 participants (7,694 male and 5,363 female) were included in the study (Fig. 1). The observation period for each patient continued until the patient was first diagnosed with MetS, or until the last follow-up visit if the patient was not diagnosed with MetS. The study was ap- proved by the Institutional Review Board (IRB) of Samsung Medical Center (IRB No. SMC 2015-01-003-001). Informed consent was waived by the IRB.
Clinical and biochemical measurements
Weight, height, systolic BP, and diastolic BP were measured at 24,185 Subjects were assessed for eligibility
13,057 Metabolic syndrome-free subjects at baseline
2,913 Incident metabolic syndrome 10,144 No metabolic syndrome
11,003 Exclusion criteria 3,475 Baseline MetS
1,443 Diagnosis of MetS less than 1 year from first visit
692 History of CVD
248 Total bilirubin or liver enzyme levels more than twice the upper normal limit 233 eGFR <60 mL/min/1.73 m2
7,702 Missing waist circumference data at baseline or during follow-up
237 Missing serum uric acid data at base- line or during follow-up
Fig. 1. Selection of study participants. MetS, metabolic syndrome; CVD, cardiovascular disease; eGFR, estimated glomerular fil- tration rate.
each visit. BP was measured by trained nurses with a mercury sphygmomanometer on the right arm after the participant had been seated comfortably for at least 5 minutes. WC was mea- sured at the plane across the iliac crest, which usually repre- sents the narrowest part of the torso. Body mass index (BMI) was calculated as the body weight in kilograms divided by the square of the height in meters (kg/m2). The eGFR was calculat- ed with the Modification of Diet in Renal Disease equation [19].
Venous blood samples were obtained after overnight fasting.
Fasting plasma glucose (FPG), plasma insulin, triglyceride (TG), high density lipoprotein cholesterol (HDL-C), low den- sity lipoprotein cholesterol (LDL-C), SUA, and creatinine lev- els were measured. However, we were unable to obtain plasma insulin level for 5,115 participants (2,529 male and 2,586 fe- male).
The FPG concentration was measured with hexokinase and Bayer Reagent Packs on an automated chemistry analyzer (Ad- via 1650 Autoanalyzer; Bayer Diagnostics, Leverkusen, Ger- many), and fasting plasma insulin concentration was mea- sured with an immunoradiometric assay (TFB Co. Ltd., Tokyo, Japan). TG, LDL-C, HDL-C, and SUA levels were measured by an enzymatic colorimetric method with a Modular D2400 (Roche Diagnostics, Basel, Switzerland).
Changes in SUA level were determined by subtracting the baseline level from the final level, which was measured at the end of follow-up in participants without incident MetS or one year before the date of diagnosis of MetS. The percent change in SUA was calculated as follows:
Percent change in SUA=(Change in SUA)/(Baseline SUA)
×100
Definition of metabolic syndrome
The Joint Interim Statement of the International Diabetes Fed- eration Task Force on Epidemiology and Prevention was used to define MetS [20]. Participants were recognized as having MetS if they met three or more of the following criteria: (1) ab- dominal obesity (WC ≥90 cm in male, WC ≥80 cm in fe- male); (2) high BP (systolic BP ≥130 mm Hg or diastolic BP
≥85 mm Hg) or medical treatment for hypertension; (3) high TG (≥150 mg/dL) or medical treatment for elevated TG; (4) low HDL-C (<40 mg/dL in male, <50 mg/dL in female) or medical treatment for low HDL-C; and (5) elevated fasting glucose (≥100 mg/dL) or treatment for diabetes.
Statistical analyses
Data were analyzed with SPSS version 21 (IBM Co., Armonk, NY, USA) and R version 3.3.2 (R Foundation, Vienna, Austria;
http://www.r-project.org/). Continuous variables with normal distributions were expressed as mean±standard deviation, whereas continuous variables with non-normal distributions were expressed as median and interquartile range. Categorical data were expressed as frequencies and percentages. Student’s t-test or the Mann-Whitney U test was used to compare par- ticipant characteristics according to the development of MetS.
Pearson’s chi-square test was used to compare frequency distri- butions. Natural logarithm-transformed high-sensitivity C-re- active protein (hs-CRP) values were used in a Pearson’s corre- lation model. The percent changes in SUA level were analyzed in quartile groups and with 1SD (standard deviation) percent changes in SUA as a continuous variable.
Multivariate Cox proportional hazards analysis was used to estimate the hazard ratios (HRs) and 95% confidence intervals (CIs) for incident MetS according to changes in SUA level.
Collinearity tests for variables used in the multivariate Cox proportional hazards analyses were performed through linear modeling of the outcome variables, and the variance inflation factor (VIF) was calculated for the independent predictors. A VIF <5 was considered optimal to warrant stability. The sets of variables adjusted in the model were previously selected ac- cording to clinical relevance (i.e., smoking status [21]).
The initial model was adjusted for age, systolic BP, BMI, fat- free mass (FFM, %), eGFR, and smoking status (Model 1).
Then, we additionally adjusted for fasting glucose, TG, LDL-C, and HDL-C levels (Model 2). To determine the independent effect of the percent change in SUA level on the development of MetS, we also added baseline SUA level as a covariate (Mod- el 3). Because fasting insulin data were only available for 7,980 participants (5,188 male and 2,792 female), we also formulated a model that included fasting insulin level as an additional confounder (Model 4). Two-tailed probability values <0.05 were considered to indicate statistical significance.
RESULTS
Clinical characteristics of the study participants
Table 1 displays the clinical characteristics and laboratory vari- ables of the study participants with regard to the development of MetS. At baseline, the male who did not develop MetS were 51.7±8.4 years old, and those who did were 51.8±7.9 years old
(P=0.502). The female who did not develop MetS were 48.6±
7.2 years old at baseline, whereas those who did were 52.4±7.5 years old (P<0.001).
In both sexes, baseline SUA level was lower in those who did not develop MetS than in those who did (5.7±1.1, 6.0±1.2 mg/dL for male; 4.0±0.8, 4.4±0.9 mg/dL for female, respectively; P<
0.001). On the other hand, the changes in SUA level in both sexes were higher in those who did not develop MetS than in those who did (0.5%±14.1%, –0.8%±13.3% for male; 6.3%±
17.2%, 1.8%±15.5% for female, respectively; P<0.001).
Participants who subsequently developed MetS had higher BMI, WC, systolic BP, diastolic BP, fasting glucose, fasting in-
sulin, homeostasis model assessment index for insulin resis- tance (HOMA-IR), total cholesterol, TG, and LDL-C levels, but lower FFM (%) and HDL-C levels than those who did not develop MetS in both sexes.
Clinical characteristics of the study participants based on percent change in SUA quartile category
Table 2 presents the clinical characteristics and laboratory vari- ables of the study participants based on the percent change in SUA quartile category. The percent change in SUA quartiles was positively related to the eGFR but negatively related to BMI, WC, total cholesterol, LDL-C, and baseline SUA levels in Table 1. Baseline characteristics for both sexes according to development of metabolic syndrome
Characteristic
Incident MetS
Male (n=7,694) Female (n=5,363)
(n=5,682, 73.8%)No Yes
(n=2,012, 26.2%) P value No
(n=4,462, 83.2%) Yes
(n=901, 16.8%) P value
Age, yr 51.7±8.4 51.8±7.9 0.502 48.6 ±7.2 52.4 ±7.5 <0.001
Smoking status <0.001 0.155
Current smoker 1,440 (25.3) 638 (31.7) 84 (1.9) 11 (1.2)
Ex-smoker 2,615 (46.0) 917 (45.6) 141 (3.2) 21 (2.3)
Non-smoker 1,627 (28.6) 457 (22.7) 4,237 (95.0) 869 (96.4)
BMI, kg/m2 23.6±2.2 25.1±2.1 <0.001 21.7±2.3 23.8±2.5 <0.001
Waist circumference, cm 84.5±6.0 89.2±5.8 <0.001 73.5±6.1 79.0±6.5 <0.001
Fat-free mass, % 79.9±5.1 78.0±4.0 <0.001 72.7±5.3 69.3±5.1 <0.001
Systolic BP, mm Hg 111.9±13.9 115.0±13.2 <0.001 107.5±14.3 115.2±15.2 <0.001
Diastolic BP, mm Hg 70.0±9.7 72.2±8.9 <0.001 65.1±9.9 69.1±9.9 <0.001
eGFR, mL/min/1.73 m2 87.9±11.5 87.7±11.6 0.429 90.8±12.5 89.6±12.9 0.006
Fasting glucose, mg/dL 89.4±13.9 92.7±14.5 <0.001 85.0±9.0 89.4±12.9 <0.001
Fasting insulin, μU/mLa 7.7 (6.0–9.7) 8.9 (7.0–11.4) <0.001 7.8 (6.0–9.7) 8.9 (7.1–11.3) <0.001
HOMA-IRa 1.7 (1.3–2.2) 2.0 (1.6–2.6) <0.001 1.6 (1.3–2.1) 1.9 (1.5–2.6) <0.001
Total cholesterol, mg/dL 188.7±30.2 190.9±30.8 0.004 190.5±32.4 198.1±35.1 <0.001
TG, mg/dL 101.0 (77.0–134.0) 134.0 (104.0–179.0) <0.001 87.0±37.0 119.6±55.2 <0.001
LDL-C, mg/dL 123.6±27.2 127.7±28.0 <0.001 118.0±28.3 131.5±31.1 <0.001
HDL-C, mg/dL 57.2±12.3 51.3±10.5 <0.001 66.4±13.6 58.1±12.0 <0.001
hs-CRP, mg/L 0.11±0.34 0.15±0.46 0.004 0.07±0.30 0.12±0.29 <0.001
Baseline SUA, mg/dL 5.7±1.1 6.0±1.2 <0.001 4.0±0.8 4.4±0.9 <0.001
Change in SUA, % 0.5±14.1 –0.8±13.3 <0.001 6.3±17.2 1.8±15.5 <0.001
Values are presented as mean±standard deviation, number (%), or median (interquartile range).
MetS, metabolic syndrome; BMI, body mass index; BP, blood pressure; eGFR, estimated glomerular filtration rate; HOMA-IR, homeostasis model assessment index for insulin resistance; TG, triglyceride; LDL-C, low density lipoprotein cholesterol; HDL-C, high density lipoprotein cholesterol; hs-CRP, high-sensitivity C-reactive protein; SUA, serum uric acid.
an=5,188 male, n=2,792 female.
Table 2. Baseline clinical and biochemical characteristic of study subjects based on percent change in serum uric acid levels quartile categories and sex Characteristic Percent changes in serum uric acid (male, n=7,694)Percent changes in serum uric acid (female, n=5,363) Quartile 1 (≤–9.1%, n=1,927)
Quartile 2 (–9.0% to –0.1%, n=1,930) Quartile 3 (0% to 8.2%, n=1,908) Quartile 4 (≥8.3%, n=1,929)P valueQuartile 1 (≤–5.6%, n=1,346) Quartile 2 (–5.5% to 4.1%, n=1,324) Quartile 3 (4.2% to 14.6%, n=1,348)
Quartile 4 (≥14.7%, n=1,345)P value Age, yr52.7±8.351.7±8.051.3±8.251.1±8.3<0.00150.2±8.449.5±7.449.1±7.248.3±6.3<0.001 Smoking status<0.0010.910 Current smoker 478 (24.8)493 (25.5)517 (27.1)590 (30.6)22 (1.6)22 (1.7)24 (1.8)27 (2.0) Ex-smoker958 (49.7)885 (45.9)863 (45.2)826 (42.8)47 (3.5)37 (2.8)38 (2.8)40 (3.0) Non-smoker491 (25.5)552 (28.6)528 (27.7)513 (26.6)1,277 (94.9)1,265 (95.5)1,286 (95.4)1,278 (95.0) BMI, kg/m224.0±2.224.2±2.224.0±2.423.8±2.2<0.00122.4±2.622.1±2.521.9±2.321.9±2.3<0.001 Waist circumference, cm86.1±6.286.5±6.185.6±6.584.9±6.3<0.00175.2±7.174.5±6.573.9±6.274.0±6.1<0.001 Fat-free mass, % 79.6±4.579.2±4.579.3±4.779.3±6.00.11571.6±5.672.0±5.572.5±5.272.3±5.3<0.001 Systolic BP, mm Hg 112.0±14.0112.4±13.5112.6±13.5113.8±14.1<0.001108.8±15.4108.8±14.9108.5±14.4109.1±14.40.728 Diastolic BP, mm Hg70.2 ± 9.470.5±9.470.5±9.571.3±9.70.00165.9±10.165.7±9.965.2±10.066.2±10.00.787 eGFR, mL/min/1.73 m286.5±11.286.9±11.188.4±11.789.7±11.8<0.00188.1±12.490.3±12.891.3±11.992.9±12.7<0.001 Fasting glucose, mg/dL89.8±13.389.7±12.190.0±13.791.4±16.9<0.00186.1±10.985.7±8.585.3±9.785.8±10.20.314 Fasting insulin, μU/mLa7.9 (6.1–10.3)8.0 (6.3–10.2)7.9 (6.1–10.3)7.9 (6.1–10.3)0.6907.8 (6.0–9.9)8.0 (6.1–9.8)7.9 (6.2–10.1)7.9 (6.3–10.3)0.598 HOMA-IRa1.8 (1.3–2.3)1.8 (1.4–2.3)1.7 (1.3–2.3)1.8 (1.4–2.3)0.5141.7 (1.3–2.1)1.7 (1.3–2.2)1.7 (1.3–2.1)1.7 (1.3–2.2)0.562 Total cholesterol, mg/dL190.7±30.9189.8±30.2188.6±30.3187.8±30.00.001194.2±34.3193.4±32.1191.3±32.6188.0±32.6<0.001 TG, mg/dL 108.0 (80.0–145.0)110.0 (82.0–146.0)107.0 (81.0–143.0)111.0 (83.0–145.0)0.23884.0 (64.0–113.0)86.0 (67.0–108.0)84.0 (63.5–112.0)81.0 (63.0–109.0)0.059 LDL-C, mg/dL 126.5±28.2125.8±27.4124.3±27.1122.1±27.0<0.001123.4±30.6122.2±29.0119.2±28.6116.2±28.1<0.001 HDL-C, mg/dL56.3±12.455.5±12.155.3±12.055.5±12.00.03864.7±13.464.9±14.065.8±13.664.9±13.70.363 hs-CRP, mg/L0.12±0.250.12±0.350.12±0.460.13±0.410.5640.10±0.460.07±0.160.07±0.160.08±0.290.150 Baseline SUA, mg/dL 6.2±1.26.0±1.15.7±1.15.3±1.0<0.0014.5±0.94.2±0.84.0±0.73.7±0.7<0.001 Change in SUA, %–16.3±6.2–4.8±2.33.4±2.618.2±9.4<0.001–14.0±7.0–0.7±2.79.0±3.027.6±12.8<0.001 Incident MetS545 (28.3)544 (28.2)485 (25.4)438 (22.7)<0.001298 (22.1)255 (19.3)184 (13.6)164 (12.2)<0.001 Values are presented as mean±standard deviation, number (%), or median (interquartile range). Characteristics of the study population according to the serum uric acid quartile were compared using one-way analysis of variance (ANOVA) or Kruskal-Wallis test for continuous variables and chi-square test for categorical variables. MetS, metabolic syndrome; BMI, body mass index; BP, blood pressure; eGFR, estimated glomerular filtration rate; HOMA-IR, homeostasis model assessment index for insulin resis- tance; TG, triglyceride; LDL-C, low density lipoprotein cholesterol; HDL-C, high density lipoprotein cholesterol; hs-CRP, high-sensitivity C-reactive protein; SUA, serum uric acid. an=5,188 male, n=2,792 female.
both male and female. The incidence of MetS exhibited a de- creasing trend across the percent change in SUA quartile cate- gory in both sexes (both P<0.001). Supplementary Table 1 dis- plays the clinical characteristics and laboratory variables of the study participants based on baseline SUA quartile category.
And Supplementary Tables 2 and 3 present the clinical charac- teristics and laboratory variables of the study participants based on baseline SUA quartile category according to incident MetS.
Correlations of SUA level and percent changes in SUA level with studied parameters
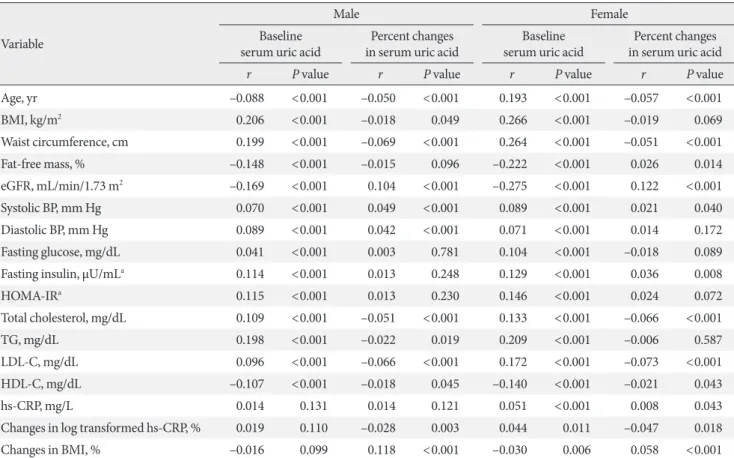
Table 3 displays the correlations of baseline SUA level and per- cent changes in SUA level with anthropometric and biochemi- cal parameters according to sex. Baseline SUA level correlated positively with BMI, WC, systolic BP, diastolic BP, fasting glu-
cose, fasting insulin, HOMA-IR, total cholesterol, TG, and LDL-C levels. In contrast, baseline SUA level correlated nega- tively with eGFR, HDL-C, and FFM (%) values in both male and female. The strongest correlation was observed between baseline SUA level and BMI (r=0.206, P<0.001 in male; r=
0.266, P<0.001 in female).
Changes in SUA level correlated positively with eGFR, sys- tolic BP, diastolic BP, and change in BMI. In contrast, changes in SUA level correlated negatively with WC, total cholesterol, TG, LDL-C, HDL-C, and percent change in log-transformed hs-CRP values in both male and female. The strongest correla- tion was observed between changes in SUA level and changes in BMI in male (r=0.118, P<0.001) and between changes in SUA level and eGFR in female (r=0.122, P<0.001). These fac- tors were used as adjustments in the Cox proportional hazards models.
Table 3. Correlations between serum uric acid levels, percent changes in serum uric acid and metabolic parameters according to both sexes
Variable
Male Female
Baseline
serum uric acid Percent changes
in serum uric acid Baseline
serum uric acid Percent changes in serum uric acid
r P value r P value r P value r P value
Age, yr –0.088 <0.001 –0.050 <0.001 0.193 <0.001 –0.057 <0.001
BMI, kg/m2 0.206 <0.001 –0.018 0.049 0.266 <0.001 –0.019 0.069
Waist circumference, cm 0.199 <0.001 –0.069 <0.001 0.264 <0.001 –0.051 <0.001
Fat-free mass, % –0.148 <0.001 –0.015 0.096 –0.222 <0.001 0.026 0.014
eGFR, mL/min/1.73 m2 –0.169 <0.001 0.104 <0.001 –0.275 <0.001 0.122 <0.001
Systolic BP, mm Hg 0.070 <0.001 0.049 <0.001 0.089 <0.001 0.021 0.040
Diastolic BP, mm Hg 0.089 <0.001 0.042 <0.001 0.071 <0.001 0.014 0.172
Fasting glucose, mg/dL 0.041 <0.001 0.003 0.781 0.104 <0.001 –0.018 0.089
Fasting insulin, μU/mLa 0.114 <0.001 0.013 0.248 0.129 <0.001 0.036 0.008
HOMA-IRa 0.115 <0.001 0.013 0.230 0.146 <0.001 0.024 0.072
Total cholesterol, mg/dL 0.109 <0.001 –0.051 <0.001 0.133 <0.001 –0.066 <0.001
TG, mg/dL 0.198 <0.001 –0.022 0.019 0.209 <0.001 –0.006 0.587
LDL-C, mg/dL 0.096 <0.001 –0.066 <0.001 0.172 <0.001 –0.073 <0.001
HDL-C, mg/dL –0.107 <0.001 –0.018 0.045 –0.140 <0.001 –0.021 0.043
hs-CRP, mg/L 0.014 0.131 0.014 0.121 0.051 <0.001 0.008 0.043
Changes in log transformed hs-CRP, % 0.019 0.110 –0.028 0.003 0.044 0.011 –0.047 0.018
Changes in BMI, % –0.016 0.099 0.118 <0.001 –0.030 0.006 0.058 <0.001
CRP was log transformed to meet the demands of normal distribution.
BMI, body mass index; eGFR, estimated glomerular filtration rate; BP, blood pressure; HOMA-IR, homeostasis model assessment index for in- sulin resistance; TG, triglyceride; LDL-C, low density lipoprotein cholesterol; HDL-C, high density lipoprotein cholesterol; hs-CRP, high-sensi- tivity C-reactive protein.
an=5,188 male, n=2,792 female.
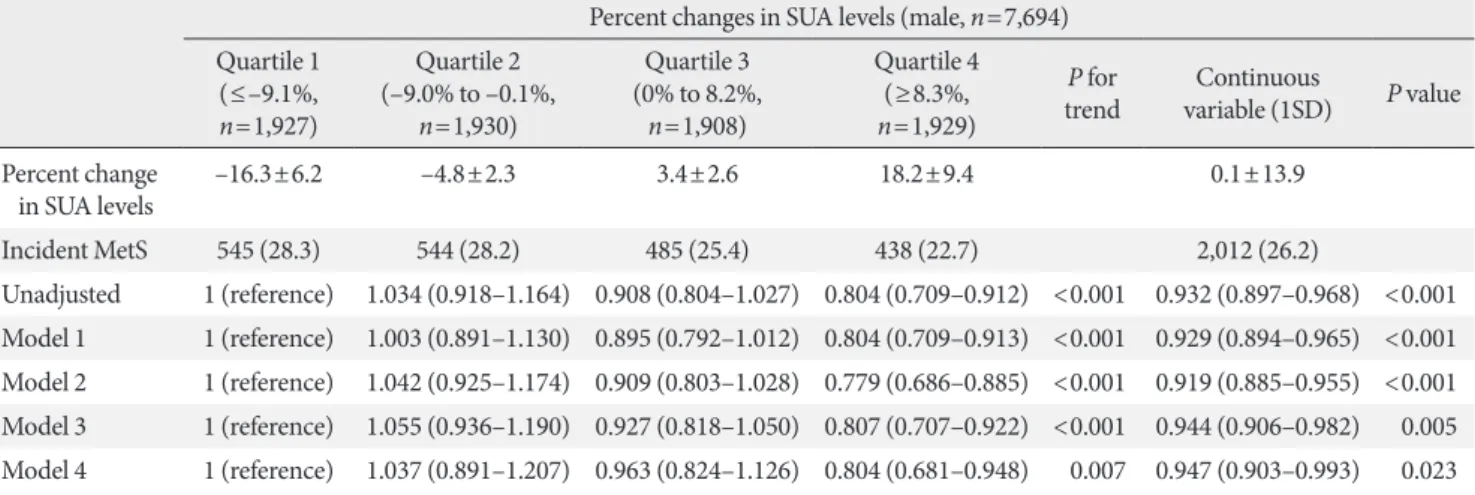
Changes in SUA level during follow-up and the risk of MetS During 62,458 person-years of follow-up between 2006 and 2012, there were 2,955 (2,012 male, 901 female) incident cases of MetS. Tables 4 and 5 display the HRs and 95% CIs for inci- dent MetS according to percent change in SUA level, both in
quartile groups and as a continuous variable.
Across quartile categories, although there was not exact lin- ear relationship since the HR was highest in the second quar- tile in male, the HR for developing MetS decreased with a lin- ear trend. In the unadjusted model, the HRs (95% CIs) for in- Table 4. Hazard ratios and 95% confidence intervals for development of metabolic syndrome according to quartile of percent change in serum uric acid levels: male
Percent changes in SUA levels (male, n=7,694) Quartile 1
(≤–9.1%, n=1,927)
Quartile 2 (–9.0% to –0.1%,
n=1,930)
Quartile 3 (0% to 8.2%,
n=1,908)
Quartile 4 (≥8.3%, n=1,929)
P for
trend Continuous
variable (1SD) P value Percent change
in SUA levels –16.3±6.2 –4.8±2.3 3.4±2.6 18.2±9.4 0.1±13.9
Incident MetS 545 (28.3) 544 (28.2) 485 (25.4) 438 (22.7) 2,012 (26.2)
Unadjusted 1 (reference) 1.034 (0.918–1.164) 0.908 (0.804–1.027) 0.804 (0.709–0.912) <0.001 0.932 (0.897–0.968) <0.001 Model 1 1 (reference) 1.003 (0.891–1.130) 0.895 (0.792–1.012) 0.804 (0.709–0.913) <0.001 0.929 (0.894–0.965) <0.001 Model 2 1 (reference) 1.042 (0.925–1.174) 0.909 (0.803–1.028) 0.779 (0.686–0.885) <0.001 0.919 (0.885–0.955) <0.001 Model 3 1 (reference) 1.055 (0.936–1.190) 0.927 (0.818–1.050) 0.807 (0.707–0.922) <0.001 0.944 (0.906–0.982) 0.005 Model 4 1 (reference) 1.037 (0.891–1.207) 0.963 (0.824–1.126) 0.804 (0.681–0.948) 0.007 0.947 (0.903–0.993) 0.023 Values are presented as mean±standard deviation, number (%), hazard ratio (95% confidence interval). Model 1: adjusted for age, systolic blood pressure, body mass index, fat-free mass (%), estimated glomerular filtration rate, and smoking status; Model 2: adjusted for Model 1 plus fast- ing glucose, triglyceride, low density lipoprotein cholesterol, and high density lipoprotein cholesterol; Model 3: adjusted for Model 2 plus base- line SUA; Model 4: adjusted for Model 3 plus fasting insulin.a
SUA, serum uric acid; SD, standard deviation; MetS, metabolic syndrome.
an=5,188 male.
Table 5. Hazard ratios and 95% confidence intervals for development of metabolic syndrome according to quartile of percent change in serum uric acid levels: female
Percent changes in SUA levels (female, n=5,363) Quartile 1
(≤–5.6%, n=1,346)
Quartile 2 (–5.5% to 4.1%,
n=1,324)
Quartile 3 (4.2% to 14.6%,
n=1,348)
Quartile 4 (≥14.7%, n=1,345)
P for
trend Continuous
variable (1SD) P value Percent change
in SUA levels –14.0±7.0 –0.7±2.7 9.0±3.0 27.6±12.8 5.5±17.0
Incident MetS 298 (22.1) 255 (19.3) 184 (13.6) 164 (12.2) 901 (16.8)
Unadjusted 1 (reference) 0.860 (0.728–1.017) 0.590 (0.491–0.709) 0.524 (0.433–0.635) <0.001 0.778 (0.779–0.873) <0.001 Model 1 1 (reference) 0.977 (0.825–1.157) 0.684 (0.567–0.824) 0.635 (0.523–0.772) <0.001 0.825 (0.894–0.965) <0.001 Model 2 1 (reference) 0.981 (0.828–1.162) 0.713 (0.591–0.859) 0.634 (0.522–0.771) <0.001 0.831 (0.785–0.880) <0.001 Model 3 1 (reference) 1.000 (0.843–1.186) 0.744 (0.615–0.900) 0.684 (0.557–0.840) <0.001 0.851 (0.801–0.905) <0.001 Model 4 1 (reference) 0.971 (0.765–1.232) 0.760 (0.584–0.988) 0.740 (0.560–0.976) 0.011 0.856 (0.791–0.926) <0.001 Values are presented as mean±standard deviation, number (%), or hazard ratio (95% confidence interval). Model 1: adjusted for age, systolic blood pressure, body mass index, fat-free mass (%), estimated glomerular filtration rate, and smoking status; Model 2: adjusted for Model 1 plus fasting glucose, triglyceride, low density lipoprotein cholesterol, and high density lipoprotein cholesterol; Model 3: adjusted for Model 2 plus baseline SUA; Model 4: adjusted for Model 3 plus fasting insulin.a
SUA, serum uric acid; SD, standard deviation; MetS, metabolic syndrome.
an=2,792 female.
cident MetS in the second, third, and fourth quartiles com- pared to the first quartile of percent changes in SUA level were 1.034 (95% CI, 0.918 to 1.164), 0.908 (95% CI, 0.804 to 1.027), and 0.804 (95% CI, 0.709 to 0.912) in male (P for trend <0.001) and 0.860 (95% CI, 0.728 to 1.017), 0.590 (95% CI, 0.491 to 0.709), and 0.524 (95% CI, 0.433 to 0.635) in female (P for trend
<0.001), respectively. These associations remained significant after further adjustments (Model 1: adjusted for age, systolic BP, BMI, FFM [%], eGFR, and smoking status; Model 2: Model 1 plus fasting glucose, TG, LDL-C, and HDL-C levels; Model 3:
Model 2 plus baseline SUA level; Model 4: Model 3 plus fasting insulin level).
As a continuous variable, the percent change in SUA level was also negatively associated with the risk of incident MetS.
In the unadjusted model, the HR (95% CI) for incident MetS associated with each 1SD increase in the percent change in SUA level was 0.932 (95% CI, 0.897 to 0.968; P<0.001) in male and 0.778 (95% CI, 0.779 to 0.873; P<0.001) in female. These associations were apparent even after adjustments for multiple confounders in Models 1 and 2. After further adjustment for baseline SUA level (Model 3), the HR (95% CI) for incident MetS associated with each 1SD increase in the percent change in SUA level was 0.944 (95% CI, 0.906 to 0.982; P=0.005) in male and 0.851 (95% CI, 0.801 to 0.905; P<0.001) in female.
These associations were still significant after additional adjust- ment for fasting insulin level (Model 4 [HR, 0.947; 95% CI, 0.903 to 0.993, P=0.023 in male]; [HR, 0.856; 95% CI, 0.791 to 0.926; P<0.001 in female]).
Supplementary Fig. 1 shows cumulative incidence of MetS using the Kaplan-Meier method and the log-rank test accord- ing to SUA quartile categories and percent change in SUA quartile categories according to both sexes. Fourth quartiles (Q4) of the percent change in SUA show a higher cumulative incidence of MetS than the other quartiles in both sexes (P<
0.001).
In subgroup analysis, Supplementary Tables 4 and 5 displays the HRs and 95% CIs for incident MetS according to percent change in SUA level as a continuous variable, regarding to the quartile categories of the basal SUA level separately. In the ful- ly-adjusted model (Model 3) and additionally adjusted model for fasting insulin level (Model 4), each 1 SD increase in per- cent change in SUA level was negatively correlated with inci- dent MetS regarding to the quartiles of the basal SUA levels in female. However, they lost statistical significance in male.
DISCUSSION
The novel finding of the present study was that there was a negative association between the percent change in SUA level and the incidence of MetS in mostly healthy participants, even after adjustment for baseline SUA level. Most epidemiological and cohort studies have identified positive relationships be- tween baseline SUA level and prevalence of MetS. However, until this study, no attempt had been made to investigate the relationship between changes in SUA level and development of MetS.
In our study, both across quartile groups and as a continuous variable, the percent change in SUA level was negatively associ- ated with incident MetS (Tables 4 and 5). Therefore, the per- cent change in SUA level could be an important measure, and increasing SUA level might protect against the development of MetS. The results of the current study support the idea that changes in SUA level could be one of the major anti-oxidative biomarkers predicting the development of MetS.
Uric acid is a water-soluble antioxidant mostly produced by the liver [4] and contributes up to 50% of the antioxidant ca- pacity in the blood [22]. Additionally, it has been proposed that uric acid directly inhibits free radical-induced damage, thus protecting the cell membrane and DNA [23,24]. Further- more, the increment of SUA level has been tested as a treat- ment in the clinical field of neurology. Some studies have dem- onstrated that systemic administration of uric acid increases the serum antioxidant capacity in healthy subjects [12,13]. In patients with acute stroke, the use of uric acid reduced several biomarkers of oxidative stress and was neuroprotective in combination with thrombolytic therapy [14,15]. More recently, uric acid therapy was reported to improve the clinical out- comes of acute stroke in female [16].
SUA has long been debated as either a prooxidant risk factor or an antioxidant protective factor. It has also been unclear whether increased SUA level in diseases associated with oxida- tive stress (such as CVDs) is a protective response or a primary cause [25,26]. SUA might be a prooxidant marker of oxidative stress [27], but it also could have a therapeutic role as an anti- oxidant [28,29]. Considering all of the above, the prolonged conflict could be resolved if it is hypothesized that the gradual elevation of SUA level is a protective factor, whereas chronic elevation is a risk factor for disease [30].
Although the mechanism was not completely delineated in the current study, the chronic inflammation and oxidative
stress involved in the initiation of MetS could explain the asso- ciation between changes in SUA level and risk of developing MetS. To understand the mechanism whereby increasing SUA level protects against MetS, we investigated the correlation be- tween changes in SUA level and changes in log-transformed hs-CRP (%). Changes in log-transformed hs-CRP (%) corre- lated inversely with changes in SUA level in both sexes, indi- cating that the protective/anti-inflammatory effects of SUA mainly contribute to its effects on incident MetS (Table 3).
However, it remains unclear whether the increment in SUA level is an adaptive response to increasing oxidative stress, or whether failure to increase SUA level is a risk factor of MetS.
Further studies are needed to resolve this question.
The relationship between changes in SUA level and develop- ment of MetS has been remained area of uncertainty; there- fore, the findings of the current study are relevant for better defining the potentially protective role of SUA. Nevertheless, several limitations of this study should be mentioned. First, since participants were self-selected and this study was con- ducted with a single-center-based sample, we were unable to ascertain whether participants were representative of the gen- eral Korean population; thus, selection bias could limit the generalizability of the results. Second, we could not investigate the pattern of changes in SUA level in each participant since we used Multivariate Cox proportional hazards analysis. Third, participants who were taking medications known to influence SUA level (i.e., diuretics or allopurinol) could not be excluded.
Forth, the reason and mechanism were still unclear what made the different results by sexes in subgroup analysis (Supplemen- tary Tables 4 and 5). Finally, we did not include dietary habits or alcohol intake. Despite these limitations, we studied a large sample population with a relatively long follow-up period. Fur- ther, the measurements of factors associated with SUA level were standardized.
In conclusion, although higher baseline SUA level has been linked to an increased risk of incident MetS, increasing SUA level might protect against the risk of MetS, regardless of base- line SUA level, suggesting a possible role of SUA as an antioxi- dant in the pathogenesis of incident MetS.
SUPPLEMENTARY MATERIALS
Supplementary materials related to this article can be found online at https://doi.org/10.4093/dmj.2018.0079.
CONFLICTS OF INTEREST
No potential conflict of interest relevant to this article was re- ported.
AUTHOR CONTRIBUTIONS
Conception or design: J.H.K.
Acquisition, analysis, or interpretation of data: S.M.J., J.H.J., J.C.B., M.K.L.
Drafting the work or revising: T.Y.Y.
Final approval of the manuscript: J.H.K.
ORCID
Tae Yang Yu https://orcid.org/0000-0003-0893-592X Jae Hyeon Kim https://orcid.org/0000-0001-5001-963X
ACKNOWLEDGMENTS
This study was supported by a grant from Wonkwang Univer- sity in 2018.
REFERNECES
1. Grundy SM, Cleeman JI, Daniels SR, Donato KA, Eckel RH, Franklin BA, Gordon DJ, Krauss RM, Savage PJ, Smith SC Jr, Spertus JA, Costa F; American Heart Association; National Heart, Lung, and Blood Institute. Diagnosis and management of the metabolic syndrome: an American Heart Association/
National Heart, Lung, and Blood Institute Scientific Statement.
Circulation 2005;112:2735-52.
2. Eckel RH, Grundy SM, Zimmet PZ. The metabolic syndrome.
Lancet 2005;365:1415-28.
3. Ford ES. Risks for all-cause mortality, cardiovascular disease, and diabetes associated with the metabolic syndrome: a sum- mary of the evidence. Diabetes Care 2005;28:1769-78.
4. Becker BF. Towards the physiological function of uric acid.
Free Radic Biol Med 1993;14:615-31.
5. Choi HK, Ford ES. Prevalence of the metabolic syndrome in individuals with hyperuricemia. Am J Med 2007;120:442-7.
6. Yu TY, Jee JH, Bae JC, Jin SM, Baek JH, Lee MK, Kim JH. Se- rum uric acid: a strong and independent predictor of metabolic syndrome after adjusting for body composition. Metabolism 2016;65:432-40.
7. Strasak AM, Kelleher CC, Brant LJ, Rapp K, Ruttmann E, Concin H, Diem G, Pfeiffer KP, Ulmer H; VHM&PP Study Group. Serum uric acid is an independent predictor for all ma- jor forms of cardiovascular death in 28,613 elderly women: a prospective 21-year follow-up study. Int J Cardiol 2008;125:
232-9.
8. Sautin YY, Johnson RJ. Uric acid: the oxidant-antioxidant para- dox. Nucleosides Nucleotides Nucleic Acids 2008;27:608-19.
9. Duan X, Ling F. Is uric acid itself a player or a bystander in the pathophysiology of chronic heart failure? Med Hypotheses 2008;70:578-81.
10. Landmesser U, Spiekermann S, Dikalov S, Tatge H, Wilke R, Kohler C, Harrison DG, Hornig B, Drexler H. Vascular oxida- tive stress and endothelial dysfunction in patients with chronic heart failure: role of xanthine-oxidase and extracellular super- oxide dismutase. Circulation 2002;106:3073-8.
11. Doehner W, Schoene N, Rauchhaus M, Leyva-Leon F, Pavitt DV, Reaveley DA, Schuler G, Coats AJ, Anker SD, Hambrecht R. Effects of xanthine oxidase inhibition with allopurinol on endothelial function and peripheral blood flow in hyperurice- mic patients with chronic heart failure: results from 2 placebo- controlled studies. Circulation 2002;105:2619-24.
12. Waring WS, Webb DJ, Maxwell SR. Systemic uric acid admin- istration increases serum antioxidant capacity in healthy vol- unteers. J Cardiovasc Pharmacol 2001;38:365-71.
13. Waring WS, Convery A, Mishra V, Shenkin A, Webb DJ, Max- well SR. Uric acid reduces exercise-induced oxidative stress in healthy adults. Clin Sci (Lond) 2003;105:425-30.
14. Amaro S, Chamorro A. Translational stroke research of the combination of thrombolysis and antioxidant therapy. Stroke 2011;42:1495-9.
15. Logallo N, Naess H, Idicula TT, Brogger J, Waje-Andreassen U, Thomassen L. Serum uri acid: neuroprotection in thromboly- sis. The Bergen NORSTROKE study. BMC Neurol 2011;11:114.
16. Llull L, Laredo C, Renu A, Perez B, Vila E, Obach V, Urra X, Planas A, Amaro S, Chamorro A. Uric acid therapy improves clinical outcome in women with acute ischemic stroke. Stroke 2015;46:2162-7.
17. Jin SM, Hong YJ, Jee JH, Bae JC, Hur KY, Lee MK, Kim JH.
Change in serum albumin concentration is inversely and inde- pendently associated with risk of incident metabolic syndrome.
Metabolism 2016;65:1629-35.
18. Kim SW, Jee JH, Kim HJ, Jin SM, Suh S, Bae JC, Kim SW, Chung JH, Min YK, Lee MS, Lee MK, Kim KW, Kim JH. Non- HDL-cholesterol/HDL-cholesterol is a better predictor of met-
abolic syndrome and insulin resistance than apolipoprotein B/
apolipoprotein A1. Int J Cardiol 2013;168:2678-83.
19. Levey AS, Bosch JP, Lewis JB, Greene T, Rogers N, Roth D. A more accurate method to estimate glomerular filtration rate from serum creatinine: a new prediction equation. Modifica- tion of Diet in Renal Disease Study Group. Ann Intern Med 1999;130:461-70.
20. Alberti KG, Eckel RH, Grundy SM, Zimmet PZ, Cleeman JI, Donato KA, Fruchart JC, James WP, Loria CM, Smith SC Jr;
International Diabetes Federation Task Force on Epidemiology and Prevention; Hational Heart, Lung, and Blood Institute;
American Heart Association; World Heart Federation; Inter- national Atherosclerosis Society; International Association for the Study of Obesity. Harmonizing the metabolic syndrome: a joint interim statement of the International Diabetes Federa- tion Task Force on Epidemiology and Prevention; National Heart, Lung, and Blood Institute; American Heart Association;
World Heart Federation; International Atherosclerosis Society;
and International Association for the Study of Obesity. Circu- lation 2009;120:1640-5.
21. Kang JH, Song YM. Association between cotinine-verified smoking status and metabolic syndrome: analyses of Korean National Health and Nutrition Examination Surveys 2008- 2010. Metab Syndr Relat Disord 2015;13:140-8.
22. Glantzounis GK, Tsimoyiannis EC, Kappas AM, Galaris DA.
Uric acid and oxidative stress. Curr Pharm Des 2005;11:4145- 51.
23. Hooper DC, Spitsin S, Kean RB, Champion JM, Dickson GM, Chaudhry I, Koprowski H. Uric acid, a natural scavenger of peroxynitrite, in experimental allergic encephalomyelitis and multiple sclerosis. Proc Natl Acad Sci U S A 1998;95:675-80.
24. Spitsin SV, Scott GS, Kean RB, Mikheeva T, Hooper DC. Pro- tection of myelin basic protein immunized mice from free- radical mediated inflammatory cell invasion of the central ner- vous system by the natural peroxynitrite scavenger uric acid.
Neurosci Lett 2000;292:137-41.
25. Koenig W, Meisinger C. Uric acid, type 2 diabetes, and cardio- vascular diseases: fueling the common soil hypothesis? Clin Chem 2008;54:231-3.
26. Baillie JK, Bates MG, Thompson AA, Waring WS, Partridge RW, Schnopp MF, Simpson A, Gulliver-Sloan F, Maxwell SR, Webb DJ. Endogenous urate production augments plasma an- tioxidant capacity in healthy lowland subjects exposed to high altitude. Chest 2007;131:1473-8.
27. Strazzullo P, Puig JG. Uric acid and oxidative stress: relative
impact on cardiovascular risk? Nutr Metab Cardiovasc Dis 2007;17:409-14.
28. Becker BF, Reinholz N, Leipert B, Raschke P, Permanetter B, Gerlach E. Role of uric acid as an endogenous radical scaven- ger and antioxidant. Chest 1991;100(3 Suppl):176S-81S.
29. Strasak AM, Rapp K, Hilbe W, Oberaigner W, Ruttmann E, Concin H, Diem G, Pfeiffer KP, Ulmer H; VHM&PP Study
Group. The role of serum uric acid as an antioxidant protecting against cancer: prospective study in more than 28 000 older Austrian women. Ann Oncol 2007;18:1893-7.
30. Yu ZF, Bruce-Keller AJ, Goodman Y, Mattson MP. Uric acid protects neurons against excitotoxic and metabolic insults in cell culture, and against focal ischemic brain injury in vivo. J Neurosci Res 1998;53:613-25.