D I A B E T E S & M E T A B O L I S M J O U R N A L
This is an Open Access article distributed under the terms of the Creative Commons Attribution Non-Commercial License (http://creativecommons.org/licenses/by-nc/4.0/) which permits unrestricted non-commercial use, distribution, and reproduction in any medium, provided the original work is properly cited.
Clinical Course and Risk Factors of Diabetic
Retinopathy in Patients with Type 2 Diabetes Mellitus in Korea
Jae-Seung Yun1, Tae-Seok Lim1, Seon-Ah Cha1, Yu-Bae Ahn1, Ki-Ho Song2, Jin A Choi3, Jinwoo Kwon3, Donghyun Jee3, Yang Kyung Cho3, Yong-Moon Park4, Seung-Hyun Ko1
1 Division of Endocrinology and Metabolism, Department of Internal Medicine, St. Vincent’s Hospital, College of Medicine, The Catholic University of Korea, Suwon,
2 Division of Endocrinology and Metabolism, Department of Internal Medicine, Yeouido St. Mary’s Hospital, College of Medicine, The Catholic University of Korea, Seoul,
3Department of Ophthalmology, St. Vincent’s Hospital, College of Medicine, The Catholic University of Korea, Suwon, Korea,
4 Epidemiology Branch, National Institute of Environmental Health Sciences, National Institutes of Health, U.S. Department of Health and Human Services, Research Triangle Park, NC, USA
Background: We investigated clinical course and risk factors for diabetic retinopathy (DR) in patients with type 2 diabetes melli- tus (T2DM).
Methods: A total of 759 patients with T2DM without DR were included from January 2001 to December 2004. Retinopathy eval- uation was performed at least annually by ophthalmologists. The severity of the DR was classified into five categories according to the International Clinical Diabetic Retinopathy Severity Scales.
Results: Of the 759 patients, 523 patients (68.9%) completed the follow-up evaluation. During the follow-up period, 235 patients (44.9%) developed DR, and 32 patients (13.6%) progressed to severe nonproliferative DR (NPDR) or proliferative DR (PDR). The mean duration of diabetes at the first diagnosis of mild NPDR, moderate NPDR, and severe NPDR or PDR were 14.8, 16.7, and 17.3 years, respectively. After adjusting multiple confounding factors, the significant risk factors for the incidence of DR risk in patients with T2DM were old age, longer duration of diabetes, higher mean glycosylated hemoglobin (HbA1c), and albuminuria.
Even in the patients who had been diagnosed with diabetes for longer than 10 years at baseline, a decrease in HbA1c led to a sig- nificant reduction in the risk of developing DR (hazard ratio, 0.73 per 1% HbA1c decrement; 95% confidence interval, 0.58 to 0.91; P=0.005).
Conclusion: This prospective cohort study demonstrates that glycemic control, diabetes duration, age, and albuminuria are im- portant risk factors for the development of DR. More aggressive retinal screening for T2DM patients diagnosed with DR should be required in order to not miss rapid progression of DR.
Keywords: Diabetes mellitus, type 2; Diabetic retinopathy; Risk factors
Corresponding author: Seung-Hyun Ko http://orcid.org/0000-0003-3703-1479 Division of Endocrinology and Metabolism, Department of Internal Medicine, St. Vincent’s Hospital, College of Medicine, The Catholic University of Korea, 93 Jungbu-daero, Paldal-gu, Suwon 16247, Korea
INTRODUCTION
Diabetic retinopathy (DR) is one of the major microvascular complications of diabetes, and the most common cause of nontraumatic visual loss in the working-age population [1]. It
has been estimated that the global prevalence of DR was 93 million (35%) and the prevalence of vision-threatening diabet- ic retinopathy (VTDR) was 28 million (10.2%) among diabetes patients in 2010 [2]. In Korea, the prevalence of retinopathy in diabetes was reported to be 18.6% according to the 2011 Korea https://doi.org/10.4093/dmj.2016.40.6.482
pISSN 2233-6079 · eISSN 2233-6087
National Health and Nutritional Examination Survey [3]. It is anticipated that the prevalence of DR and VTDR is likely to continue to rise, particularly in Asia and other developing ar- eas [4]. In addition, DR is a risk marker for systemic vascular complications. Independent of conventional risk factors, the presence of retinopathy, even in its mildest form, was associat- ed with a two to three times higher risk of cardiovascular dis- ease (CVD) [5]. Thus, regular retinal screening is a corner- stone of diabetes care, and evidence-based retinal screening is helpful in reducing the development and progression of DR.
To detect DR at an optimal stage for intervention, the Ameri- can Diabetes Association and Korean Diabetes Association recommend that after the diagnosis of type 2 diabetes mellitus (T2DM), patients should receive an initial dilated and compre- hensive eye examination by an ophthalmologist, and subse- quent annual examinations [6,7].
Identifying the natural course and risk factors of DR is im- portant because the screening strategy depends on the rates of development and progression of DR. The development and progression of DR have been evaluated through multiple epi- demiologic studies. One previous study suggested that 38% of T2DM patients develop any type of DR in a 6-year period [8].
In the Wisconsin Epidemiologic Study of Diabetic Retinopathy (WESDR), approximately 10% of diabetic patients developed severe visual impairment within 15 years of being diagnosed with diabetes [9]. Several studies, including the Diabetes Con- trol and Complication Trial (DCCT), the UK Prospective Dia- betes Study (UKPDS), and the Action to Control Cardiovascu- lar Risk in Diabetes (ACCORD) study, have noted risk factors related to DR such as poor glycemic control and hypertension [10-12]. It is well known that optimum control of blood glu- cose and blood pressure level is associated with a reduced risk in the onset and progression of DR in T2DM [11-13]. Although some lipid-lowering agents have recently emerged as possible therapeutic agents for DR [14,15], there are conflicting studies examining the relationship between DR and long-term risk factor status, including serum lipid levels, and medications, es- pecially in Asian populations [16-19].
Thus, the aim of this prospective study was to evaluate the natural course and predictive factors of DR among patients with T2DM in Korea.
METHODS
In this study, 1,195 patients aged 25 to 75 years old who were
diagnosed with T2DM were consecutively enrolled from Janu- ary 2001 to December 2004. We excluded 436 patients from the study cohort who had any type of DR, secondary diabetes, alcoholism, or had any severe illness such as heart failure, liver cirrhosis, severe infection, or had malignancy. Patients who had a history of gestational diabetes mellitus or who were preg- nant during the study were also excluded. Patients received follow-up until between 2013 and 2015, depending on the in- dividual and their treatment plan, at the university-affiliated Diabetes Center of St. Vincent’s Hospital in South Korea. This prospective cohort study was approved by the Catholic Medi- cal Center Ethics Committee and was performed according to the Declaration of Helsinki. Written informed consent was ob- tained from all participants.
A detailed questionnaire was collected from all patients to obtain information including age, gender, duration of diabetes, current smoking status, medical history, and use of medications.
Hypertension was defined as systolic blood pressure ≥140 mm Hg, diastolic blood pressure ≥90 mm Hg, or current use of an- tihypertensive medication [20]. We defined smoking as cur- rent or past smokers within 3 years preceding enrollment in the study. Alcohol consumption was defined as drinking any type of alcoholic beverage at least once a week for a period of 6 months or longer. Glycosylated hemoglobin (HbA1c) was col- lected at baseline and at least every 6 months, and fasting plas- ma glucose (FPG), postprandial plasma glucose, serum creati- nine, total cholesterol, triglyceride (TG), high density lipopro- tein cholesterol (HDL-C), and low density lipoprotein choles- terol (LDL-C) were collected at baseline and at least annually.
Lipid profiles were measured enzymatically using an automatic analyzer (model 736-40; Hitachi, Tokyo, Japan). The urinary albumin excretion rate was measured by enzyme immunoas- say using immunoturbidimetry with a 24-hour urine collec- tion (Eiken, Tokyo, Japan), and the presence of albuminuria was defined as urine albumin excretion over 30 mg/day. The estimated glomerular filtration rate (eGFR) was calculated us- ing the four-component Modification of Diet in Renal Disease equation [21]. A cardiovascular autonomic function test using the Ewing method was performed in all enrolled patients at baseline. At least two abnormal results were defined as definite cardiovascular autonomic neuropathy [22]. Medication utili- zation was assessed for insulin, angiotensin-converting enzyme (ACE) inhibitor/angiotensin II receptor blocker (ARB), statin, fenofibrate, and aspirin from enrollment to the end of the fol- low-up period. Prior CVD history was defined as a diagnosed
history of coronary artery disease or cerebrovascular disease.
The clinical diagnosis of CVD based on verified medical re- cords was confirmed by specialists from each clinical depart- ment including cardiology, neurology, and neurosurgery [23].
A standardized comprehensive eye examination was per- formed annually by experienced ophthalmologists. After max- imal dilatation of the pupil, retinal images were obtained using a digital fundus camera (TRC-NW6S; Topcon, Tokyo, Japan) equipped with a Nikon D-80 digital camera (Nikon, Tokyo, Ja- pan), and digital fundus images were obtained from all partici- pants. For each of the participants, one 45 digital retinal image centered on the fovea was obtained per eye (two images per person in total). The comprehensive eye examination frequen- cy was determined by the ophthalmologist, depending on the severity of the DR. Agreements of eye examination between ophthalmologists were evaluated as Cohen’s κ coefficient and kappa statistics ranged from 0.76 to 0.84. The severity of the DR was classified according to the international clinical dia- betic retinopathy severity scales into five categories: nondia- betic retinopathy (equivalent to the Early Treatment Diabetic Retinopathy Study [ETDRS] scale level 10), mild nonprolifera- tive diabetic retinopathy (NPDR; equivalent to the ETDRS scale level 20), moderate NPDR (equivalent to the ETDRS scale level 35, 43, 47), severe NPDR (equivalent to the ETDRS scale level 53A–53E), and proliferative diabetic retinopathy (PDR; equivalent to the ETDRS scale level ≥61) [24,25]. If both eyes were rated at different stages, then the grade of the worst eye was used. The primary endpoint was to identify the development of DR in patients who did not have any type of DR at baseline [12].
The normality test was performed to evaluate the distribu- tion of data. Data are presented mean±standard deviation (SD) or, in the case of a skewed distribution, as median (interquar- tile range). Chi-square tests were used to test differences in the proportion of categorical variables, and independent Student t-tests were used to evaluate the difference between the mean of two continuous variables. The incidence rate of DR was de- termined by dividing the number of cases of incident retinopa- thy by the total number of patient-years accumulated in the study by patients without DR at baseline. The duration of DR was estimated by the measurement of the mean duration of di- abetes at the first diagnosis at each stage of DR progression. We applied multivariate Cox proportional hazards models to test the associations between new onset DR and the related risk factors after adjusting for the following covariates: sex, age, du-
ration of diabetes, presence of hypertension, body mass index (BMI), prior CVD history, mean HbA1c level, albuminuria, eGFR, use of insulin, ACE inhibitors, ARBs, aspirin, statin, or fenofibrate. Covariates were selected by considering the clini- cal and statistical relevance as identified in previously published literature and by using the current dataset between the primary outcome and variables. The proportional hazards assumption was confirmed using log-minus log-survival plots and tested with the methods previously described elsewhere [26]. These results were reported as hazard ratios (HRs) with a 95% confi- dence interval. Statistical analyses were performed using SAS version 9.3 (SAS Institute Inc., Cary, NC, USA). P<0.05 was considered significant.
RESULTS
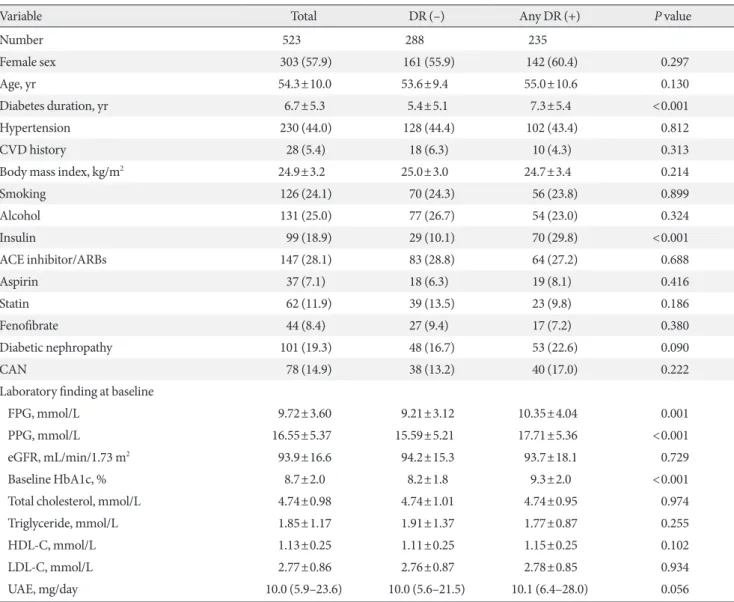
Of the 759 patients who were included the study, 523 patients (68.9%) completed the follow-up. Table 1 shows the baseline characteristics of the patients. The mean age was 54.3 years and mean duration of diabetes was 6.7 years. Compared with the 523 participants who completed the follow-up evaluation, the 236 patients who did not complete the follow-up evaluation did not differ with respect to age (54.3±10.0 years vs. 55.9±11.1 years, P=0.059), the female ratio (57.9% vs. 55.1%, P=0.463), the duration of diabetes (6.7±5.3 years vs. 6.3±5.3 years, P=
0.329), the presence of hypertension (44.0% vs. 47.5%, P=0.372), or mean HbA1c (8.2%±1.2% vs. 8.2%±1.6%, P=0.950) during the follow-up period.
The median follow-up time was 11.8 years (interquartile range, 9.8 to 13.2). During the follow-up period, 235 patients (44.9%) developed DR. The incidence rate of DR was 38.1 per 1,000 patient-years. Among the 235 patients who developed DR, 32 patients (13.6%) progressed to the severe nonproliferative DR or proliferative DR during the follow-up period. Among them, 31 patients (13.2%) received panretinal photocoagulation treat- ment. The mean duration of diabetes of mild NPDR, moderate NPDR, and severe NPDR or PDR diagnosis are shown in Fig. 1.
For patients who received the follow-up care, data at the base- line visit showed that individuals who developed DR, had been diagnosed with diabetes for a longer time, had higher FPG and baseline HbA1c levels, and had greater use of insulin compar- ed with nonincidence cases (Table 1). On the other hand, there were no differences in the presence of hypertension, BMI, pri- or CVD history, smoking, cardiovascular autonomic dysfunc- tion, baseline eGFR, and serum lipid levels between the patients
with DR and without DR.
The group with DR had a higher mean HbA1c during the follow-up period (8.0%±0.9% vs. 8.5%±1.1%, P=0.005). Two patients (0.9%) who maintained a mean HbA1c level below 6.5% and 16 patients (6.8%) who maintained a mean HbA1c level below 7.0% developed DR. The incidence rate of DR in- creased as the mean HbA1c level increased. The SD of HbA1c and the coefficient of variation (CV) of HbA1c during the study also showed significant differences between the group with and without DR.
Regarding the mean level of lipid profiles during the study, mean total cholesterol, mean TG, mean HDL-C, and mean LDL-C showed no significant difference between the groups with and without DR (Supplementary Table 1, Fig. 2). Also, mean TG/HDL ratio and mean non-HDL did not differ be- tween the two groups (Supplementary Table 1). The use of statin, fenofibrate, and aspirin also had no influence on the incidence of DR. There were no differences in the incidence of DR be- tween patients who used those medications during the follow- up and those who did not (Supplementary Table 1).
Table 1. Comparison of baseline parameters between the patients with and without diabetic retinopathy
Variable Total DR (–) Any DR (+) P value
Number 523 288 235
Female sex 303 (57.9) 161 (55.9) 142 (60.4) 0.297
Age, yr 54.3±10.0 53.6±9.4 55.0±10.6 0.130
Diabetes duration, yr 6.7±5.3 5.4±5.1 7.3±5.4 <0.001
Hypertension 230 (44.0) 128 (44.4) 102 (43.4) 0.812
CVD history 28 (5.4) 18 (6.3) 10 (4.3) 0.313
Body mass index, kg/m2 24.9±3.2 25.0±3.0 24.7±3.4 0.214
Smoking 126 (24.1) 70 (24.3) 56 (23.8) 0.899
Alcohol 131 (25.0) 77 (26.7) 54 (23.0) 0.324
Insulin 99 (18.9) 29 (10.1) 70 (29.8) <0.001
ACE inhibitor/ARBs 147 (28.1) 83 (28.8) 64 (27.2) 0.688
Aspirin 37 (7.1) 18 (6.3) 19 (8.1) 0.416
Statin 62 (11.9) 39 (13.5) 23 (9.8) 0.186
Fenofibrate 44 (8.4) 27 (9.4) 17 (7.2) 0.380
Diabetic nephropathy 101 (19.3) 48 (16.7) 53 (22.6) 0.090
CAN 78 (14.9) 38 (13.2) 40 (17.0) 0.222
Laboratory finding at baseline
FPG, mmol/L 9.72±3.60 9.21±3.12 10.35±4.04 0.001
PPG, mmol/L 16.55±5.37 15.59±5.21 17.71±5.36 <0.001
eGFR, mL/min/1.73 m2 93.9±16.6 94.2±15.3 93.7±18.1 0.729
Baseline HbA1c, % 8.7±2.0 8.2±1.8 9.3±2.0 <0.001
Total cholesterol, mmol/L 4.74±0.98 4.74±1.01 4.74±0.95 0.974
Triglyceride, mmol/L 1.85±1.17 1.91±1.37 1.77±0.87 0.255
HDL-C, mmol/L 1.13±0.25 1.11±0.25 1.15±0.25 0.102
LDL-C, mmol/L 2.77±0.86 2.76±0.87 2.78±0.85 0.934
UAE, mg/day 10.0 (5.9–23.6) 10.0 (5.6–21.5) 10.1 (6.4–28.0) 0.056
Values are presented as number (%), mean±standard deviation, or median (interquartile range).
DR, diabetic retinopathy; CVD, cardiovascular disease; ACE, angiotensin-converting enzyme; ARB, angiotensin receptor blocker; CAN, cardio- vascular autonomic neuropathy; FPG, fasting plasma glucose; PPG, postprandial plasma glucose; eGFR, estimated glomerular filtration rate;
HbA1c, glycosylated hemoglobin; HDL-C, high density lipoprotein cholesterol; LDL-C, low density lipoprotein cholesterol; UAE, urinary albu- min excretion.
Fig. 2. Cumulative incidence for diabetic retinopathy accord- ing to the (A) mean glycosylated hemoglobin (HbA1c), (B) mean low density lipoprotein cholesterol (LDL-C) level, and (C) duration of diabetes.
10090 80 70 60 5040 30 20 10 0
Cumulative incidence (%)
<7.0 7.0–7.9 8.0–8.9 9.0–9.9 ≥10.0 Mean HbA1c during the study (%)
Cumulative incidence (%) 22.9 35.1 43.2 64.2 85.4
Incidence rate
(per 1,000 patient-years) 18.8 29.7 36.2 54.6 80.0
P for trend <0.001
100 90 8070 60 50 40 3020 10 0
Cumulative incidence (%)
<5 5–<10 ≥10
Duration of diabetes (yr)
Cumulative incidence (%) 37.1 48.1 53.4
Incidence rate
(per 1,000 patient-years) 31.4 40.7 45.3
P for trend=0.002
10090 80 70 60 5040 30 20 10 0
Cumulative incidence (%)
<1.8 1.8–<2.6 2.6–<3.3 ≥3.3 Mean LDL-C during the study (%)
Cumulative incidence (%) 44.0 40.1 48.6 46.5
Incidence rate
(per 1,000 patient-years) 49.5 37.7 40.6 46.5
P for trend=0.175
A B
C
Fig. 1. Clinical course of diabetic retinopathy in this cohort. PRP, panretinal photocoagulation; DR, diabetic retinopathy; NPDR, nonproliferative diabetic retinopathy; IR, incidence rate; PDR, proliferative.
1st PRP treatment 17.1 years
No DR Mild NPDR
IR=36.8
(per 1,000 patient-years) IR=11.1
(per 1,000 patient-years) IR=5.2 (per 1,000 patient-years)
Moderate NPDR Severe NPDR or PDR 17.1 Years
16.7 Years 14.8 Years
The univariable analysis for incidence of DR showed that age, diabetes duration, use of insulin, FPG, baseline HbA1c, mean HbA1c, and albuminuria were revealed as potential risk factors of DR. After adjusting for confounding factors, the group who had poor glycemic control during the follow-up (mean HbA1c ≥9%) showed 4.32 times higher risk of DR than those who had good glycemic control (mean HbA1c <7%) (Table 2).
In addition, a 1% increase in mean HbA1c resulted in a 54% in- crease in the risk of developing DR during the follow-up (P<
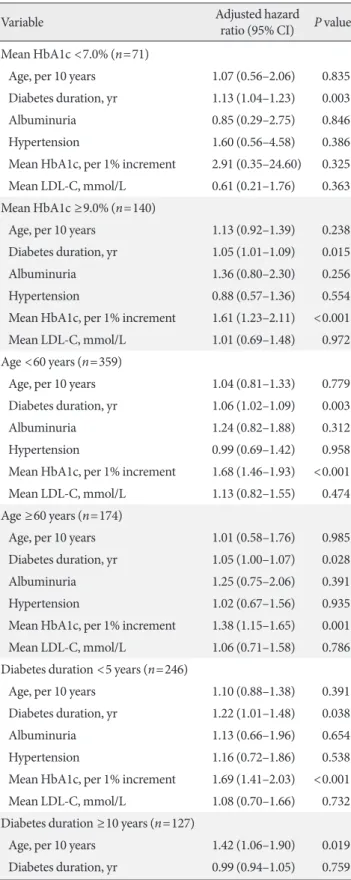
0.001). However, there was no significant association between mean lipid parameters during the follow-up periods, the pres- ence of hypertension, BMI, use of medications, and the devel- opment of DR. We assessed an association between DR and re- lated risk factors within the subgroup stratified by mean HbA1c, age, and diabetes duration (Table 3). Among the 140 patients who maintained poor glycemic status (mean HbA1c ≥9.0%), the significant predictive factors for DR included a longer dia- betes duration and a higher level of mean HbA1c. In the 71 pa- tients who maintained good glycemic status during the study (mean HbA1c <7.0%), only a longer duration of diabetes was
a significant factor for the incidence of DR. In the group whose duration of diabetes was over 10 years at baseline, age, albumin- uria, and mean HbA1c remained significant factors for devel- oping DR. During the follow-up, a 1% decrease in HbA1c led to a 69% reduction in the risk of developing DR in the group who had a duration of diabetes less than 5 years at baseline. In addition, in the group who had a duration of diabetes for over 10 years at baseline, a 1% decrease in HbA1c led to a 37% re- duction in the risk of developing DR. There was no additional increase of HR in patients who maintained higher glucose (mean HbA1c ≥9%) and higher lipid levels (mean LDL-C ≥3.3 mmol/L) simultaneously during the study (P for interaction =0.720, data not shown). SD- and CV-HbA1c did not have a significant re- sult as a predictive factor for DR after adjusting for confound- ing factors (data not shown).
DISCUSSION
In this long-term analysis, old age, longer duration of diabetes, higher mean HbA1c, and albuminuria appeared to significant- Table 2. Crude and adjusted hazard ratio for the development of diabetic retinopathy
Variable Crude HR (95% CI) P value Adjusted HR (95% CI) P value
Female sex 1.22 (0.94–1.58) 0.137 1.02 (0.77–1.33) 0.913
Age, yr
<60 Reference Reference
≥60 1.46 (1.12–1.91) 0.005 1.40 (1.06–1.83) 0.018
Diabetes duration, yr
<5 Reference Reference
5 to <10 1.60 (1.17–2.18) 0.004 1.50 (1.09–2.06) 0.012
≥10 2.16 (1.58–2.96) <0.001 1.98 (1.43–2.73) <0.001
Diabetic nephropathy
Albuminuria (–) Reference Reference
Albuminuria (+) 1.32 (0.97–1.79) 0.078 1.41 (1.04–1.93) 0.029
Hypertension (yes vs. no) 1.01 (0.78–1.30) 0.965 0.92 (0.71–1.20) 0.559
Mean HbA1c, %
<7.0 Reference Reference
7.0–8.9 1.87 (1.11–3.16) 0.016 1.83 (1.08–3.09) 0.025
≥9.0 4.35 (2.56–7.39) <0.001 4.32 (2.52–7.40) <0.001
Mean LDL-C, mmol/L
<2.6 Reference Reference
≥2.6 1.31 (1.01–1.70) 0.046 1.09 (0.84–1.43) 0.509
Adjusted for sex, age, diabetes duration, mean HbA1c, albuminuria, hypertension, and mean LDL-C level.
HR, hazard ratio; CI, confidence interval; HbA1c, glycosylated hemoglobin; LDL-C, low density lipoprotein cholesterol.
Table 3. Association between major variables and develop- ment of diabetic retinopathy
(Continued to the next)
Table 3. Continued
ly increase the incidence of DR risk in patients with T2DM in Korea. Dyslipidemia, hypertension, and BMI did not show any relationship with the development of DR even in the stratified subgroup analysis.
Glycemic control is a well-known factor that can prevent or delay the incidence of DR. The UKPDS found that strict con- trol of blood glucose was essential for the prevention of DR. In the results, HbA1c was 7% in the intensive group as compared with 7.9% in the conventional group, and the risk of DR in the intensive group was 21% lower than in the conventional group [11]. The ACCORD trial also showed that the progression of DR was reduced in the intensive glycemic control group com- pared with the standard treatment group [12]. However, the Action in Diabetes and Vascular Disease: Preterax and Diami- cron Modified Release Controlled Evaluation (ADVANCE) and the Veterans Affairs Diabetes Trial (VADT) reported no ocular benefit for DR incidence of intensive glycemic control [27,28]. Possible explanations for the discrepancy include dif- ferences between the studies in the patients’ age, duration of diabetes, previous glycemic control status, and assessment of DR. In this study, we demonstrated that the strongest predic- tive factor of the incidence of DR was mean HbA1c during the follow-up, as expected. Another interesting finding of our study is that proper glycemic control can reduce the possibility of DR development, even in the patients with a long duration of dia- betes. Several studies have suggested that diabetes duration is one of the strongest and nonmodifiable risk factors for DR [29].
Thus, achieving proper glycemic control might help to reduce the risk of DR in patients who have a long diabetes duration.
Conflicting results have been reported about the effect of HbA1c variability on diabetic microvascular complications [30-32]. A recent meta-analysis concluded that HbA1c variability did not
Variable Adjusted hazard
ratio (95% CI) P value Mean HbA1c <7.0% (n=71)
Age, per 10 years 1.07 (0.56–2.06) 0.835 Diabetes duration, yr 1.13 (1.04–1.23) 0.003
Albuminuria 0.85 (0.29–2.75) 0.846
Hypertension 1.60 (0.56–4.58) 0.386
Mean HbA1c, per 1% increment 2.91 (0.35–24.60) 0.325 Mean LDL-C, mmol/L 0.61 (0.21–1.76) 0.363 Mean HbA1c ≥9.0% (n=140)
Age, per 10 years 1.13 (0.92–1.39) 0.238 Diabetes duration, yr 1.05 (1.01–1.09) 0.015
Albuminuria 1.36 (0.80–2.30) 0.256
Hypertension 0.88 (0.57–1.36) 0.554
Mean HbA1c, per 1% increment 1.61 (1.23–2.11) <0.001 Mean LDL-C, mmol/L 1.01 (0.69–1.48) 0.972 Age <60 years (n=359)
Age, per 10 years 1.04 (0.81–1.33) 0.779 Diabetes duration, yr 1.06 (1.02–1.09) 0.003
Albuminuria 1.24 (0.82–1.88) 0.312
Hypertension 0.99 (0.69–1.42) 0.958
Mean HbA1c, per 1% increment 1.68 (1.46–1.93) <0.001 Mean LDL-C, mmol/L 1.13 (0.82–1.55) 0.474 Age ≥60 years (n=174)
Age, per 10 years 1.01 (0.58–1.76) 0.985 Diabetes duration, yr 1.05 (1.00–1.07) 0.028
Albuminuria 1.25 (0.75–2.06) 0.391
Hypertension 1.02 (0.67–1.56) 0.935
Mean HbA1c, per 1% increment 1.38 (1.15–1.65) 0.001 Mean LDL-C, mmol/L 1.06 (0.71–1.58) 0.786 Diabetes duration <5 years (n=246)
Age, per 10 years 1.10 (0.88–1.38) 0.391 Diabetes duration, yr 1.22 (1.01–1.48) 0.038
Albuminuria 1.13 (0.66–1.96) 0.654
Hypertension 1.16 (0.72–1.86) 0.538
Mean HbA1c, per 1% increment 1.69 (1.41–2.03) <0.001 Mean LDL-C, mmol/L 1.08 (0.70–1.66) 0.732 Diabetes duration ≥10 years (n=127)
Age, per 10 years 1.42 (1.06–1.90) 0.019 Diabetes duration, yr 0.99 (0.94–1.05) 0.759
Variable Adjusted hazard
ratio (95% CI) P value
Albuminuria 1.72 (1.01–2.93) 0.047
Hypertension 0.98 (0.62–1.56) 0.934
Mean HbA1c, per 1% increment 1.37 (1.10–1.72) 0.005 Mean LDL-C, mmol/L 1.04 (0.66–1.61) 0.878 Adjusted for sex, age, diabetes duration, mean HbA1c, albuminuria, hypertension, and mean LDL-C level.
CI, confidence interval; HbA1c, glycosylated hemoglobin; LDL-C, low density lipoprotein cholesterol.
appear to be associated with DR in T2DM [33]. However, most of the studies were retrospective, and inconsistency existed in the definition of HbA1c variability. Our findings were remark- ably similar to the conclusion of a recent meta-analysis, and no significant associations were found between both SD-, CV- HbA1c, and DR.
There have been numerous clinical trials and observational studies on the association between dyslipidemia and DR [16, 34-36]. However, it remains uncertain whether dyslipidemia is related with the incidence and progression of DR. In some stud- ies, a significant association has been found between dyslipid- emia and DR. The WESDR showed that serum total cholester- ol was significantly associated with the presence and severity of hard exudates in young-onset diabetes [37]. In the Atheroscle- rosis Risk In Communities (ARIC) study, subjects with a high- er LDL-C level were more likely to have retinal hard exudates [35]. It is plausible that serum lipid level might be associated with DR, since dyslipidemia are known to cause endothelial dysfunction by reducing the amount of biologically active ni- tric oxide, and this endothelial dysfunction was suggested to play a role in retinal exudate formation in DR [38]. However, most studies have reported that there is no association between traditional lipid levels and DR [16,34,36,39]. In our study, there was no association between total cholesterol, TG, HDL-C, LDL- C, TG/HDL-C, and non-HDL and DR among all patients. In addition, no additional benefit for DR was observed in the group with simultaneous glycemic and lipid control.
Previous studies suggested that use of statin, fenofibrate, or aspirin may affect the natural course of DR. Also, other con- flicting results have been reported about the role of lipid-low- ering agents and aspirin for DR. The results of the Effect of Fe- nofibrate on the need for Laser Treatment for Diabetic Reti- nopathy (FIELD) and ACCORD studies suggested that fenofi- brate could reduce the need for laser treatment for DR [12,14], and were also less likely to demonstrate the progression of a preexisting retinopathy. In the Steno-2 trial, multifactorial treat- ment such as intensive use of aspirin and lipid-lowering agents sustained benefits in microvascular complications including the progression of DR and laser treatment for PDR or diabetic macular edema [40]. The Collaborative Atorvastatin Diabetes Study suggested that statin showed no effect on the progres- sion of DR [41]. A recent Spanish cohort study suggested that use of aspirin increased the risk of DR [42], while ETDRS re- ported there was no evidence for the effect of aspirin on the DR incidence [24,43]. In our cohort, we adjusted for the long-
term exposure (over 75% period during the follow-up) to med- ication as well as baseline medication use. As a result, the use of statin, fenofibrate, and aspirin did not affect the incidence of DR in this cohort. Also, the presence of hypertension and BMI at baseline was not associated with the development of DR.
There have been few studies that explore the natural course of DR because this requires a long-term investigation. The pre- vious study suggested the average time for the development of NPDR from no DR was estimated as 14.5 years [44]. We indi- rectly measured the average time to develop DR as a calcula- tion of duration of diabetes for the first diagnosis of DR for the patients who reached each stage of DR. As a result, the mean duration for the development of mild NPDR was approximate- ly 14.8 years, and progression time to moderate NPDR, severe NPDR, or PDR was 16.7 and 17.3 years, which was similar to previous studies. This result showed that the rate of DR pro- gression was considerably fast for the patients who progressed to severe form of DR. In agreement with previous studies, we re-confirmed that strict glycemic control and frequent retinal examination is important for T2DM patients after the first di- agnosis of DR to not miss rapid progression of DR.
The strength of this study is that it was a long-term, prospec- tively designed cohort study with regular comprehensive ex- aminations by ophthalmologists. Also, we used the long-term mean value of glycemic and lipid data to evaluate the accurate metabolic status of each patient. However, there are several limitations to this study. First, mean blood pressure and BMI data were incomplete during the follow-up in this study. Thus, we could not evaluate the exact effect of blood pressure and BMI on the development of DR. Second, we used the Interna- tional Clinical Diabetic Retinopathy Severity Scales which cat- egorize DR into five stages. We could not grade the DR stage more in detail or the ETDRS severity scale classification. How- ever, the International Clinical Diabetic Retinopathy Severity Scale is also commonly used by ophthalmologists on a routine clinical basis. Third, lifestyle, such as eating habits and exercise patterns, in T2DM patients is an important factor that affects the progression of the complications [45]. However, we could not collect the data of patients’ lifestyles in this study during the follow-up. These residual confounding factors due to un- measured factors cannot be excluded. Finally, the participants in this study were the patients who attended the diabetes cen- ter of a general hospital. For generalization, larger studies using more defined populations are required to better understand the relationship between DR and related risk factors.
In conclusion, we suggest that risk factors such as glycemic control, duration of diabetes, age, and albuminuria are the im- portant risk factors for the development of DR. Specifically, we suggest that glycemic control is the most important modifiable factor, even in the patients who had a long duration of diabe- tes. However, there were no significant relationships between traditional serum lipid levels, a presence of hypertension, BMI, and DR in this cohort study. From the results of the natural course of DR, annual to biennial screening for DR in accordance with current guidelines may be sufficient in patients without DR. However, for the patients who are diagnosed early with DR, more aggressive and frequent screening is needed for early detection of DR progression. Also, further identification of novel markers for the residual risk of retinopathy are needed to pre- vent the development of diabetic complication risk.
CONFLICTS OF INTEREST
No potential conflict of interest relevant to this article was re- ported.
ACKNOWLEDGMENTS
The authors thank H.R. Kim and H.J. Kang (St. Vincent’s Hos- pital, College of Medicine, The Catholic University of Korea) for their assistance collecting and analyzing data for this man- uscript.
REFERENCES
1. Cheung N, Mitchell P, Wong TY. Diabetic retinopathy. Lancet 2010;376:124-36.
2. Yau JW, Rogers SL, Kawasaki R, Lamoureux EL, Kowalski JW, Bek T, Chen SJ, Dekker JM, Fletcher A, Grauslund J, Haffner S, Hamman RF, Ikram MK, Kayama T, Klein BE, Klein R, Krish- naiah S, Mayurasakorn K, O’Hare JP, Orchard TJ, Porta M, Rema M, Roy MS, Sharma T, Shaw J, Taylor H, Tielsch JM, Varma R, Wang JJ, Wang N, West S, Xu L, Yasuda M, Zhang X, Mitchell P, Wong TY; Meta-Analysis for Eye Disease (META- EYE) Study Group. Global prevalence and major risk factors of diabetic retinopathy. Diabetes Care 2012;35:556-64.
3. Park YM, Ko SH, Lee JM, Kim DJ, Kim DJ, Han K, Bower JK, Ahn YB; Committee of Clinical Practice Guideline, Korean Diabetes Association. Glycaemic and haemoglobin A1c thresh- olds for detecting diabetic retinopathy: the fifth Korea National
Health and Nutrition Examination Survey (2011). Diabetes Res Clin Pract 2014;104:435-42.
4. Lee R, Wong TY, Sabanayagam C. Epidemiology of diabetic retinopathy, diabetic macular edema and related vision loss.
Eye Vis (Lond) 2015;2:17.
5. Cheung N, Wong TY. Diabetic retinopathy and systemic vas- cular complications. Prog Retin Eye Res 2008;27:161-76.
6. American Diabetes Association. Standards of medical care in diabetes: 2016. Diabetes Care 2016;39 Suppl 1:S1-106.
7. Korean Diabetes Association. Treatment guideline for diabetes.
5th ed. Seoul: Gold’ Planning and Development; 2015.
8. Younis N, Broadbent DM, Vora JP, Harding SP; Liverpool Dia- betic Eye Study. Incidence of sight-threatening retinopathy in patients with type 2 diabetes in the Liverpool Diabetic Eye Study:
a cohort study. Lancet 2003;361:195-200.
9. Klein R, Klein BE, Moss SE, Davis MD, DeMets DL. The Wis- consin epidemiologic study of diabetic retinopathy. III. Preva- lence and risk of diabetic retinopathy when age at diagnosis is 30 or more years. Arch Ophthalmol 1984;102:527-32.
10. The Diabetes Control and Complications Trial Research Group.
The effect of intensive treatment of diabetes on the develop- ment and progression of long-term complications in insulin- dependent diabetes mellitus. N Engl J Med 1993;329:977-86.
11. Stratton IM, Kohner EM, Aldington SJ, Turner RC, Holman RR, Manley SE, Matthews DR. UKPDS 50: risk factors for inci- dence and progression of retinopathy in type II diabetes over 6 years from diagnosis. Diabetologia 2001;44:156-63.
12. ACCORD Study Group; ACCORD Eye Study Group, Chew EY, Ambrosius WT, Davis MD, Danis RP, Gangaputra S, Greven CM, Hubbard L, Esser BA, Lovato JF, Perdue LH, Goff DC Jr, Cushman WC, Ginsberg HN, Elam MB, Genuth S, Gerstein HC, Schubart U, Fine LJ. Effects of medical therapies on reti- nopathy progression in type 2 diabetes. N Engl J Med 2010;363:
233-44.
13. UK Prospective Diabetes Study Group. Tight blood pressure control and risk of macrovascular and microvascular compli- cations in type 2 diabetes: UKPDS 38. BMJ 1998;317:703-13.
14. Keech AC, Mitchell P, Summanen PA, O’Day J, Davis TM, Mof- fitt MS, Taskinen MR, Simes RJ, Tse D, Williamson E, Merri- field A, Laatikainen LT, d’Emden MC, Crimet DC, O’Connell RL, Colman PG; FIELD study investigators. Effect of fenofi- brate on the need for laser treatment for diabetic retinopathy (FIELD study): a randomised controlled trial. Lancet 2007;370:
1687-97.
15. Ismail-Beigi F, Craven T, Banerji MA, Basile J, Calles J, Cohen
RM, Cuddihy R, Cushman WC, Genuth S, Grimm RH Jr, Ham- ilton BP, Hoogwerf B, Karl D, Katz L, Krikorian A, O’Connor P, Pop-Busui R, Schubart U, Simmons D, Taylor H, Thomas A, Weiss D, Hramiak I; ACCORD trial group. Effect of intensive treatment of hyperglycaemia on microvascular outcomes in type 2 diabetes: an analysis of the ACCORD randomised trial.
Lancet 2010;376:419-30.
16. Klein BE, Klein R, Moss SE. Is serum cholesterol associated with progression of diabetic retinopathy or macular edema in persons with younger-onset diabetes of long duration? Am J Ophthalmol 1999;128:652-4.
17. Lloyd CE, Klein R, Maser RE, Kuller LH, Becker DJ, Orchard TJ. The progression of retinopathy over 2 years: the Pittsburgh Epidemiology of Diabetes Complications (EDC) Study. J Dia- betes Complications 1995;9:140-8.
18. Funatsu H, Shimizu E, Noma H, Mimura T, Hori S. Associa- tion between serum lipoprotein (a) level and progression of non-proliferative diabetic retinopathy in type 2 diabetes. Acta Ophthalmol 2009;87:501-5.
19. Wong TY, Cheung N, Tay WT, Wang JJ, Aung T, Saw SM, Lim SC, Tai ES, Mitchell P. Prevalence and risk factors for diabetic retinopathy: the Singapore Malay Eye Study. Ophthalmology 2008;115:1869-75.
20. Ko SH, Kwon HS, Kim DJ, Kim JH, Kim NH, Kim CS, Song KH, Won JC, Lim S, Choi SH, Han K, Park YM, Cha BY; Task- force Team of Diabetes Fact Sheet of the Korean Diabetes As- sociation. Higher prevalence and awareness, but lower control rate of hypertension in patients with diabetes than general pop- ulation: the fifth Korean National Health and Nutrition Exami- nation Survey in 2011. Diabetes Metab J 2014;38:51-7.
21. Levey AS, Bosch JP, Lewis JB, Greene T, Rogers N, Roth D. A more accurate method to estimate glomerular filtration rate from serum creatinine: a new prediction equation. Modifica- tion of Diet in Renal Disease Study Group. Ann Intern Med 1999;130:461-70.
22. Yun JS, Kim JH, Song KH, Ahn YB, Yoon KH, Yoo KD, Park YM, Ko SH. Cardiovascular autonomic dysfunction predicts severe hypoglycemia in patients with type 2 diabetes: a 10-year follow-up study. Diabetes Care 2014;37:235-41.
23. Yun JS, Ko SH, Ko SH, Song KH, Yoo KD, Yoon KH, Park YM, Ahn YB. Cardiovascular disease predicts severe hypoglycemia in patients with type 2 diabetes. Diabetes Metab J 2015;39:498- 506.
24. Early Treatment Diabetic Retinopathy Study Research Group.
Effects of aspirin treatment on diabetic retinopathy. ETDRS re-
port number 8. Ophthalmology 1991;98(5 Suppl):757-65.
25. Wilkinson CP, Ferris FL 3rd, Klein RE, Lee PP, Agardh CD, Davis M, Dills D, Kampik A, Pararajasegaram R, Verdaguer JT;
Global Diabetic Retinopathy Project Group. Proposed interna- tional clinical diabetic retinopathy and diabetic macular edema disease severity scales. Ophthalmology 2003;110:1677-82.
26. Grambsch PM, Therneau TM. Proportional hazards tests and diagnostics based on weighted residuals. Biometrika 1994;81:
515-26.
27. ADVANCE Collaborative Group, Patel A, MacMahon S, Chal- mers J, Neal B, Billot L, Woodward M, Marre M, Cooper M, Glasziou P, Grobbee D, Hamet P, Harrap S, Heller S, Liu L, Man- cia G, Mogensen CE, Pan C, Poulter N, Rodgers A, Williams B, Bompoint S, de Galan BE, Joshi R, Travert F. Intensive blood glucose control and vascular outcomes in patients with type 2 diabetes. N Engl J Med 2008;358:2560-72.
28. Azad N, Agrawal L, Emanuele NV, Klein R, Bahn GD, Reaven P; VADT Study Group. Association of blood glucose control and pancreatic reserve with diabetic retinopathy in the Veter- ans Affairs Diabetes Trial (VADT). Diabetologia 2014;57:1124- 31.
29. Kawasaki R, Tanaka S, Tanaka S, Abe S, Sone H, Yokote K, Ishi- bashi S, Katayama S, Ohashi Y, Akanuma Y, Yamada N, Yama- shita H; Japan Diabetes Complications Study Group. Risk of cardiovascular diseases is increased even with mild diabetic retinopathy: the Japan Diabetes Complications Study. Oph- thalmology 2013;120:574-82.
30. Luk AO, Ma RC, Lau ES, Yang X, Lau WW, Yu LW, Chow FC, Chan JC, So WY. Risk association of HbA1c variability with chronic kidney disease and cardiovascular disease in type 2 di- abetes: prospective analysis of the Hong Kong Diabetes Regis- try. Diabetes Metab Res Rev 2013;29:384-90.
31. Penno G, Solini A, Bonora E, Fondelli C, Orsi E, Zerbini G, Morano S, Cavalot F, Lamacchia O, Laviola L, Nicolucci A, Pug- liese G; Renal Insufficiency And Cardiovascular Events Study Group. HbA1c variability as an independent correlate of ne- phropathy, but not retinopathy, in patients with type 2 diabetes:
the Renal Insufficiency And Cardiovascular Events (RIACE) Italian multicenter study. Diabetes Care 2013;36:2301-10.
32. Hirakawa Y, Arima H, Zoungas S, Ninomiya T, Cooper M, Hamet P, Mancia G, Poulter N, Harrap S, Woodward M, Chalm- ers J. Impact of visit-to-visit glycemic variability on the risks of macrovascular and microvascular events and all-cause mortal- ity in type 2 diabetes: the ADVANCE trial. Diabetes Care 2014;
37:2359-65.
33. Gorst C, Kwok CS, Aslam S, Buchan I, Kontopantelis E, Myint PK, Heatlie G, Loke Y, Rutter MK, Mamas MA. Long-term glycemic variability and risk of adverse outcomes: a systematic review and meta-analysis. Diabetes Care 2015;38:2354-69.
34. Rema M, Srivastava BK, Anitha B, Deepa R, Mohan V. Associ- ation of serum lipids with diabetic retinopathy in urban South Indians: the Chennai Urban Rural Epidemiology Study (CURES) Eye Study 2. Diabet Med 2006;23:1029-36.
35. Klein R, Sharrett AR, Klein BE, Moss SE, Folsom AR, Wong TY, Brancati FL, Hubbard LD, Couper D; ARIC Group. The association of atherosclerosis, vascular risk factors, and reti- nopathy in adults with diabetes: the atherosclerosis risk in com- munities study. Ophthalmology 2002;109:1225-34.
36. Tapp RJ, Shaw JE, Harper CA, de Courten MP, Balkau B, Mc- Carty DJ, Taylor HR, Welborn TA, Zimmet PZ; AusDiab Study Group. The prevalence of and factors associated with diabetic retinopathy in the Australian population. Diabetes Care 2003;
26:1731-7.
37. Klein BE, Moss SE, Klein R, Surawicz TS. The Wisconsin Epi- demiologic Study of Diabetic Retinopathy. XIII. Relationship of serum cholesterol to retinopathy and hard exudate. Oph- thalmology 1991;98:1261-5.
38. Yun JS, Ko SH, Kim JH, Moon KW, Park YM, Yoo KD, Ahn YB. Diabetic retinopathy and endothelial dysfunction in pa- tients with type 2 diabetes mellitus. Diabetes Metab J 2013;37:
262-9.
39. Wong TY, Klein R, Islam FM, Cotch MF, Folsom AR, Klein BE, Sharrett AR, Shea S. Diabetic retinopathy in a multi-ethnic co- hort in the United States. Am J Ophthalmol 2006;141:446-55.
40. Gaede P, Vedel P, Parving HH, Pedersen O. Intensified multi- factorial intervention in patients with type 2 diabetes mellitus and microalbuminuria: the Steno type 2 randomised study.
Lancet 1999;353:617-22.
41. Colhoun HM, Betteridge DJ, Durrington PN, Hitman GA, Neil HA, Livingstone SJ, Thomason MJ, Mackness MI, Charlton- Menys V, Fuller JH; CARDS investigators. Primary prevention of cardiovascular disease with atorvastatin in type 2 diabetes in the Collaborative Atorvastatin Diabetes Study (CARDS): mul- ticentre randomised placebo-controlled trial. Lancet 2004;364:
685-96.
42. Salinero-Fort MA, San Andres-Rebollo FJ, de Burgos-Lunar C, Arrieta-Blanco FJ, Gomez-Campelo P; MADIABETES Group.
Four-year incidence of diabetic retinopathy in a Spanish co- hort: the MADIABETES study. PLoS One 2013;8:e76417.
43. Bergerhoff K, Clar C, Richter B. Aspirin in diabetic retinopa- thy: a systematic review. Endocrinol Metab Clin North Am 2002;31:779-93.
44. Tung TH, Chen SJ, Shih HC, Chou P, Li AF, Shyong MP, Lee FL, Liu JH. Assessing the natural course of diabetic retinopa- thy: a population-based study in Kinmen, Taiwan. Ophthalmic Epidemiol 2006;13:327-33.
45. Gong Q, Gregg EW, Wang J, An Y, Zhang P, Yang W, Li H, Li H, Jiang Y, Shuai Y, Zhang B, Zhang J, Gerzoff RB, Roglic G, Hu Y, Li G, Bennett PH. Long-term effects of a randomised trial of a 6-year lifestyle intervention in impaired glucose tolerance on diabetes-related microvascular complications: the China Da Qing Diabetes Prevention Outcome Study. Diabetologia 2011;
54:300-7.