ORIGINAL ARTICLE
SSPs 시나리오에 따른 미국쥐손이 적합 서식지 분포 예측
Prediction of the spatial distribution of suitable habitats for Geranium carolinianum under SSP scenarios
오영주1ㆍ김명현2*ㆍ최순군2ㆍ김민경3ㆍ어진우2ㆍ엽소진2ㆍ방정환4ㆍ이용호5
1(주)미래환경생태연구소 소장, 2국립농업과학원 기후변화평가과 농업연구사, 3국립농업과학원 기후변화평가과 농업연구관,
4국립농업과학원 기후변화평가과 전문연구원, 5고려대학교 오정에코리질리언스 연구소 연구교수
Young-Ju Oh1, Myung-Hyun Kim2*, Soon-Kun Choi2, Min-Kyeong Kim3, Jinu Eo2, So-Jin Yeob2, Jeong Hwan Bang4 and Yong Ho Lee5
1Director, Institute for Future Environmental Ecology Co., Ltd., Jeonju 54883, Republic of Korea
2Researcher, Climate Change Assessment Division, National Institute of Agricultural Science, Wanju 55365, Republic of Korea
3Senior Researcher, Climate Change Assessment Division, National Institute of Agricultural Science, Wanju 55365, Republic of Korea
4Postdoctoral Researcher, Climate Change Assessment Division, National Institute of Agricultural Science, Wanju 55365, Republic of Korea
5Research Professor, O-jeong-Eco-Resilience Institute, Seoul 02841, Republic of Korea
Received 17 September 2021, revised 01 October 2021, accepted 01 October 2021, published online 05 October 2021
ABSTRACT: This study was carried out to identify the factors affecting the distribution of suitable habitats for Geranium carolinianum, which was naturalized in South Korea, and to predict the changes of distribution in the future. We collected occurrence data of G. carolinianum at 68 sites in South Korea, and applied the MaxEnt model under climate change scenarios (SSP2-4.5, and SSP5-8.5). Precipitation seasonality (bio15), mean temperature of warmest quarter (bio10), and mean temperature of driest quarter (bio09) had high contribution for potential distribution of G. carolinianum. According to climate change scenarios, high suitable habitats of G. carolinianum occupied 6.43% of the land of South Korea in historical period (1981~2010), and 92.60% under SSP2-4.5, and 98.36% undr SSP5-8.5 in far future (2071~2100).
KEYWORDS: Agroecosytem, Climate change, Naturalized plant, MaxEnt, SSPs
요 약: 본 연구는 최근 국내에 귀화식물로 기록된 미국쥐손이의 적합 서식지의 분포에 영향을 미치는 요인을 파악하고, 미래의 변화를 예측하고자 수행되었다. 전국을 대상으로 총 68개 지점에서 미국쥐손이의 출연 자료를 수집하고 MaxEnt 모델을 적용하여 기준년대(1981~2010)와 기후시나리오에 따른 미래의 적합 서식지 분포를 예측했다. 미국쥐손이의 분포에는 강수량 계절성(bio15), 가장 따뜻한 분기의 평균기온(bio10), 가장 건조한 분기의 평균기온(bio09)가 크게 기여하는 것으로 나타났다. 기후변화에 따라 미국쥐손이의 높은 수준의 적합 서식지는 기준년도에 우리나라 면적의 6.43%를 차지하였고, 먼미래(2071~2100)에는 SSP2-4.5 하에서 92.60%까지, SSP5-4.8 하에서 98.36%까지 차지하는 것으로 예측되었다.
핵심어: 농업생태계, 기후변화, 귀화식물, MaxEnt, SSPs
*Corresponding author: [email protected], ORCID 0000-0002-55909-6622
ⓒ Korean Society of Ecology and Infrastructure Engineering. All rights reserved.
This is an open-access article distributed under the terms of the Creative Commons Attribution Non-Commercial License (http://creativecommons.org/licenses/by-nc/3.0/), which permits unrestricted non-commercial use, distribution, and reproduction in any medium, provided the original work is properly cited.
154
1. 서 론
기온상승과 같은 기후변화는 생물의 휴면타파, 개화 기, 개엽기, 출현시기, 철새이동, 산란 등 생물계절 (phen- ology)에 큰 혼란을 줄뿐만 아니라 (Hegland et al. 2009), 지리적 분포범위를 크게 변화시키는 (Foden et al. 2008, Hegland et al. 2009) 등 생물다양성과 생태계에 매우 부정적이며 불가역적인 영향을 미치는 것으로 밝혀졌 다. 많은 선행 연구에서 기후변화가 다양한 생물종의 적합 서식지를 변화시킨다는 것을 보고하였다 (Sambaraja et al. 2012, IPCC 2014, Biber-Freudenberger et al.
2016, Jo et al., 2017).
국가 간 물자 및 인구 이동 등 교류가 활발해지면서 국내 외래식물 (alien/exotic plant)이 증가하고 있다.
즉, 의도적 또는 비의도적으로 국외에서 국내로 새롭게 유입된 도입식물 (introduced plant)과 도입 후 국내 환 경에 적응하여 정착한 귀화식물 (naturalized plant)이 급속히 증가하고 있다 (Lee et al. 2011). 우리나라의 귀 화식물은 1980년대 110분류군에서 2010년대에 약 300여종으로 증가한 것으로 확인되었다 (Ryu et al.
2017). 국가 간 교류 증대 이외에 새로운 외래식물의 유 입 및 정착을 증가시키는 요인으로 기후변화를 들 수 있 을 것이다. 기후변화는 기온, 강수량 등 식물의 서식지 환경을 변화시키고, 변화된 서식지 환경에 잘 적응한 외래식물들은 정착하고 그 분포역을 확대해 나갈 것이 다. 다양한 외래식물의 정착은 그 지역의 식물 종다양 성을 감소시키고, 양분순환율을 변화시킴으로써 생태 계서비스와 인간 복지에 영향을 주는 것으로 알려졌다 (Hejda et al. 2009, Vilà et al. 2011). 최근에는 기후변 화와 관련한 외래식물의 분포 변화 및 관리방안 등에 관 한 연구가 국내외에서 활발히 이루어지고 있다 (Hellmann et al. 2008, Cho and Lee 2015, Hoveka et al. 2016, Lee et al. 2016, Rockwell-Postel et al. 2020, Fang et al.
2021).
종분포모델 (SDM, species distribution model)은 환경변수를 종 출현 기록과 연관시켜 생태학적 또는 진 화적 원인에 대한 통찰력을 얻거나 대규모 범위에서 서 식지의 적합성을 예측하는데 도움이 된다 (Elith and Leathwick, 2009). SDM 모델 중 MaxEnt는 최대 엔트 로피 (maximum entropy)의 원리를 이용하여 존재 유 무를 환경변수와 연관시켜 종의 생태적 지위 및 잠재적 인 지리 분포를 추정한다 (Phillips et al., 2006). MaxEnt
는 사용이 간편하고, 부존재 자료가 필요 없을 뿐만 아 니라, 적은 자료와 불규칙하게 샘플링된 자료 및 사소 한 위치 오류에도 강력한 결과를 얻을 수 있어서 국내외 많은 학자들에 의해서 널리 사용되고 있다 (Elith et al., 2006, Hernandez et al., 2006, Person et al., 2007, Ortega-Huerta and Peterson 2008, Nam et al., 2018).
특히, 희귀하거나 멸종위기종의 보존 문제의 잠재적 분 포를 모델링하고 (Wilting et al., 2010, Clements et al., 2012), 생태학적 지위를 분리하고 (Kalkvik et al., 2012), 기후변화 따른 향후 분포를 예측하는데 (Hu and Jiang, 2011) 매우 인기 있는 도구이다.
미국쥐손이 (Geranium carolinianum)는 북아메리 카 동부가 원산으로 일년생 초본이며 (Aedo 2000), 중 국, 일본, 북유럽, 남아메리카, 대만 등에서도 도입되어 정착한 것으로 보고되어 있다 (Gama-Arachchige et al.
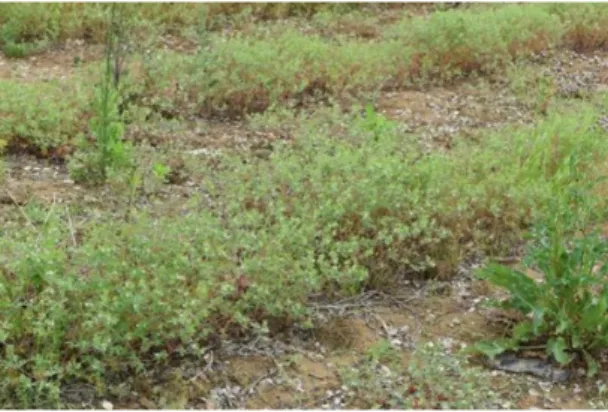
2011, Liu et al. 2018). 우리나라에는 1995년에 제주도 와 서울에서 처음 귀화식물로 보고되었고 (Jeon 1995), 2001년에는 제주도와 남부・중부 지방에 분포하는 것 으로 알려졌다 (Park 2001). 미국쥐손이는 미국, 중국 에서 딸기, 유체, 밀 등의 재배에 심각한 피해를 주는 것 으로 알려져 있으며 (Liu et al., 2018, Sharp and Boyd 2020), 국내에서도 현재 농경지 내외부에서 집단적으 로 번성하고 있는 상황이다 (Fig. 1). 국내에서 현재까 지 미국쥐손이에 의한 작물의 피해는 보고되어 있지 않 지만, 국내에 도입 및 정착 후 단기간에 국내 환경에 적 응하여 확산하는 것을 볼 때, 향후 자연 생태계뿐만 아 니라 작물의 생산성에도 영향을 미칠 가능성이 있을 것 으로 판단된다.
따라서, 본 연구에서는 국내에 유입되어 서식하고 있
Fig. 1. Image of Geranium carolinianum population growing in crop land.
는 미국쥐손이에 대한 출현 지점과 출현 지점의 기후 환 경 자료를 기반으로 SSPs 시나리오에 따른 미래 적합 서식지의 변화를 예측하였다.
2. 연구 방법
2.1 종 출현 위치 자료
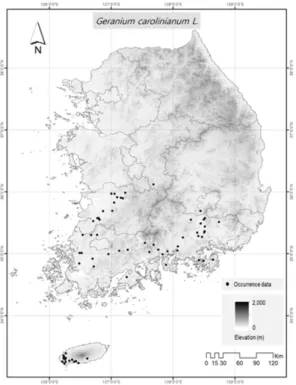
미국쥐손이의 출현 위치 자료는 직접 현장 조사와 Global Biodiversity Information Facility database (GBIF, http://www.gbif.org/)에서 수집된 자료를 통 합하여 사용했다. 현장 조사는 2018년부터 2020년 우 리나라 전국을 대상으로 무작위로 수행하여 출현한 총 40지점의 GPS 좌표를 기록했다. GBIF에서는 총 28지 점의 자료를 획득하여 총 68개 출현지점을 수집했다 (Fig. 2).
2.2 환경변수
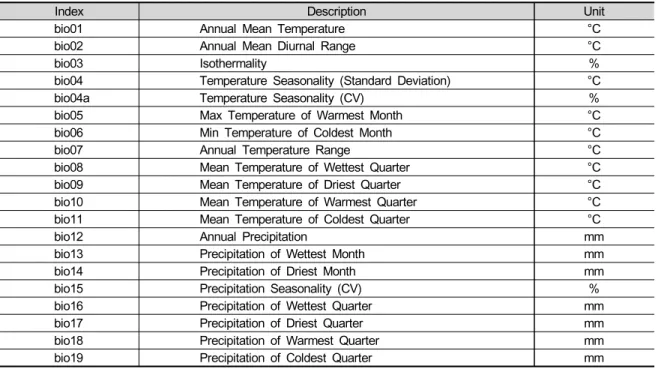
본 연구에서는 세계기후연구프로그램 (World Climate Research Programme, WCRP)의 CMIP6 (Coupled Model Intercomparison Project Phase 6)를 통해 제공 되는 전 지구 규모의 SSPs (Shared Socioeconomic
Pathways) 시나리오 자료를 사용하였다 (https://esgf- node.llnl.gov/search/cmip6/). IPCC 6차평가보고서 에서는 SSP1-2.6, SSP2-4.5, SSP3-7.0, SSP5-8.5를 표준 경로로 사용하고 있으며, 본 연구에서는 그 중 SSP2-4.5와 SSP5-8.5를 사용하였다. SSP2-4.5는 기 후변화 완화 및 사회경제 발전 정도를 중간 단계로 가 정, 그리고 SSP5-8.5는 산업기술의 빠른 발전에 중심 을 두어 화석연료 사용이 높고 도시 위주의 무분별한 개 발이 확대될 것으로 가정한 기후변화 시나리오이다. 환 경변수는 11개 GCM (Global Climate Model) (GFDL- ESM4, MRI-ESM2-0, CNRM-CM6-1, CNRM-ESM2-1, IPSL-CM6A-LR, MPI-ESM1-2-HR, UKESM1-0-LL, ACCESS-CM2, CanESM5, INM-CM4-8, INM-CM5-0) 을 이용하여 생산한 3km 공간해상도의 20개 생물기후 변수 (bioclimatic variables)를 사용하였다 (Table 1, O'Donnell and Ignizio 2012). CIMP6의 과거 재현기 간은 2014년에 끝나는 것으로 설계되어 있으며, 2015 년 이후 기간에 대하여 SSP 시나리오별 전망자료가 제 공된다. 따라서, 본 연구에서는 2100년을 기준으로 동 일하게 30년 기간을 고려할 수 있도록 다음과 같이 기 준년대 및 미래 구간을 구분했다: 기준년대 (Historical period, 1981 - 2010), 근미래 (Near future, 2011 - 2040), 중미래 (Mid future, 2041 - 2070), 먼미래 (Far future, 2071 - 2100).
모델 구동에 있어서 너무 많은 환경변수를 사용하는 것은 계산 시간 등 효율성에 영향을 미치며, 또한 상관 성이 높은 변수의 사용은 결과 해석에 영향을 미친다 (Heikkinen et al. 2006, Dormann et al., 2013). 따라서, 본 연구에서는 초기모델에서 얻어진 각 변수의 퍼센트 기여율과 피어슨 상관계수를 이용하여 모델에 사용할 환경변수를 줄이고 적절한 변수를 선정했다. 우선 초기 모델을 통하여 얻어진 결과에서 변수의 기여도가 1 미 만인 변수를 제거했다. 초기모델에서는 ‘Random per- centage’를 25로 설정하고, ‘Create response curves’,
‘Make pictures of predictions’, 및 ‘Do jackknife to measure variable importance’를 선택하고, 나머지 설 정 값은 기본으로 하였다. 다음으로 1차 선정된 변수들 중 다중공선성을 가진 변수를 제거하기 위해 피어슨 상 관계수를 확인했다. 만약 변수들 사이에 상관관계가 높 은 경우는 (|r|>0.85) 초기모델 결과에서 기여도가 높은 하나의 변수만 선정했다.
Fig. 2. Spatial distribution of occurrence records of G.
carolinianum in South Korea.
2.3 분포 모델링
MaxEnt에는 feature class와 regularization multiplier 라는 사용자가 변경할 수 있는 주요 매개변수가 있다.
Feature는 복잡한 관계를 모델링할 수 있도록 모델에 사용된 다른 독립변수들의 수학적 변화의 종류를 의미 한다 (Elith et al. 2010). 이러한 feature classes에는 L (linear), Q (quadratic), P (product), T (threshold), H (hinge), C (categorical) 6개가 있다. Regularization muliplier는 모델링에 사용된 feature class의 강도를 제 어하여 모델의 복잡성 또는 과적합을 방지할 수 있다 (Elith et al., 2010, Morales et al., 2017). MaxEnt의 default parameters setting으로 분포 모델을 만들 수 있 지만, 항상 최적의 모델을 만드는 것은 아니다 (Morales et al. 2017). 따라서 최적의 모델을 만들기 위해서는 여 러 개의 다른 features 조합과 regularization multiplier 의 설정을 통해 최적의 모델을 선택할 필요가 있다.
본 연구에서는 6개의 feature combination (L, LQ, H, LQH, LQHP, LQHPT)과 8개의 regularization parameters (0.5, 1, 1.5, 2, 2.5, 3, 3.5, 4)를 이용하여 전 체 48개의 후보 모델을 만들었다. 최적의 모델을 선택 하기 위해 MaxEnt (version 3.4.4)를 dismo package (Hijman et al. 2017)을 통해 통계프로그램 R에 탑재하
여 ENMeval package (Muscarella et al. 2014)와 함께 구동하여 얻었고, 생성된 모델 중 AICc (corrected Akaike information criterion) 값이 가장 작은 모델을 최적 모 델로 선정하였다.
MaxEnt 모델에서 한 가지 기본적인 가정은 평가 대 상 지역이 전체적으로 또는 무작위로 조사되었다는 것 이다 (Phillips et al. 2009). 하지만, 실제 모델에 사용 되는 자료는 공간적으로 편향되어 있는 경우가 많다 (Phillips et al. 2009, Yuckulic et al. 2013, Kramer- Schadt et al. 2013). 따라서 본 연구에서는 bias layer를 생성하여 모델 구동에 사용했다.
최종 모델에서는 최적 모델에서 선정된 features를 선 택하고, ‘regularization multiplier’에 값을 입력하였다. 또 한, ‘Replicated run type’은 ‘Crossvalidate’로 ‘Replicates’
는 10, ‘Max number of background points’는 10,000 으로 설정하고 ‘Bias file’에 앞에서 생성한 bias layer를 추가하였다. 모델링 경과 얻어진 AUC값의 범위는 0.5 에서 1사이이며, 값이 클수록 모형의 예측이 향상된다.
모델 예측 정확도는 AUC 값에 따라 5등급으로 구분될 수 있다 (Swets 1988): 0.5 - 0.6, fail; 0.6 - 0.7, poor; 0.7 - 0.8, fair; 0.8 - 0.9, good; 0.9 - 1.0, excellent. 각 생물 기후변수의 중요도를 평가하기 위하여 Jackknife 검정 을 수행했고, 반응곡선 (response curves)을 이용하여
Table 1. List of environmental variables used in the model development
Index Description Unit
bio01 Annual Mean Temperature °C
bio02 Annual Mean Diurnal Range °C
bio03Isothermality %
bio04 Temperature Seasonality (Standard Deviation) °C
bio04a Temperature Seasonality (CV) %
bio05 Max Temperature of Warmest Month °C
bio06 Min Temperature of Coldest Month °C
bio07 Annual Temperature Range °C
bio08 Mean Temperature of Wettest Quarter °C
bio09 Mean Temperature of Driest Quarter °C
bio10 Mean Temperature of Warmest Quarter °C
bio11 Mean Temperature of Coldest Quarter °C
bio12 Annual Precipitation mm
bio13Precipitation of Wettest Month mm
bio14 Precipitation of Driest Month mm
bio15 Precipitation Seasonality (CV) %
bio16 Precipitation of Wettest Quarter mm
bio17 Precipitation of Driest Quarter mm
bio18 Precipitation of Warmest Quarter mm
bio19 Precipitation of Coldest Quarter mm
각 환경변수 값과 분포확률의 관계를 파악하였다 (Phillips et al. 2006). 변수의 중요성은 기여도 (Percent Contribution) 와 중요도 (Permutation Importane)를 통해서 측정될 수 있다. 기여도는 모델의 훈련과정에서 각 변수의 기 여도를 바꿔가며 최적의 결과를 도출할 수 있도록 하는 방법이며, 중요도는 무작위 자료에 대한 모델 훈련 시 AUC 값을 감소시키는 변수의 중요성을 나타낸다 (Gill and Sangermano 2016, Cho et al. 2020). MaxEnt 모델 링의 결과는 지표생물의 서식 적합성을 0에서 1사이로 표시한 것으로 서식지의 분포변화를 확인하기 위해 적 합성을 동일한 간격 접근법 (equal interval approach) 을 사용하여 5등급으로 구분하여 지도화하였다: 0 - 0.2 (non-suitable area), 0.2 - 0.4 (low-suitability area), 0.4 - 0.6 (general-suitability area), 0.6 - 0.8 (medium- suitability area), 0.8 - 1 (high-suitability area) (Li et al., 2020).
3. 결과 및 고찰
3.1 변수 및 최적 모델 선정
초기 모델 구동 및 변수 사이의 상관관계 분석을 통
하여(Table 2) 최종 모델 구동을 위한 환경변수로 bio03, bio09, bio10, bio13, bio15 및 bio19가 최종 선 정되었다(Table 3). bio03은 bio02, bio09는 bio01, bio04, bio04a, bio06, bio07 및 bio11, bio10은 bio05 와 bio08, bio13은 bio12, bio16 및 bio18, bio19는 bio17과 높은 상관관계를 가지는 것으로 확인되었다 (Table 2).
후보 모델 48개 중 최적의 모델로 L0.5가 선정되었 다. 즉, feature class가 L(linear)이고 regularization multiplier 값이 0.5인 조합이 가장 낮은 AICc값을 나타 냈다. 최종 선정된 L0.5 모델을 이용하여 미국쥐손이의
Table 2. Pearson correlation coefficient of environmental variables
bio01 bio02 bio03 bio04 bio04a bio05 bio06 bio07 bio08 bio09 bio10 bio11 bio12 bio13 bio14 bio15 bio16 bio17 bio18 bio19 bio01 1.000 -0.559 -0.333 -0.762 -0.789 0.8496 0.954 -0.776 0.703 0.939 0.842 0.964 -0.002 -0.163 0.052 -0.436 -0.145 0.175 -0.266 0.250 bio02 1.000 1.000 0.923 0.698 0.698 -0.244 -0.629 0.673 -0.064 -0.652 -0.222 -0.634 -0.324 -0.164 -0.505 0.512 -0.159 -0.565 -0.008 -0.584 bio03 1.000 1.000 1.000 0.393 0.392 -0.159 -0.344 0.355 -0.008 -0.390 -0.136 -0.357 -0.363 -0.281 -0.463 0.285 -0.256 -0.528 -0.135 -0.541 bio04 1.000 1.000 1.000 1.000 0.999 -0.321 -0.916 0.997 -0.103 -0.901 -0.297 -0.905 -0.202 0.048 -0.366 0.719 0.009 -0.443 0.176 -0.488 bio04a 1.000 1.000 1.000 1.000 1.000 -0.361 -0.932 0.997 -0.145 -0.916 -0.337 -0.922 -0.188 0.060 -0.351 0.711 0.022 -0.430 0.187 -0.478 bio05 1.000 1.000 1.000 1.000 1.000 1.000 0.670 -0.341 0.920 0.674 0.995 0.690 -0.105 -0.145 -0.199 -0.077 -0.152 -0.039 -0.201 0.047 bio06 1.000 1.000 1.000 1.000 1.000 1.000 1.000 -0.926 0.479 0.984 0.652 0.999 0.077 -0.136 0.193 -0.599 -0.106 0.303 -0.253 0.370 bio07 1.000 1.000 1.000 1.000 1.000 1.000 1.000 1.000 -0.139 -0.904 -0.320 -0.914 -0.151 0.098 -0.345 0.720 0.058 -0.403 0.218 -0.444 bio08 1.000 1.000 1.000 1.000 1.000 1.000 1.000 1.000 1.000 0.449 0.945 0.503 -0.311 -0.277 -0.318 0.108 -0.289 -0.269 -0.264 -0.225 bio09 1.000 1.000 1.000 1.000 1.000 1.000 1.000 1.000 1.000 1.000 0.647 0.983 0.152 -0.059 0.257 -0.606 -0.037 0.399 -0.189 0.471 bio10 1.000 1.000 1.000 1.000 1.000 1.000 1.000 1.000 1.000 1.000 1.000 0.674 -0.157 -0.191 -0.220 -0.057 -0.195 -0.091 -0.235 -0.015 bio11 1.000 1.000 1.000 1.000 1.000 1.000 1.000 1.000 1.000 1.000 1.000 1.000 0.076 -0.132 0.182 -0.583 -0.104 0.294 -0.250 0.362 bio12 1.000 1.000 1.000 1.000 1.000 1.000 1.000 1.000 1.000 1.000 1.000 1.000 1.000 0.937 0.556 -0.146 0.960 0.783 0.888 0.827 bio13 1.000 1.000 1.000 1.000 1.000 1.000 1.000 1.000 1.000 1.000 1.000 1.000 1.000 1.000 0.370 0.190 0.991 0.608 0.969 0.664 bio14 1.000 1.000 1.000 1.000 1.000 1.000 1.000 1.000 1.000 1.000 1.000 1.000 1.000 1.000 1.000 -0.650 0.398 0.892 0.336 0.773 bio15 1.000 1.000 1.000 1.000 1.000 1.000 1.000 1.000 1.000 1.000 1.000 1.000 1.000 1.000 1.000 1.000 0.120 -0.576 0.246 -0.513 bio16 1.000 1.000 1.000 1.000 1.000 1.000 1.000 1.000 1.000 1.000 1.000 1.000 1.000 1.000 1.000 1.000 1.000 0.623 0.972 0.674 bio17 1.000 1.000 1.000 1.000 1.000 1.000 1.000 1.000 1.000 1.000 1.000 1.000 1.000 1.000 1.000 1.000 1.000 1.000 0.525 0.972 bio18 1.000 1.000 1.000 1.000 1.000 1.000 1.000 1.000 1.000 1.000 1.000 1.000 1.000 1.000 1.000 1.000 1.000 1.000 1.000 0.556 bio19 1.000 1.000 1.000 1.000 1.000 1.000 1.000 1.000 1.000 1.000 1.000 1.000 1.000 1.000 1.000 1.000 1.000 1.000 1.000 1.000 Values higher than 0.85 are set in bold face.
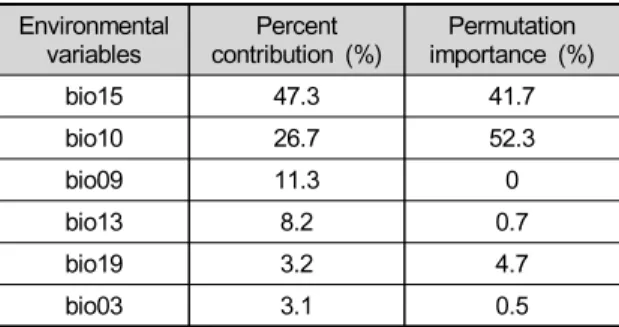
Table 3. Relative importance of environmental variables in MaxEnt model
Environmental
variables Percent
contribution (%) Permutation importance (%)
bio15 47.341.7
bio10 26.7 52.3
bio09 11.30
bio138.2 0.7
bio19 3.2 4.7
bio033.1 0.5
적합 서식지를 예측했다.
3.2 모델 평가
최종 선정된 L0.5 모델에 대한 10-fold cross-validation 결과, 평균 test AUC 값은 0.8 이상 (good)인 0.858로 계산됨으로써, 본 모델은 신뢰할 수 있고 적합한 성능 을 가진 것으로 판단된다 (Fig. 3, Swets 1988).
미국쥐손이의 분포에 높은 기여도(Percent contribution) 와 중요도 (Permutation importance)를 나타내는 변수 를 확인했다. 기여도는 bio15 (47.3%), bio10 (26.7%), bio09 (11.3%) 순으로 높게 나타났고, 중요도는 bio10 (52.3%)와 bio15 (41.7%)이 높게 나타났다 (Table 3).
이외의 나머지 환경변수들은 10% 이하의 기여도와 중 요도 값을 나타냈다. Jackknife test에서도 bio15, bio10, bio09가 중요한 환경변수로 확인되었다 (Fig. 4).
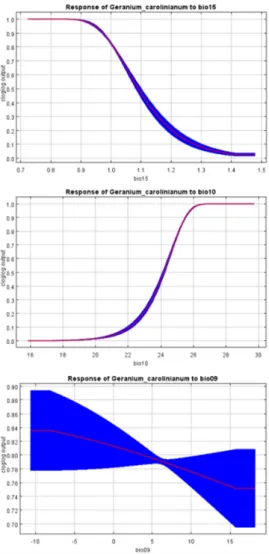
환경변수 중 미국쥐손이의 분포에 높은 기여도 (10%
이상)를 나타내는 bio15, bio10, bio09의 반응곡선을 확인한 결과, bio15와 bio09의 값이 증가할수록 존재 확률은 감소하는 경향을 나타냈다 (Fig. 5). 반면 bio10 의 값이 증가할수록 존재 확률도 함께 증가하는 경향을 나타냈다. 각 변수별 50% 이상의 존재 확률을 나타내 는 범위는 bio15는 1.1 이하, bio10은 24°C 이상, bio09 는 전체 구간인 것으로 예측되었다.
3.3 분포 적합지 예측
MaxEnt 모델을 통해 분석된 기준년대에서 미국쥐 손이의 분포 확률이 높은 지역은 실제 출현한 지역과 유
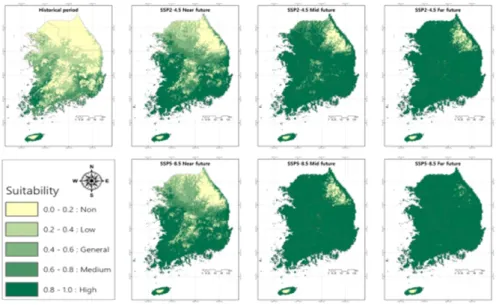
사하게 나타났다. 기준년대에서 일반 이상 (general, medium, high)의 서식지 적합성을 가진 지역은 제주도 와 남해안 그리고 서해안을 따라서 충청남도까지 분포 하는 것으로 나타났다 (Fig. 6). 기준년대에서 서식지
Fig. 3. The ROC (receiver operating characteristic) curve and AUC (area under ROC curve) values by the MaxEnt model for G. carolinianum.
Fig. 4. Importance of environmental variables to G.
carolinianum by jackknife test.
Fig. 5. Response curve of the environmental variables contributing greater than 10% in G. carolinianum’s habitat distribution model. Red lines and blue lines are mean and standard deviation of ten replicated responses, respectively.
적합성 등급별 비율은 비적합지, 낮은 적합지, 일반 적합 지, 중간 적합지, 높은 적합지는 각각 37.05%, 25.26%, 16.25%, 15.02% 및 6.43%로 비적합지가 높은 적합 지보다 5.8배 높게 나타났다 (Table 4). 현재 우리나라 기후조건에서 미국쥐손이는 고도가 높은 산지와 위도 가 높은 강원도와 경기도 동북부 지역에서는 서식하기 에 적합하지 않은 것을 알 수 있다.
미국쥐손이의 적합 서식지에 대한 미래 변동성을 예 측하기 위하여, 모델에 기준년대 대비 미래 기후변화 시나리오 SSP2-4.5와 SSP5-8.5를 투영하였다 (Table 4, Fig. 6). 그 결과, SSP2-4.5에서 미국쥐손이가 서식 하기 어려운 비적합지 면적 비율은 기준년대 37.05%
에서 근미래에 9.89%로 급격히 감소하고, 이후 중미래 3.41%, 먼미래 1.21%로 시간의 경과에 따라 지속적으
로 감소하는 경향을 나타냈다. 낮은 적합지의 경우도 동일하게 감소하는 경향을 나타냈다. 반면에 높은 적합 지 면적 비율은 기준년대 6.43%에서 근미래 43.12%, 중미래 79.83%, 먼미래 92.60%로 시간의 경과에 따라 급격히 증가하는 것으로 나타났다. SSP5-8.5에서 미국 쥐손이가 서식하기 어려운 비적합지 면적 비율은 기준 년대 37.05%에서 근미래에 8.40%, 중미래 1.50%, 먼 미래 0.22%로 지속적으로 감소하는 것으로 나타났고, 이러한 감소 속도는 SSP2-4.5보다 빠른 것이다. 높은 적합지 면적 비율은 기준년대 6.43%에서 근미래 47.88%, 중미래 92.40%%, 먼미래 98.36%로 증가 속도는 SSP2- 4.5보다 빨랐다. SSP2-4.5의 먼미래와 SSP5-8.5의 중 미래에 미국쥐손이는 제주도 한라산의 고위도와 강원 도 고지대 일부를 제외한 우리나라 면적의 90% 이상에
Table 4. The ratio of predicted area to total land area of South Korea for G. carolinianum under climate change using SSP2-4.5 and SSP5-8.5
Suitability Grade
Historical SSP perioda)
SSP2-4.5 SSP5-8.5
Near futureb) Mid futurec) Far futured) Near future Mid future Far future
None (%) 37.05 9.89 3.41 1.21 8.40 1.50 0.22
Low (%) 25.26 13.68 3.21 2.10 10.30 2.04 0.19
General (%) 16.25 16.46 3.44 1.78 16.90 1.79 0.40
Medium (%) 15.02 16.85 10.11 2.31 16.51 2.27 0.84
High (%) 6.43 43.12 79.83 92.60 47.88 92.40 98.36
a)Historical period: 1981 - 2010; b)Near future: 2011 - 2040; c)Mid future: 2041 - 2070; d)Far future: 2071 - 2100.
Fig. 6. Potential distribution of suitable area of G. carolinianum under climate change using SSP2-4.5 and SSP5-8.5 in South Korea. Historical period: 1981-2010; Near future: 2011-2040; Mid future: 2041-2070; Far future: 2071-2100.
서 높은 적합성을 나타냈다.
미국쥐손이는 초원, 길가, 농경지, 휴경지 등 양분이 부족한 건조한 지역을 선호하기 때문에 (Horst 2013), 우리나라에서 미국쥐손이의 빠른 북상 및 서식지 범위 확장은 국내 자생식물 서식지에 상당한 영향을 줄 것이 며, 궁극적으로 생물다양성을 감소시킬 수 있다(Levine et al. 2003, Vilà et al. 2011, Bradley et al. 2010a, Taylor et al. 2012). 또한 농경지 내로 침입 및 번성은 작 물의 생산성 감소 등 농업 현장에서 큰 피해를 일으킬 수 있다 (Cousens and Mortimer 1995, Pimentel 2000).
향후 기후변화는 새로운 외래식물의 국내 도입 및 자연 생태계에서 정착의 가능성을 높일뿐만 아니라 이들의 확산을 촉진시킬 수 있다 (Bradley et al. 2010b, Davidson et al. 2011). 따라서 미국쥐손이를 비롯하여 최근 새롭게 귀화한 식물의 현장 모니터링과 함께 이들 의 분포 변화를 예측함으로써 향후 문제가 될 수 있는 귀화식물을 선발하고 사전에 이들의 확산을 방제할 수 있는 방안을 수립해야 할 것이다.
4. 결 론
최근 활발한 국제 교류와 기후변화 등의 원인으로 국 내로 새롭게 유입되어 정착하는 귀화식물이 증가하고 있다. 이러한 귀화식물의 확산은 국내 생태계에 변화를 초래할 것이다. 본 연구에서는 상대적으로 최근에 귀화 식물로 기록되었지만, 빠르게 확산하고 있는 미국쥐손 이 (Geranium carolinianum)의 기준년대와 미래의 분 포 적합지 예측을 MaxEnt 모델을 이용하여 수행했다.
미국쥐손이의 적합 서식지는 강수량 계절성 (bio15), 가장 따뜻한 분기의 평균기온 (bio10), 가장 건조한 분 기의 평균기온 (bio09)의 환경변수가 크게 기여하는 것 으로 나타났다. 환경변수 bio15와 bio09의 값이 증가할 수록 미국쥐손이의 존재 확률은 감소하는 반면, bio10 의 값이 증가할수록 존재 확률도 증가하는 경향을 나타 냈다. 기준년대 (1981 - 2010)에서 미국쥐손이의 높은 서식지 적합성을 나타내는 지역은 제주도와 남해안 그 리고 서해안의 남부지역을 중심으로 분포하지만, SSP2- 4.5와 SSP5-8.5 시나리오에 따라 미래에는 그 분포 범 위가 북쪽으로 확대되었다. 특히, 기후변화가 관리되지 않는 SSP5-8.5 시나리오 하에서는 중미래에 남한면적 의 90% 이상을 차지하는 것으로 전망되었다. 향후 국 가 간 교류가 더 증가하고 기후변화가 지속되면 외래식
물의 유입도 증가할 것으로 판단된다. 국내 자연생태계 의 생물다양성 관리뿐만 아니라 농업생태계에서 작물 의 안정적인 생산을 위하여, 미국쥐손이를 포함한 귀화 식물의 분포 변화를 모니터링하고 예측할 필요성이 있다.
감사의 글
본 연구는 농촌진흥청 공동연구사업(과제번호: PJ 01480801, PJ01480804)의 지원에 의해 이루어진 것임.
References