Nurses' Perception of Patient Safety Culture and Safety Control in Patient Safety Management Activities
Jang, Hee-Eun
1· Song, Yeoungsuk
2· Kang, Hee-Young
31Department of Quality Improvement, Chosun University Hospital
2College of Nursing ․ Research Institute of Nursing Science, Kyungpook National University
3Department of Nursing, Chosun University
Purpose: There have been global initiatives and efforts over the last decade to manage patient safety. Thus aims of this study were to examine university hospital nurses’ perceptions of patient safety culture and levels of safety control, and to identify factors that affect patient safety management activities. Methods: Participants were 222 nurses who had worked as nurses for more than one year and who conducted patient safety management activities at a university hospital. Data were collected using structured questionnaires and were analyzed using descriptive statistics, t-test, one-way ANOVA, Pearson correlation coefficient, and multiple regression analysis with SPSS/WIN 20.0 computer program. Results: General factors which positively impacted nurses' patient safety management were total length of work in nursing, total length of work in present hospital, and experience of a patient safety accident along with safety factors of perception of communication about accident related events and frequency of reporting accident events. These variables explained 45% of the variance in patient safety management activities. Conclusion:
The findings from this study suggest solutions to promote patient safety management activities in hospitals and pro- vide basic background for nursing education intervention strategies to promote safety control and patient safety man- agement activities intended for nurses.
Key Words: Patient safety, Safety control, Safety management, Nurses
Corresponding author: Kang, Hee-Young
Department of Nursing, Chosun University, 309 Pilmun-daero, Dong-gu, Gwangju 614520, Korea.
Tel: +82-62-230-6323, Fax: +82-62-230-6329, E-mail: [email protected] - This study was supported by research fund from Chosun University, 2015.
Received: May 4, 2017 | Revised: Sep 10, 2017 | Accepted: Sep 15, 2017
This is an open access article distributed under the terms of the Creative Commons Attribution Non-Commercial License (http://creativecommons.org/licenses/
by-nc/3.0), which permits unrestricted non-commercial use, distribution, and reproduction in any medium, provided the original work is properly cited.
INTRODUCTION
Patient safety is a cornerstone to high-quality healthcare.
‘Adverse events’ are defined as injures due to medical care.
Adverse events represent a major source of morbidity and mortality throughout the world. It is important to identify and understand adverse events in order to develop policies to reduce harm from medical care [1].A dedication to con- tinuous improvement of patient care should be a top prior- ity of healthcare institutions. The longstanding principle,
‘First do no harm' should serve as a foundation of nursing and medical care, as most injuries are preventable [2].
Patient safety is defined as the avoidance, prevention,
and amelioration of adverse outcomes or injuries stem- ming from health care processes. A patient safety incident is an event or circumstance that could have resulted, or did result, in unnecessary harm to a patient [3].There has been global initiatives and efforts over the last decade to manage patient safety by development of centers for pa- tient safety [4-6].
In Korea, a recent study analyzed the annual health in- surance data provided by the National Health Insurance Service [7]. Through which, it reported that, on average, 9.2% of the 5,744,566 inpatients in Korea experienced an adverse event was hospitalized in 2010, among whom, 39,109 (7.4%) died from medical errors. Furthermore, the
study also emphasized the need for a national patient safe- ty task force to enhance a nationwide monitoring and re- porting system in order to achieve a patient safety-ori- ented system [7].
A patient safety culture can be defined as an integrated pattern of individual and organizational behavior based on shared beliefs and values that continuously seeks to minimize patient harm resulting from the processes of care delivery [8].A culture of safety influences the attitu- des and behaviors of its members with regard to safety regulation adherence within the organization [9]. The per- ception of safety control stems from an individual's cogni- tive ability, which can impact the tasks related to achiev- ing safe results while working and is a meaningful factor for estimating safety performance [10]. A high level of safety control benefits physical and psychological health directly and positively [11]. Furthermore, if the perception of safety control is high, negative consequences or repri- sals for reporting safety issues will be reduced [12].
Experts with sensitive perceptions about patient safety problems have demonstrated in that nurses who have an interest in and perception of patient safety can play im- portant roles in improving the healthcare climate [4,13,14].
Because nurses are the frontline risk managers caring for patients 24 hours a day, investigating and analyzing their patient safety culture, perception of safety control, and pa- tient safety management activities are necessary to pre- vent medical errors and improve patient safety.
Previous studies regarding patient safety have been con- ducted in Korea on topics such as healthcare providers' levels of perception of patient safety culture and studies on patient safety management. Based on a review of these studies, the factors that impact patient safety management activities can be distinguished as individual (age, work experience, position, education level, working hours per week, experience of patient safety education, etc.) and or- ganizational (patient safety culture, safety climate, type of leadership, organization communication, cooperation be- tween doctors and nurses, etc.).Most variations in in- dividual factors are general characteristics of the nurses themselves; however, and it is difficult to find studies on the factors that affect patient safety management activ- ities, including individual factors such as safety control and nurses' perceptions of patient safety culture.
The aims of this study were to examine university hos- pital nurses' perceptions of patient safety culture, levels of safety control, and patient safety management activities;
to identify factors that affect patient safety management activities; and to provide a basic background on nursing intervention for patient safety management. The goal is to
add to nurse-focused dimension to the discussion of safety improvement in healthcare settings.
METHODS 1. Study Design
A cross-sectional study design was used to identify fac- tors that affect the patient safety management activities of nurses at a university hospital in G city, South Korea. A descriptive study was chosen in order to more thoroughly explore the nursing dynamics related to a safety climate while considering the impact of demographic factors.
2. Setting and Samples
Data were collected from the nurses at a university hos- pital from April 25 to May 2, 2014. The participants in this study were nurses working at a 700-bed university hos- pital. The inclusion criteria for this study were the follow- ing: having more than one year of work experience and ac- tively conducting patient safety management activities.
The exclusion criterion was working in departments where there was little physical contact with patients.
The sample size was calculated using the G*power 3.1.2 program [15] which indicated that 189 subjects would be suf- ficient to attain adequate predictive power based on a sig- nificance level (⍺) of .05, a medium effect size of .15, a stati- stical power (1-β) of .95, and the 13 independent variables used for regression analysis. A total of 233 questionnaires were distributed with 226 returned, yielding a response rate of 97%. Of these questionnaires, a total of 222 were used in the final data analysis (4 were incomplete and discarded).
3. Measurements
Three instruments were used to collect data from the nurses in this study regarding issues related to safety in the healthcare environment. In addition, a 14-question general survey containing demographic and task-related characteristics was administered. The safety instruments measured perception of patient safety culture, safety con- trol, and patient safety management activities.
1) Perception of patient safety culture
This instrument contained 44 items [16].It was based on a pilot survey of 1,437 people working at 21 hospitals in 6 states in the US. Items were selected from 69 items in the Hospital Survey on Patient Safety Culture from Agency for Healthcare Research and Quality [17]translated into
Korean by Kim et al. (2004) [18]. Each item was scored from 1 to 5 (1=strongly disagree, 5=strongly agree). A higher score indicated that the respondents' perceptions of pati- ent safety culture was more positive. Negative items were analyzed using reverse coding. When the survey was de- veloped, its reliability, i.e. Cronbach's ⍺, was .77, and Cronbach's ⍺ in this study was .87.
2) Safety control
The researchers in this study translated the safety con- trol survey [19] into Korean after receiving approval from the tool's developer, and back translation was conducted by two bilingual individuals. Two items were modified to reflect feedback from the pilot study. The final tool con- sisted of seven items, each of which was scored from 1 to 6 (1=strongly disagree, 6=strongly agree). Higher scores in- dicated better levels of control with regard to safety. When this survey was developed, its reliability (Cronbach's ⍺) was .85, and Cronbach's ⍺ in this study was .86.
3) Patient safety management activities
To apply the items to general wards as well as intensive care units, the researcher revised and improved the 64 items that Cho [20] had developed based on the hospital ac- creditation evaluation categories developed by the Korea Institute for Healthcare Accreditation [21] and on 6 catego- ries of the International Patient Safety Goal. The ques- tionnaire consisted of 10 categories with a total of 56 items.
Each item was scored from 1 to 5 (1=never, 5=always).
Higher scores indicated higher levels of patient safety man- agement activities. When the survey was developed, its re- liability Cronbach's ⍺ was .96, and Cronbach's ⍺ for this study using the modified version was .97.
4. Ethical consideration
This study was approved by the institutional review board at C university hospital (C***** 2013-01-007-004).
The author explained to participants the purpose and process of this study, and participation in the study was voluntary and anonymous. Additionally, they could with- draw from the study at any time. I encrypted the partici- pants' files with passwords to prevent their information from being exposed and deleted all unnecessary identify- ing information. The participants were given gifts in re- turn for completing the questionnaire.
5. Data analysis
The data were analyzed using SPSS/WIN 20.0. The fol-
lowing analyses were conducted: descriptive statistics, in- dependent t-test, one-way ANOVA, Pearson's correlation coefficients, and multiple linear regression using the enter method.
RESULTS
1. General Characteristics of the Participants
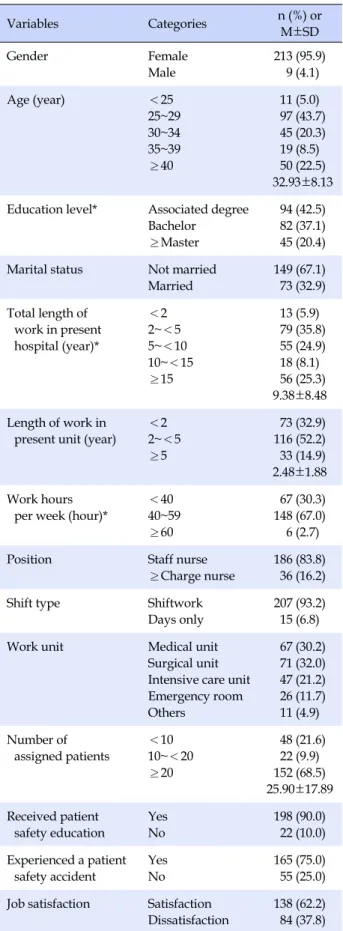
Of the participants who completed this survey, 213 were female (95.9%), and the average age was 32.93±8.13 years.Educational preparation was also solicited showing that 94 individuals (42.3%) had graduated from 3-year colleges.
Most of the participants were unmarried. With regard to total clinical work experience, 79 (35.6%) nurses, the high- est proportion, had worked less than 2~5 years (Table 1).
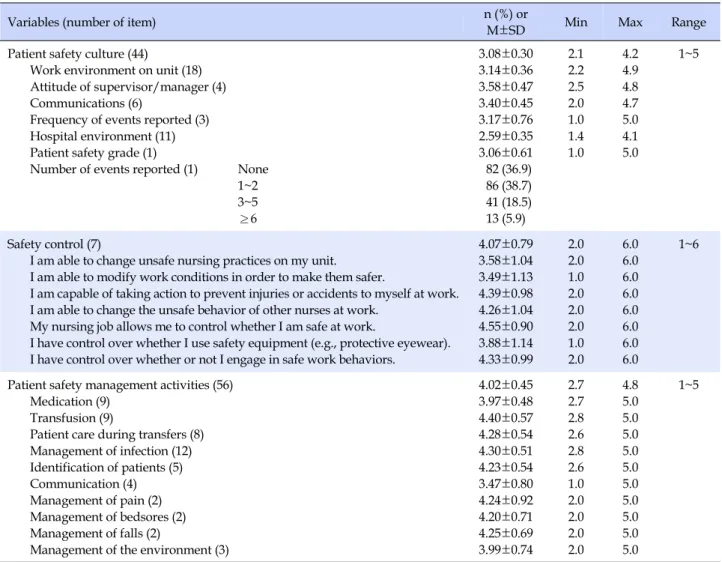
2. Perception of Patient Safety Culture, Safety Con- trol, and Patient Safety Management Activities
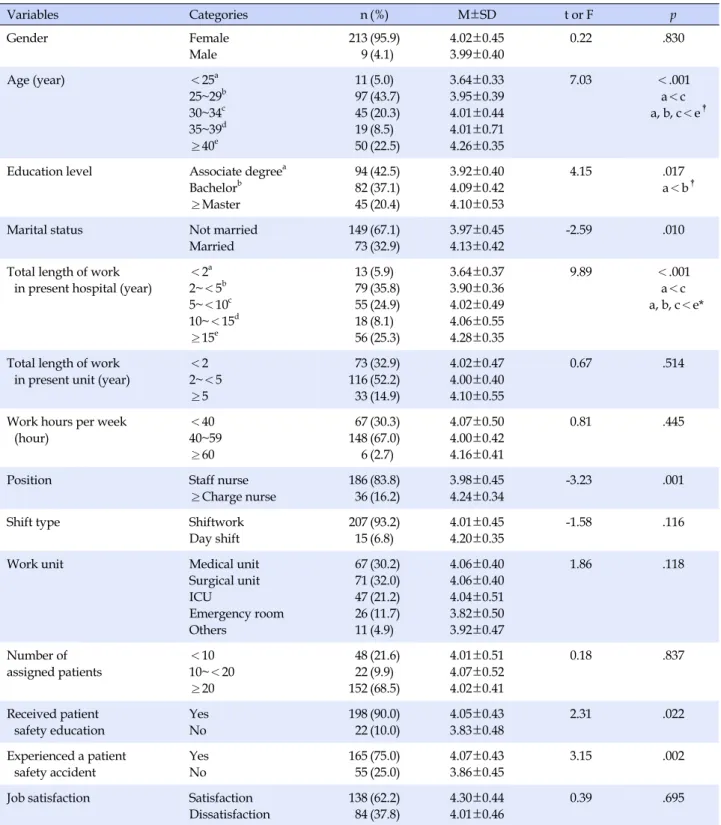
Participants' perceptions of patient safety culture scor- ed a mean average of 3.08±0.30 out of a possible score of 5. Safety control scored an average of 4.07±0.79 of a range of 1~6, and patient safety management activities scored a mean average of 4.02±0.45 of a possible 5 (Table 2).There were significant differences in the participants' levels of patient safety management activities depending on age (F=7.03, p<.001) with those nurses over 40 engag- ing in more safety management activities (4.26±0.35) than any of the other groups. The youngest group engaged in the least number of activities (3.64±0.33). Regarding edu- cation level, nurses with a bachelor's degree engaged in more patient safety management activities than those with an associate degree (F=4.15, p=.017).Married nurses used more safety management activities than their unmarried counterparts (t=-2.59, p=.010), There was a significant dif- ference in total work experience at the present hospital re- lated to safety activities with those who had longest tenure engaging in the most activities (F=9.89, p<.001). Nurses who had experience with patient safety education were significantly more likely to engage in a higher number of safety management activities (t=2.31, p=.022). Finally, nur- ses who had experience with patient safety accidents were significantly more likely to engage in a higher number of safety management activities (t=3.15, p=.002). Job satis- faction, number of patients usually assigned, work unit and shift, years on current unit, and working hours per week did not show any relationship to number of patient safety management activities among nurses in this sample (Table 3).
Table 1. General Characteristics of Participants (N=222)
Variables Categories n (%) or
M±SD
Gender Female
Male
213 (95.9) 9 (4.1)
Age (year) <25
25~29 30~34 35~39
≥40
11 (5.0) 97 (43.7) 45 (20.3) 19 (8.5) 50 (22.5) 32.93±8.13 Education level* Associated degree
Bachelor
≥Master
94 (42.5) 82 (37.1) 45 (20.4) Marital status Not married
Married
149 (67.1) 73 (32.9) Total length of
work in present hospital (year)*
<2 2~<5 5~<10 10~<15
≥15
13 (5.9) 79 (35.8) 55 (24.9) 18 (8.1) 56 (25.3) 9.38±8.48 Length of work in
present unit (year)
<2 2~<5
≥5
73 (32.9) 116 (52.2) 33 (14.9) 2.48±1.88 Work hours
per week (hour)*
<40 40~59
≥60
67 (30.3) 148 (67.0) 6 (2.7)
Position Staff nurse
≥Charge nurse
186 (83.8) 36 (16.2)
Shift type Shiftwork
Days only
207 (93.2) 15 (6.8)
Work unit Medical unit
Surgical unit Intensive care unit Emergency room Others
67 (30.2) 71 (32.0) 47 (21.2) 26 (11.7) 11 (4.9) Number of
assigned patients
<10 10~<20
≥20
48 (21.6) 22 (9.9) 152 (68.5) 25.90±17.89 Received patient
safety education
Yes No
198 (90.0) 22 (10.0) Experienced a patient
safety accident
Yes No
165 (75.0) 55 (25.0) Job satisfaction Satisfaction
Dissatisfaction
138 (62.2) 84 (37.8)
*Non- responses excluded.
3. Correlation between Perception of Patient Safety Culture, Safety Control, and Patient Safety Management Activities
The participants' safety control scores were 4.07 of a possible mean of 6. Patient safety culture subcategories were compared with each other and with safety control scores and patient safety management activities. Participants' pa- tient safety management activities had significant positive correlations with the following all six of the subcategories of patient safety culture: working environment in unit (r=.23, p=.001), attitude of supervisor/manager (r=.32, p<.001), communication (r=.42, p<.001), frequency of events report- ed (r=.20, p=.003), hospital environment (r=.33, p<.001), patient safety grade (r=.13, p=.049). Safety control scores were positively related to patient safety management activ- ities (r=.54, p<.001). Participants' safety control also had significant positive correlations with the following five of the subcategories of patient safety culture: working environ- ment in unit (r=.28, p<.001), attitude of supervisor/mana- ger (r=.27, p<.001), communication (r=.37, p<.001), hospi- tal environment (r=.35, p<.001) and patient safety grade (r=.18, p=.009)(Table 4).
4. Factors Influencing Patient Safety Manage- ment Activities
The predictive regression model of participants' patient safety management activities showed significant results (F=9.48, p<.001), and the R2 was 0.45. The factor that af- fected patient safety management activities the most was total working experience at the present hospital; nurses with more than 15 years of experience (β=.60) conducted more management activities than nurses with less than 2 years of experience. Additionally, safety control (β=.34), communication (β=.20), frequency of events reported (β
=.16), and experience with patient safety accidents (β=.14) were the positive factors influencing patient safety manage- ment activities (Table 5).
DISCUSSION
Nurses tended to score above the midpoint on the safety control scores. The category that scored the lowest was “I am able to modify work conditions to make them safer”.
These results suggest that while nurses may want to chan- ge the working environment, they perceived they were unable to do so and did not have control of that aspect of their employment. As environmental constraints in the workplace are for the most part unchangeable; attempting
Table 2. Descriptive Statistics for Study Variables (N=222)
Variables (number of item) n (%) or
M±SD Min Max Range
Patient safety culture (44)
Work environment on unit (18) Attitude of supervisor/manager (4) Communications (6)
Frequency of events reported (3) Hospital environment (11) Patient safety grade (1)
Number of events reported (1) None 1~2 3~5
≥6
3.08±0.30 3.14±0.36 3.58±0.47 3.40±0.45 3.17±0.76 2.59±0.35 3.06±0.61 82 (36.9) 86 (38.7) 41 (18.5) 13 (5.9)
2.1 2.2 2.5 2.0 1.0 1.4 1.0
4.2 4.9 4.8 4.7 5.0 4.1 5.0
1~5
Safety control (7)
I am able to change unsafe nursing practices on my unit.
I am able to modify work conditions in order to make them safer.
I am capable of taking action to prevent injuries or accidents to myself at work.
I am able to change the unsafe behavior of other nurses at work.
My nursing job allows me to control whether I am safe at work.
I have control over whether I use safety equipment (e.g., protective eyewear).
I have control over whether or not I engage in safe work behaviors.
4.07±0.79 3.58±1.04 3.49±1.13 4.39±0.98 4.26±1.04 4.55±0.90 3.88±1.14 4.33±0.99
2.0 2.0 1.0 2.0 2.0 2.0 1.0 2.0
6.0 6.0 6.0 6.0 6.0 6.0 6.0 6.0
1~6
Patient safety management activities (56) Medication (9)
Transfusion (9)
Patient care during transfers (8) Management of infection (12) Identification of patients (5) Communication (4) Management of pain (2) Management of bedsores (2) Management of falls (2)
Management of the environment (3)
4.02±0.45 3.97±0.48 4.40±0.57 4.28±0.54 4.30±0.51 4.23±0.54 3.47±0.80 4.24±0.92 4.20±0.71 4.25±0.69 3.99±0.74
2.7 2.7 2.8 2.6 2.8 2.6 1.0 2.0 2.0 2.0 2.0
4.8 5.0 5.0 5.0 5.0 5.0 5.0 5.0 5.0 5.0 5.0
1~5
to improve the perception of safety control by placing em- ployees on safety committees where they can make sug- gestions and have input into safety issues can encourage staff to feel ownership of safety and participate in improv- ing the environment [19].
The level of patient safety management activities scored an average of 4.02 of 5. The lowest-scored catego- ry, communication, includes the verbal orders that en- able medical staff to share accurate and complete infor- mation about their patients during the process of treat- ment. Joint Commission Resources announced that near- ly 70% of the root causes of the 3,548 sentinel events they reviewed that had occurred from 1995~2005 were com- munication-based [22]. Because communication problems can lead to serious patient safety accidents, it is necessary to identify the root causes of poor communication and im- prove hospital systems. With regard to patient safety man- agement activities according to participants' general char-
acteristics, subcategories, the higher the age, position, and amount of total work experience in the present hospital, the greater the level of patient safety management activi- ties. This result is similar to the result of Park et al.[23], it can be considered that this result stemmed from the fact that those who had a more advanced age, higher positions, and more work experience had richer clinical work experi- ence and knowledge of patient safety and that this was the reason why these staff members had developed a strong sense of responsibility for safety control as their manage- ment duties expanded.
After verifying the correlation between perception of patient safety culture, safety control, and patient safety management activities, it became clear that participants conducted their management activities better when they had more safety control, with significant correlations be- tween the 6 subcategories of patient safety culture.
In this study, significant predictive factors affecting par-
Table 3. Patient Safety Management Activities by General Characteristics (N=222)
Variables Categories n (%) M±SD t or F p
Gender Female
Male
213 9
(95.9) (4.1)
4.02±0.45 3.99±0.40
0.22 .830
Age (year) <25a
25~29b 30~34c 35~39d
≥40e
11 97 45 19 50
(5.0) (43.7) (20.3) (8.5) (22.5)
3.64±0.33 3.95±0.39 4.01±0.44 4.01±0.71 4.26±0.35
7.03 <.001
a<c a, b, c<e†
Education level Associate degreea Bachelorb
≥Master
94 82 45
(42.5) (37.1) (20.4)
3.92±0.40 4.09±0.42 4.10±0.53
4.15 .017
a<b†
Marital status Not married
Married
149 73
(67.1) (32.9)
3.97±0.45 4.13±0.42
-2.59 .010
Total length of work in present hospital (year)
<2a 2~<5b 5~<10c 10~<15d
≥15e
13 79 55 18 56
(5.9) (35.8) (24.9) (8.1) (25.3)
3.64±0.37 3.90±0.36 4.02±0.49 4.06±0.55 4.28±0.35
9.89 <.001
a<c a, b, c<e*
Total length of work in present unit (year)
<2 2~<5
≥5
73 116 33
(32.9) (52.2) (14.9)
4.02±0.47 4.00±0.40 4.10±0.55
0.67 .514
Work hours per week (hour)
<40 40~59
≥60
67 148 6
(30.3) (67.0) (2.7)
4.07±0.50 4.00±0.42 4.16±0.41
0.81 .445
Position Staff nurse
≥Charge nurse
186 36
(83.8) (16.2)
3.98±0.45 4.24±0.34
-3.23 .001
Shift type Shiftwork
Day shift
207 15
(93.2) (6.8)
4.01±0.45 4.20±0.35
-1.58 .116
Work unit Medical unit
Surgical unit ICU
Emergency room Others
67 71 47 26 11
(30.2) (32.0) (21.2) (11.7) (4.9)
4.06±0.40 4.06±0.40 4.04±0.51 3.82±0.50 3.92±0.47
1.86 .118
Number of assigned patients
<10 10~<20
≥20
48 22 152
(21.6) (9.9) (68.5)
4.01±0.51 4.07±0.52 4.02±0.41
0.18 .837
Received patient safety education
Yes No
198 22
(90.0) (10.0)
4.05±0.43 3.83±0.48
2.31 .022
Experienced a patient safety accident
Yes No
165 55
(75.0) (25.0)
4.07±0.43 3.86±0.45
3.15 .002
Job satisfaction Satisfaction Dissatisfaction
138 84
(62.2) (37.8)
4.30±0.44 4.01±0.46
0.39 .695
*Post hoc comparison=Scheffé́; †Post hoc comparison=Dunnett's T3.
ticipants' patient safety management activities were total work experience in present unit and having had an experi- ence of patient safety accident out of the subcategories in general characteristics of participants and the perception
of communication, frequency of events reported out of the subcategories in patient safety culture and safety control.
Out of them, total work experience in present unit was the most influential factor, nurses who had worked for more
Table 4. Correlation between Study Variables (N=222)
Variables 1 1-1 1-2 1-3 1-4 1-5 1-6 2 3
r (p) r (p) r (p) r (p) r (p) r (p) r (p) r (p) r (p)
1. Patient safety culture 1 1-1. Work environment
in unit
1
1-2. Attitude of
supervisor/manager
.34 (<.001)
1
1-3. Communications .47
(<.001) .44 (<.001)
1
1-4. Frequency of events reported
.36 (<.001)
.12 (.071)
.26 (<.001)
1
1-5. Hospital environment .54
(<.001) .33 (<.001)
.49 (<.001)
.34 (<.001)
1
1-6. Patient safety grade .44
(<.001) .26 (<.001)
.22 (.001)
.13 (.048)
.42 (<.001)
1
2. Safety control .28
(<.001) .27 (<.001)
.37 (<.001)
.07 (.289)
.35 (<.001)
.18 (.009)
1
3. Patient safety management activities
.23 (.001)
.32 (<.001)
.42 (<.001)
.20 (.003)
.33 (<.001)
.13 (.049)
.54 (<.001)
1
Table 5. Factors Influencing Patient Safety Management Activities (N=214)
Variables Categories B SE β t p
(Constant) 1.70 0.29 5.93 <.001
Marital status (ref: not married) Married -0.09 0.09 -.07 -1.01 .314
Education level (ref: associated degree)
Bachelor Master
0.08 -0.09
0.06 0.08
.09 -.08
1.38 -1.02
.170 .308 TLW† in present hospital
(ref: <2 yrs)
2~<5 5~<10 10~<15
≥15
0.27 0.43 0.29 0.60
0.10 0.11 0.14 0.14
.30 .43 .19 .60
2.72 4.08 2.16 4.17
.007
<.001 .032
<.001
Position (ref: staff nurse) ≥Charge nurse -0.17 0.10 -.14 -1.63 .104
Received PSE (ref: no) Yes -0.10 0.09 -.06 -1.12 .264
Experienced PSA (ref: no) Yes 0.14 0.06 .14 2.43 .016
Patient safety culture Work environment in unit Attitude of supervisor/manager Communications
Frequency of events reported Hospital environment Patient safety grade
-0.09 0.08 0.19 0.09 0.10 0.01
0.09 0.06 0.07 0.04 0.09 0.05
-.07 .09 .20 .16 .08 .01
-1.01 1.38 2.96 2.60 1.12 0.12
.314 .170 .003 .010 .264 .909
Safety control 0.19 0.04 .34 4.93 <.001
R2=.45, Adjusted R2=.40, F=9.48, p<.001
*The number of participants was changed from 222 to 214 in the regression analysis; TLW=Total work experience; PSE=Patient safety education;
PSA=Patient safety accident; ref=Reference group.
than 15 years conducted more patient safety management activities than nurses who had worked less than 2 years.
Since experience seems to be a factor in engaging in safety actions, using seasoned nurses to mentor young nurses with an emphasis on safe practice may be a way to influ- ence positive safety practices. Among the participants in this study who had worked fewer than 2 years, the rate of temporary workers was high, and they spent most of their time caring for patients. The reason why nurses with less than 2 years of experience conducted fewer safety mana- gement activities than other nurses is probably related to factors such as job insecurity, limited skills, and the stress from the trial and error of communication which can nega- tively affect patient safety management activities.
Patient safety culture reflects shared beliefs and values which contribute to preventing harm to patients and was reflected in six subscales. This study showed that the sub- scales of communication and perception of frequency of events reported positively affected patient safety manage- ment activities. Because the process of communication in organizations, the structure of decision-making, and re- porting systems are leading factors that affect perceptions of safety and actions [24], effective cooperation and com- munication increase the morale of medical staff and in- crease work satisfaction, efficiency, and safety [16, 25].
Most nurses believe that they only need to report errors that actually occur, and they do not realize that it is also important to report potential errors [26].
In this study, safety control was a positive factor that impacted patient safety management activities. Ninety-six percent of nurses and 90% of doctors, pharmacists, and ad- ministrators believe that nurses have the primary respon- sibility for preventing patient safety accidents [27]. When responding to immediate demands, nurses must initially solve problems when they face overwhelming demand or conflicts that subvert the safety system [28]. In this situa- tion, nurses' safety control enables them to provide correct judgment about actions that conflict with patient safety. A study by Kim et al.[29] predicted that preventive education on nursing errors related to patient safety which incor- porated examples would improve safety control and con- tribute to safety performance. A previous study [30] sug- gested how the personal perception of control was asso- ciated with nursing performance and improved the ability to promote patient safety by emphasizing the importance of the perception of control for outcomes such as achieve- ment, stress, and satisfaction. This is because the level of personal control over tasks has a direct impact on the nur- ses' perception of their ability to assure the patient's well- being.
All of the patient safety culture subcategories were sig- nificantly related to the number of patient safety manage- ment activities in which nurses engaged. Creating a culture of safety appears to promote an environment where safety activities seem to fit. According to the results of this study, total work experience, safety control, communication, fre- quency of events reported, and previous experience with patient safety accidents explained 40% of the variance in participants' patient safety management activities.
Because this study had the regional limitation of only surveying nurses from one university hospital, it is neces- sary to be cautious in extending its results or applying them by making generalizations. Moreover, it is possible that this study's results are not consistent with real-life ac- tions because patient safety management activities were measured by nurses' subjective standards. Finally, the ex- traordinary high response rate might reflect some bias to- ward providing information that the researcher wants to hear.
CONCLUSION
There has been global initiatives and efforts over the last decade to manage patient safety. The purposes of this study were to examine university hospital nurses' percep- tions of patient safety culture, levels of safety control and to identify factors that affect patient safety management activities. General factors which positively impacted nur- ses' patient safety management were total work experi- ence in present hospital, and experiencing a patient safety accident along with safety factors of perception of commu- nication and frequency of events reported. Also, it is iden- tified that safety control is a positive factor which affects patient safety management activities of nurses. These vari- ables explained 45% of the variance in patient safety man- agement activities.
This study suggested solutions to promote patient safe- ty management activities in hospitals. Findings provided the basic background for nursing education intervention strategies to promote safety control and patient safety management activities intended for nurses.
REFERENCES
1. Jha A. World Health Organization; World Alliance for Patient Safety. Summary of the evidence of patient safety: implications for research. Geneva: World Health Organization; 2008.
2. Gil YK, Kim YM, Min J, Jung YY, Choi EK. Safety nursing.
Continuing nurse education material. Seoul: Korean Nurses Association; 2009.
3. World Health Organization; World Alliance for Patient Safety.
The conceptual framework for the international classification for patient safety. Version 1.1-final technical report [Internet].
[updated January 2009; cited January 15, 2016]. Available from:
http://www.who.int/patientsafety/taxonomy/icps_full_rep ort.pdf?ua=1
4. Milligan F, Dennis S. Improving patient safety and incident reporting. Nursing Standard (Royal College of Nursing(Great Britain): 1987). 2004;19(7):33-36.
https://doi.org/10.7748/ns2004.10.19.7.33.c3733
5. Janggokcheon M, Nam EU, Kim MH. Research on construction of safety management system for patients in Japanese hospitals.
Journal of the Korean Hospital Association. 2002;31(6):97-117.
6. National Patient Safety Agency (Great Britain). National re- porting and learning service [Internet]. London: NHS Impro- vement; 2011. [cited March 1, 2015]. Available from:
http://www.nrls.npsa.nhs.uk.
7. Lee SI. Policy suggestions for improving patient safety. Pro- ceedings of 2012 Spring SNUH's Hospital Medical Policy Symposium; May 22, 2012; Seoul National University Hospital, Seoul.
8. Kizer KW. Large system change and culture of safety. Proceed- ings of enhancing patient safety and reducing errors in health care; November 8-10, 1998; Chicago, IL. National Patient Safe- ty Foundation; 1999.
9. Cooper MD. Towards a model of safety culture. Safety Science.
2000;36:111-136.
https://doi.org/10.1016/S0925-7535(00)00035-7
10. Anderson LL, Chen PY, Finlinson S, Krauss AD, Huang YE.
Roles of safety control and supervisory support in work safety.
Paper presented at: Annual Conference of the Society for In- dustrial and Organizational Psychology, 2004; Chicago, IL.
11. Ganster EC, Fusilier MR. Control in the workplace. In: Cooper CL, Robertson I, editors. International review of industrial and organizational psychology. Vol. 3. Palo Alto, CA: Consulting Psychologists Press; 1989. pp. 571-650.
12. Huang YH, Ho M, Smith GS, Chen PY. Safety climate and self-re- ported injury: Assessing the mediating role of employee safety control. Accident Analysis & Prevention. 2006;38:425-433.
https://doi.org/10.1016/j.aap.2005.07.002
13. Abbott PA. Research on patient safety/error reduction: a nurs- ing perspective. Paper presented at: Post-conference for 8th in- ternational congress in nursing informatics; June 25-28, 2004;
Rio De Janeiro, Brazil.
14. Nicklin W, McVeety J. Canadian nurses' perceptions of patient safety in hospitals. Nursing Leadership. 2002;15(3):11-21.
https://doi.org/10.12927/cjnl.2002.19154
15. Faul F, Erdfelder E, Buchner A, Lang A-G. Statistical power analyses using G*Power 3.1: tests for correlation and regression analyses. Behavior Research Methods. 2009;41:1149-1160.
https://doi.org/10.3758/BRM.41.4.1149
16. Kim JG, An KE, Kim MK, Yoon SH. Nurses' perception of error reporting and patient safety culture in Korea. Western Journal of Nursing Research. 2007;29:827-844.
https://doi.org/10.1177/0193945906297370
17. Agency for Healthcare Research and Quality (US). Hospital survey on patient safety culture [Internet]. Rockville: Agency for Healthcare Research and Quality; 2016. [cited September 10, 2016]. Available from:
https://www.ahrq.gov/professionals/quality-patient-safety /patientsafetyculture/hospital/index.html.
18. Kim JG, An KE, Yun SH. Nurses' perception of the hospital envi- ronment and communication process related to patient safety in Korea. Healthcare Informatics Research. 2004;10(1):130-135.
19. Snyder LA, Krauss AD, Chen PY, Finlinson S, Huang Y-H. Oc- cupational safety: application of the job demand-controlsup- port model. Accident Analysis & Prevention. 2008;40:1713-1723.
https://doi.org/10.1016/j.aap.2008.06.008
20. Cho YJ. A study on perception and performance for patient safety management in intensive care unit nurses [master's the- sis]. Suwon: Ajou University; 2012.
21. Korea Institute for Healthcare Accreditation; Standards for healthcare accreditation [ver1.2] for large hospital. Seoul:
Ministry of Health and Welfare, Korea Institute for Healthcare Accreditation; 2011.
22. Joint Commission Resources. Front line of defense: the role of nurses in preventing sentinel events. 2nd ed. Oakbrook Ter- race, Ill: Joint Commission Resources; 2007.
23. Park SJ, Kang JY, Lee YO. A study on hospital nurses' percep- tion of patient safety culture and safety care activity. Journal of Korean Critical Care Nursing. 2012;5(1):44-55.
24. Davenport DL, Henderson WG, Mosca CL, Khuri SF, Mentzer RM. Risk-adjusted morbidity in teaching hospitals correlates with reported levels of communication and collaboration on surgical teams but not with scale measures of teamwork cli- mate, safety climate, or working condition. Journal of the Ame- rican College of Surgeons. 2007;205:778-784.
https://doi.org/10.1016/j.jamcollsurg.2007.07.039
25. Davies HTO, Nutley SM, Mannion R. Organisational culture and quality of health care. Quality in Health Care. 2000;9:111- 119. https://doi.org/10.1136/qhc.9.2.111
26. Cohen H. Shrinking medication errors down to size. Nursing Management. 2001;32(10):25-30; quiz 30-21.
27. Cook AF, Hoas H, Guttmannova K, Joyner JC. An error by any other name. The American Journal of Nursing. 2004;104(6):
32-43; quiz 44.
28. Tucker AL, Edmondson AC. Why hospitals don't learn from failures: Organizational and psychological dynamics that in- hibit system change. California Management Review. 2003;45 (2):55-72. https://doi.org/10.2307/41166165
29. Kim KK, Song MS, Lee JS, Kim YS, Yoon SY, Back JE, et al.
Effects of an education program on prevention of malprac- tice using precedent cases related to patient safety in safety perception, safety control, autonomy and accountability in clinical nurses. Journal of Korean Academy of Nursing Ad- ministration. 2012;18(1):67-75.
https://doi.org/10.11111/jkana.2012.18.1.67
30. Ramanujam R, Abrahamson K, Anderson JG. Influence of workplace demands on nurses' perception of patient safety.
Nursing & Health Sciences. 2008;10:144-150.
https://doi.org/10.1111/j.1442-2018.2008.00382.x