island has the wind power capacity of about 34 MW. It is expected that the capacity in
고경남
Jeju island will be increased by more than 500 MW in the future. While the wind turbine’s use has been increasing in areas of strong wind throughout Korea, several wind turbine generator systems are also experiencing machine trouble that causes them to shut down for long periods of time.
Due to the fact that most of the wind turbines, which operate in Korea are manufactured by Vestas of Denmark, there are not any engineers in the country who can service the machines. When the wind turbine generator systems are rendered inactive, Korean operators must wait for foreign engineers to solve the machine troubles. As a result, it is very important to develop technology for both the operation and the maintenance for the wind turbine generator systems. As of March 2006, the wind power in Japan has the capacity of 1,078 MW.1) Japan has constantly conducted investigations on the operating conditions and the troubles of the wind turbine generator systems.2~4) However, such investigations have yet to be carried out in Korea.
It is common that wind characteristics such as average wind speed and wind direction vary year by year. As a result, the operational characteristics of wind turbines may change alongside the wind characteristics. To improve both the operation and the maintenance technology, it is necessary to clarify ways in which to change the operational characteristics of the machines. Aspects such as electric production and predicted maintenance issues over the years should be considered.
This investigation has been carried out at Hangwon wind farm on Jeju island, where wind turbines were operated commercially for
the first time in Korea. Inter-annual operational characteristics of the wind turbines at Hangwon wind farm were analyzed along with inter-annual wind conditions. Availabilities for tested wind turbines were derived from the operational data of the wind turbines. Furthermore, the causes for the failure/breakdown of the wind turbines were also revealed in this paper.
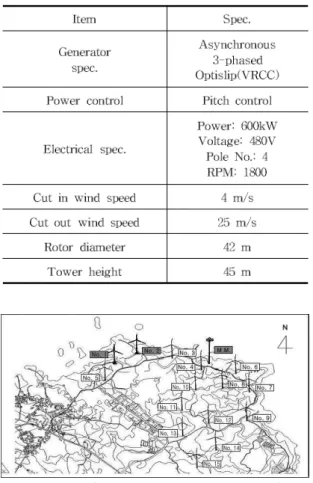
The Hangwon wind farm is located in the northeast part of Jeju island. The farm includes 15 wind turbine generator systems and a meteorological mast (M. M.). The total amount of wind power capacity is about 9.8 MW. The manufacturers of the wind turbines are Vestas and NEG-Micon. Two wind turbine generator systems were monitored for this study. They were erected in 1998 and are the oldest at the Hangwon wind farm. The type of the wind turbine which was tested is the V42, which has the tower height of 45m and wind power capacity of 600 kW. More detailed information about the wind turbine tested is listed in Table 1.
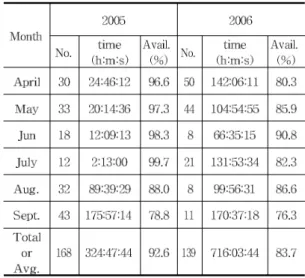
Figure 1 shows the layout of the wind turbines at Hangwon wind farm. Only wind turbines number 1 and number 2 were monitored in order to obtain data regarding electric power production as well as mechanical malfunctions. In the farm, there was a meteorological mast close to the coast, and the 10-minute average wind data was obtained from anemometer on that. The wind turbine stop data were collected through the Vestas Remote Panel, which is the system
operational data were each collected in a six-month period between April 1 and September 30, 2005 and 2006, respectively.
The 10-minute average wind data was directly used for a wind resource estimation.
Due to the malfunction of the anemometer at 45m height in 2005, the power law5) was applied on the basis of the wind data which
for the extrapolation, because the Hangwon wind farm is a coastal area.
Table 2 shows the wind characteristics for each six-month period of both years. The Weibull parameters of c and k, the average wind speed and the average wind power density for the year 2005 are slightly different from those of 2006. Since the average wind speed and the average wind power density of 2006 are higher than those of 2005, it can be concluded that in 2006 the wind resource was higher than in the year 2005.
The average wind speeds for each wind direction are presented in Fig. 2. The average wind speeds of the winds coming from the west-northwest are more than 7 m/s for both years. Also, the average wind speeds vary by wind direction and by year.
m/s
0 2 4 6 8 10N
NE
E
SE S
SW W
NW
2005 2006
고경남
In order to analyze the wind turbine production, turbine stops and their causes were collected through the monitoring system.
Reliability of a wind turbine generator system was evaluated by using availability, which is expressed by the following formula6) :
×
where, T1 : total number of hours during a certain period the number of hours for maintenance or fault situations.
T2 : total number of hours during the period.
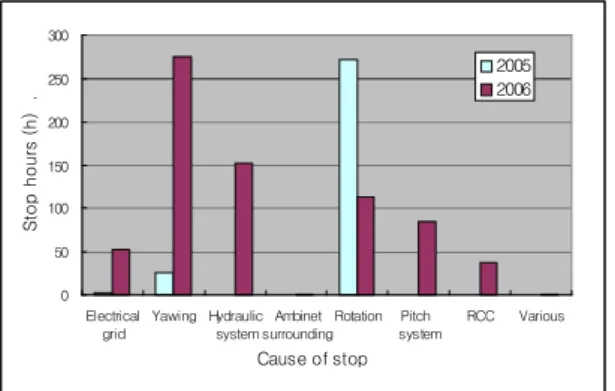
Table 3 indicates availabilities based on the number of stops and the time of stops for turbine number 1. From the Table, it can be seen that the longest time-stop occurred in September for both years. The availabilities averaged over each six-month decreased from 92.6 percent in 2005 to 83.7 percent in 2006.
The same parameters as Table 3 are shown in Table 4 for the number 2 wind turbine. It can be seen that the wind turbine stopped for the longest time in July, 2005 and in August, 2006, respectively. The availabilities averaged over each six-month increased from 92.6 percent in 2005 to 95.2 percent in 2006.
Based on the wind data obtained from the meteorological mast and the power curve of the 600 kW wind turbine tested, the wind turbine production was estimated and was compared with actual production. Figure 3 represents the comparison of the estimated production and the actual production in 2005.
The number 1 wind turbine has the largest difference between the estimated production and the actual production in September. Also when compared with the estimated production, it can be seen that the number 2 wind turbine has sufficiently lower actual production during July.
in Tables 3 and 4. Therefore, it can be concluded that the stop of the wind turbine, due to various problems, directly affects the wind turbine production.
In the case of the number 2 wind turbine during September, in spite of the comparatively high availability of 90.1 percent, there is a great difference between the estimated production and the actual production. That resulted from the half-operation of the wind turbine generator system. The system specially operated only half of the rated power of the wind turbine for safety during that time because of the malfunction of a bypass contactor.
0 20 40 60 80 100 120 140 160 180
April May Jun July Aug. Sept.
Month
Energy production (MWh) . Estimates NO.1 WT NO.2 WT
The comparison of the estimated production based on the wind data from the meteorological mast and the actual production in 2006 is shown in Fig. 4. It can be seen that the difference between the two wind turbines production is sufficiently observable through all the months. The reason for this is that the number 1 wind turbine had a low availability as shown in Table 3. Furthermore it had switched to half-operation due to a malfunction of the
production was much lower during August than the estimated production, even lower than the number 1 wind turbine production. That was mainly caused by the lowest availability in August, as shown in Table 4. With regard to the number 2 wind turbine, the actual production in April to July is higher than the estimated production during those months, while two kinds of production have similar values in September. The causes are considered to be coming from both a very high availability and the wake effect behind the wind turbines.
0 20 40 60 80 100 120 140 160 180
April May Jun July Aug. Sept.
Month
Energy production (MWh) . Estimates NO.1 WT NO.2 WT
In order to clarify the wake effect, the wind roses in April, May and September were derived from the wind direction data with a wind speed of more than 4m/s, which makes the wind turbine operate. The result is shown in Fig. 5. The prevailing wind directions in April and May were from the west and the west-northwest. As shown in Fig. 1, the number 1, 2 and 3 wind turbines are located in the west of the meteorological mast from which the wind data were obtained. According to the IEC standard 61400-12, whenever the
고경남
west and the west-northwest winds blow, the meteorological mast is in the wake of the number 1, 2 and 3 wind turbines that are operating. The turbulence intensity in the wake is increased over the ambient level, and the increased turbulence was observed to reduce the energy capture of the wind turbine.5) Therefore, the estimated production in April and May, 2006 could be an example affected by the wake behind the wind turbines.
0%
15%
30%
45%N
NE
E
SE S
SW W
NW
April, May September
On the other hand, in the case of September 2006, since the prevailing wind direction was from the east-northeast and the northeast, where the sea lies, wind flow distortion did not occur much for both the meteorological mast and the number 2 wind turbine.
Accordingly, the actual production was considered to be almost the same as the estimated production, as shown in Fig. 4.
The wind turbine generator system V42-600 kW has the error types of about 270 divided
into 12 categories.7) Figure 6 indicates the stop hours according to the causes of stops for the number 1 wind turbine. Of the 12 categories, the errors in generators, power factor correction, thyristors and the internal errors in the control unit rarely occurred. That is, the errors occurred in less than an hour. The errors that occurred for more than one hour are shown in Fig. 6.
In 2005, the most wind turbine stop hours were recorded due to a rotational problem. In this case, an oil leak in the gearbox resulted in low gear oil pressure or high gear temperature, and thus the controller in the wind turbine made the rotation of the rotor blade stop according to an operating and safety strategy. In 2006, it can be seen that the stop hours due to rotational problems fell by more than 50 percent in comparison with those of 2005.
The stop hours in 2006 caused by yawing were much longer than those in 2005. In the case of the number 1 wind turbine, it can be seen that the overload of yaw motor occurred more frequently in 2006, so it led to longer stop hours. The errors in hydraulic systems, pitch systems and RCC (Rotor Current Controller) occurred only in 2006. The stop hours due to the electrical grid increased in 2006.
Figure 7 shows the number of stop hours which occurred in the number 2 wind turbine.
In 2005, the longest stop hours were recorded as a result of various errors. In this case, the feedback error was caused by a hydraulic motor failure which led to the stop of the wind turbine. However, these errors rarely occurred in 2006. The stop hours, due to
hydraulic system made the wind turbine stop for about 58 hours in 2005, but it was considerably reduced in 2006.
0 50 100 150 200 250 300
Electrical grid
Yawing Hydraulic system
Ambinet surrounding
Rotation Pitch system
RCC Various Cause of stop
Stop hours (h) .
2005 2006
0 50 100 150 200 250 300
Electrical grid
Yawing Hydraulic system
Ambinet surrounding
Rotation Pitch system
RCC Various Cause of stop
Stop hours (h) .
2005 2006
The stop due to the ambient surrounding, which was recorded when the external conditions were poor, occurred only in 2005.
From the error text, it became evident that the turbine stop was caused by the gust. The errors in electrical grid rarely occurred in both years. The errors in yawing, pitch system and RCC did not occur in the number 2 wind turbine, while those occurred in the number 1
operational in the same year, the stop hours according to the cause were very different.
From Figs, 6 and 7, it can be seen that there are no consistencies in machine trouble occurrence according to year. This could be explained as follows; that is, wind turbine stop could have occurred as a result of environmental causes, wind turbine internal failure, human factors, power system failure and so on, and the reasons vary throughout the years.
Figure 8 represents the distribution for the cause of the stop for the two wind turbines for both years, which is the ratio of the stop hours for each cause to the total stop hours.
The highest percentage is found in the rotation, which accounts for 37.5 percent. The second longest stop hours were caused by the yawing, which comprised 19.3 percent of the total stop hours. On the other hand, the lowest percentage is found in the RCC, which is 2.4 percent.
Electrical grid 4.3%
Yawing 19.3%
Hydraulic system 13.7%
Rotation 37.5%
Pitch system RCC 5.5%
2.4%
Various 13.9%
Ambinet surrounding
3.5%
고경남
In order to clarify the inter-annual operational characteristics of wind turbines, an investigation was carried out at Hangwon wind farm on Jeju island, for a six-month period from April 1 to September 30, 2005 and 2006, respectively. The wind data analysis showed that wind characteristics such as wind speed and wind power density vary from year to year. Except in the number 1 wind turbine in 2006, the availabilities were excellent with more than a 90 percent. It was clear that the stop of the wind turbine was due to various problems which directly affected the wind turbine production. The downwind wake effect of wind turbines was estimated and it was considered to reduce the energy capture of the wind turbine. Even though the two wind turbines were erected in the same year, the stop hours according to the cause were very different. In this study, the stops of the wind turbines were mainly caused by mechanical problems occurring in the gearbox and the yaw motor.
This work was supported by the Clean Energy Division of Jeju Special Self-Governing Province.
1. IEA, IEA Wind Energy Annual Report 2006, IEA Wind. 2007.
2. Kato, Hideki et al., Operating Conditions of the Wind Power Plants in Japan - Present Status and Problems, The 28th wind energy symposium, JWEA, 2006, pp.208~211.
3. Kato Keisuke et al., Trend Analysis of Results Based on Location of Failure/Breakdown of Wind Power Plants, The 28th wind energy symposium, JWEA, 2006, pp.212~215.
4. Matumiya et al., FY2004 Committee for Increase in Availability/Capacity Factor of Wind Turbine Generator System and Failure/Breakdown Investigation of Wind Turbine Generator System Subcommittee's Report, NEDO, 2006. 3.
5. Manwell J.F., McGowan J,G, and Rogers A.L., Wind Energy Explained, JOHN WILEY & SONS, LTD, 2002.
6. IEC, IEC61400-12 Wind Turbine Generator Systems. Part 12: Wind Turbine Power Performance Testing, 1st Ed., 1998.
7. Vestas Wind Systems A/S, Vestas V-42 Manual, R&D department of Vestas. 2004.