말소리와 음성과학 제3권 제3호 (2011) pp. 99~108
Sample selection approach using moving window for acoustic analysis of pathological sustained vowels according to signal typing
Lee, JiYeoun1)
ABSTRACT
The perturbation parameters like jitter, shimmer, and signal-to-noise ratio (SNR) are largely estimated in the particular segment from the subjective or whole portion of the given pathological voice signal although there are many possible regions to be able to analyze the voice signals. In this paper, the pathological voice signals were classified as type 1, 2, 3, or 4 according to narrow band spectrogram and the value differences of the perturbation parameters extracted in the subjective and entire portion tended to be getting bigger as from type 1 to type 4 signals. Therefore, sample selection method based on moving window to analyze type 2 and 3 signals as well as type 1 signals is proposed. Although type 3 signals cannot be analyzed using the perturbation analysis, the type 3 signals by selecting out the samples in which error count is less than 10 through moving window were analyzed. At present, there is no method to be able to analyze the type 4 signals. Future research will endeavor to determine the best way to evaluate such voices.
Keywords: Moving window, perturbation parameter, signal typing, acoustic analysis, pathological voices, sample selection.
1. Introduction
Over the past few years a considerable number of studies have been applied on the acoustic analysis, including perturbation measures including jitter, shimmer, and signal to noise ratio (SNR) for the laryngeal pathologies [1]. However, since these parameters are based on the fundamental frequency, a very reliable pitch detection algorithm is essential to measure voicing irregularities [2-3]. In a severely chaotic voice signal which exhibits an irregular and aperiodic waveform, it tends to show extreme and unstable perturbation values [4]. It is also sensitive to aperiodicity as well as to error that can be created by environmental noise and measurement noise from recording and sampling [2-6]. Therefore, in a 1995 summary statement from workshop on acoustic voice analysis, Titze proposed that signals
1) Jungwon University, [email protected]
Received: July 25, 2011 Revised: September 6, 2011 Accepted: September 8, 2011
should be assessed and categorized as type 1, 2, or 3 to determine whether a particular signal is appropriate for perturbation analysis [2]. In his system, type 1 signals are nearly periodic and therefore suitable for perturbation analysis. Type 2 signals contain strong modulations or sub-harmonics and type 3 signals are irregular and aperiodic. Such signals might not be appropriate for perturbation analysis [7]. Recently, the addition of signal type 4 to Titze’s voice classification scheme is proposed [8-9]. This signal type 4 is primarily stochastic in behavior and is therefore unsuitable for both perturbation and nonlinear dynamic analysis [9-10].
The nonlinear dynamic analysis has recently received interest in the field of speech signal processing and enables us to quantitatively describe aperiodic and chaotic phenomena [11-12].
It has shown potential ability to reliably quantify both periodic and aperiodic signals, to describe disordered voices, to classify pathological voices from normal ones, finally, and to quantify the degree of aperiodicity and irregularity [13-18]. Zhang et al.
presented a new quantitative scheme used in signal typing of pathological voices based on correlation dimension (D2). The
correlation dimensions of each signal type statistically increase from type 1 to type 3 signals. This study suggests that nonlinear dynamic analysis represents a valuable new method to quantitatively classify pathological voice signals [19].
However, perturbation analysis is an important method to analyze various voice signals utilized in many journals so far [5-6, 20]. This study focuses on the perturbation analysis by means of sample selection approach using an entire portion of the given voice signal and the most stable portion indicated by voice analysts. The process of sample selection, which selects a segment of a voice signal such as the middle portion of the voice signal, varies from experiment to experiment [4,20-24]. There are many possible regions that may be selected for analysis in speech data and each portion produces a different perturbation value. The general consensus is to avoid the negative effects of onset and offset corresponding to the beginning and end of the signal. The speech data are analyzed to only some specific section or whole phonation without onset and offset although pathological voice appears to be large variations in pitch period and amplitude in the cycle to cycle [4,20,24]. In other words, the perturbation analysis is performed by selecting a particular time point from each voice signal and analyzing the selected segment using various algorithms within a computer program to describe the characteristics of the voice signal. Then, the analyzed acoustic measures like jitter, shimmer, and SNR are supposed to be as representatives of each person. Nevertheless, there is no sufficient evidence to select the sample segment of the given voice signal for perturbation analysis so far. Therefore, in this study, the sample selection method based on moving window with consecutive samples of 0.5 seconds in length moving forward at 25 millisecond increments is proposed to analyze the sustained pathological voice signals according to signal typing.
This study includes two research questions about sample selection for acoustic perturbation analysis of pathological sustained vowels. First, on the assumption that perturbation measures change with time in a pathological sustained vowel, does the different sample location affect the result of measurement? Second, what is an objective and reliable method for sample selection? Upon completion of these questions, moving window approach will give information to find the frames showing the minimum perturbation. Then, an appropriate sample selection method will be recommended for perturbation analysis according to signal typing of pathological voices.
2. Material and methods
2.1 Material
The voice samples examined in this study were selected from a DVD-ROM database distributed by The Japan Society of Logopedics and Phoniatrics. This database includes 32 pathological voices (17 women and 15 men) ranging in age from 19 to 77 years as shown in Table 1. Sustained vowel /a/
phonations (0.8-3.2 seconds in length) were used and all voice data were sampled at 44.1 kHz.
2.2. Data analysis
Jitter, shimmer, and SNR were obtained from TF32 software [25]. The acoustic measures were estimated from an entire portion and the most stable portion indicated by the trained speech-language pathologists as baseline methods. The latter is called as subjective method in this paper. The voice samples are selected from an entire portion with 0.5 seconds in length. On the other hand, consecutive samples of the waveform were selected to 0.5 seconds in length, moving forward at 25 millisecond increments in a sustained /a/ vowel as shown in <Figure 1>.
Then, the perturbation measures were analyzed in each window frame. It is called as sample selection method based on moving window. For example, first, the perturbation parameters are extracted in window from 0s to 0.5s. Then, by shifting the window with 0.025s, perturbation parameters are extracted in window from 0.025s to 0.525s. We can analyze the perturbation measures through entire portion of the voice sample in this way.
2.3 Signal typing
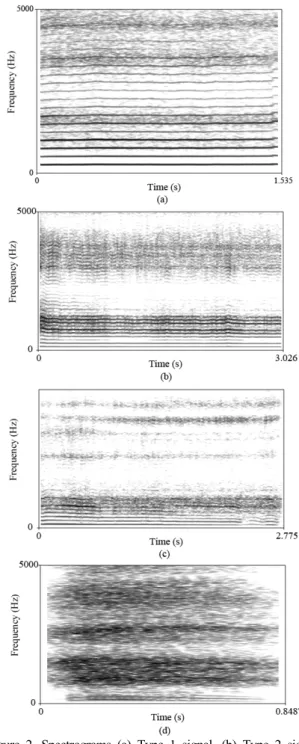
Signal typing was chosen to achieve a visual impression of the acoustic content of the voice samples. Narrow band spectrograms were generated using the Praat software version 5.1.02. Narrow band spectrogram was created with a window length of 0.05 seconds, a time step of 0.002 seconds, a frequency step of 5Hz, and a dynamic range of 40dB [10]. A hamming window shape was used to generate the spectrogram. The signal typing was conducted as a group during weekly voice team meetings consisting of trained three speech-language pathologists (SLPs).
The three speech-language pathologists are famous specialist in the field of speech disorder and have a skillful experience of speech therapy for many years in UW Health, University of Wisconsin hospital. At these meetings, the data from each patient were presented for review and signal typing was done as shown
in <Table 1>. Voice signals were then analyzed with jitter, shimmer, and SNR. The typical characteristics of spectrograms for each signal type are shown as in <Figure 2>.
Table 1. Summary of subject information. ‘‘F’’ and ‘‘M’’ in the second column stand for females and males, respectively.
Subject Sex Age (y) Diagnosis Sgnal typing
2 22 F Nodules Type 1
3 30 F Nodules Type 1
4 37 F Nodules Type 1
5 20 F Nodules Type 1
6 23 F Nodules Type 1
8 22 F Nodules Type 1
9 30 F Nodules Type 1
27 19 F Cysts Type 1
13 44 M Polyps Type 2
24 54 F Polyps Type 2
35 78 F Paralysis Type 2
39 58 M Sulcus vocalis Type 2
40 38 M Laryngitis Type 2
43 34 M Laryngitis Type 2
44 49 M Chronic laryngitis Type 2
52 45 M Granuloma Type 2
17 62 F Polyps Type 3
19 60 M Polyps Type 3
22 39 M Polyps Type 3
47 58 M Glottic cancer Type 3
50 54 F Papilloma Type 3
53 69 M Granuloma Type 3
57 59 F Laryngeal web Type 3
63 21 F Virilization Type 3
16 77 F Polyps Type 4
25 53 F Polyps Type 4
32 35 M Paralysis Type 4
34 79 M Paralysis Type 4
37 67 M Paralysis Type 4
42 34 F Laryngitis Type 4
49 64 M Glottic cancer Type 4
51 21 M Papilloma Type 4
0.0 Time (s) 1.1
Window length ( 0.5 s ) Shifting window length ( 0.025 s)
...
0.4871
-0.4223
... ...
0.4 0.9 -0.4223
0.4871
Time (s) 0.5 s window selection
Figure 1. Sample selection method based on moving window.
Figure 2. Spectrograms (a) Type 1 signal, (b) Type 2 signal, (c) Type 3 signal, (d) Type 4 signal
3. Results and Discussions
3.1 Perturbation analysis 3.1.1 Type 1 signal
<Table 2> shows perturbation parameters such as jitter (%), shimmer (%), and SNR (dB) estimated in an entire and subjective portion of type 1 signals. Type 1 signals tended to have similar jitter values in an entire and subjective portion. However, some subjects (5 and 27) had the differences of jitter values like 0.03
(%) and 0.06 (%) between two portions. As parameter that measures cycle-to- cycle fluctuations in the fundamental period, jitter values tended to be stable in most of the type 1 signals.
Shimmer is a measure of cycle-to- cycle variations in waveform amplitude. In type 1 signals, the differences of shimmer values ranged from 0.03 (%) to 0.43 (%). And the differences of SNR values ranged from 0.00 (dB) to 1.3 (dB).
The reliability of jitter, shimmer, and SNR is assessed using TF32 values of “Trk,” which quantifies the number of dramatic fluctuations in pitch and “Err,” which indicates discrepancies in the calculated fundamental frequency likely due to voice breaks present in the sample [25]. Typically, an "Err" value of less than 10 is used as the cutoff point for suitability of acoustic analysis.
Using this cutoff point, the signal type 1 was appropriate for acoustic analysis.
Table 2. Jitter (%), shimmer (%), and SNR (dB) estimated in an entire and subjective portion of type 1 signal.
2 3 4 5 6 8 9 27
Entire potion
Jitter (%) 0.24 0.17 0.28 0.26 0.28 0.34 0.4 0.32
Shimmer (%) 2.39 1.69 2.6 3.54 1.48 1.9 2.9 3.69
SNR (dB) 25.7 29.6 22.6 23.9 24.2 26.6 23.1 20.4
Trk 4 3 3 4 4 2 5 3
Err 0 0 0 0 0 0 0 0
Subjective portion
Jitter (%) 0.23 0.16 0.27 0.23 0.28 0.39 0.41 0.26
Shimmer (%) 2.36 1.66 2.31 3.47 1.39 2.16 2.47 3.79
SNR (dB) 25.7 30 22.8 24.4 24.7 25.6 23 21.1
Trk 1 0 0 0 0 0 0 0
Err 0 0 0 0 0 0 0 0
3.1.2 Type 2 signal
<Table 3> shows perturbation parameters such as jitter (%), shimmer (%), and SNR (dB) estimated in an entire and subjective portion of type 2 signals. Type 2 signals were suitable to perturbation analysis except for the perturbation parameters estimated in an entire portion of subject 40 because the "Err"
values were larger than 10. The differences of jitter, shimmer, and SNR values ranged from 0.00 (%) to 0.09 (%), 0.05 (%) to 0.9 (%), and 0.5 (dB) to 0.33 (dB), respectively. Compared with differences of the perturbation values in type 1 signals, those for type 2 signals were getting bigger between an entire and subjective portion. In conclusion, although type 2 signal is suitable to perturbation analysis, the different sample location affects the result of perturbation parameters as shown in <Table 3>.
Table 3. Jitter (%), shimmer (%), and SNR (dB) estimated in an entire and subjective portion of type 2 signal.
13 24 35 39 40 43 44 52
Entire potion
Jitter (%) 0.51 0.45 0.53 0.54 0.46 0.34 0.39 0.3
Shimmer (%) 5.73 4.63 4.24 3.79 2.01 2.82 2.28 2.6
SNR (dB) 14.7 16 18.3 19.2 19.4 23.8 23.8 24.3
Trk 60 24 33 51 18 23 16 22
Err 0 0 0 0 17 0 0 0
Subjective portion
Jitter (%) 0.53 0.48 0.44 0.47 0.46 0.31 0.35 0.27
Shimmer (%) 4.83 4.16 3.54 3.06 2.04 2.74 1.85 1.81
SNR (dB) 15.9 16.5 21.6 20.7 18.9 24.7 25.1 26.6
Trk 5 5 2 5 4 1 0 5
Err 0 0 0 0 6 0 0 0
3.1.3 Type 3 signal
<Table 4> shows perturbation parameters such as jitter (%), shimmer (%), and SNR (dB) estimated in an entire and subjective portion of type 3 signals. It was not suitable to analyze the perturbation parameters in an entire portion of the type 3 signals because “Err” were larger than 10. Although it was okay to analyze the perturbation parameters in most of the stable section indicated by speech-language pathologists, we should carefully check if the perturbation values are representative in the voice signals. Also we should compare them with perturbation values estimated by other objective sample selection methods.
Table 4. Jitter (%), shimmer (%), and SNR (dB) estimated in an entire and subjective portion of type 3 signal.
17 19 22 47 50 53 57 63
Entire potion
Jitter (%) 0.5 3.49 16.7 1.64 0.64 1.38 1.09 1.02
Shimmer (%) 4.64 21.04 60.12 8.52 3.83 7.71 12.66 4.6
SNR (dB) 17 12.5 6.4 9.4 15.7 13.6 7.3 16.3
Trk 47 1332 3972 902 34 832 274 108
Err 5 62 504 103 6 156 60 10
Subjective portion
Jitter (%) 0.31 0.6 0.78 0.55 0.59 1.22 1.18 0.84
Shimmer (%) 2.78 6.16 12.55 6.66 3.17 4.93 11.86 3.25
SNR (dB) 20.4 15.1 9.5 12.3 15 11.8 7.7 17.3
Trk 12 34 35 28 6 67 40 25
Err 0 1 1 0 3 16 9 1
3.1.4 Type 4 signal
<Table 5> shows perturbation parameters such as jitter (%), shimmer (%), and SNR (dB) estimated in an entire and subjective portion of type 4 signals. It wasn’t suitable to analyze the type 4 signals with an entire portion. However, although the subjective portion was selected by the trained speech-language pathologists,
“Err” values larger than 10 were showed in most of the type 4 signals. As from type 1 to type 4 signals, the differences were getting bigger between the entire and subjective portion.
Table 5. Jitter (%), shimmer (%), and SNR (dB) estimated in an entire and subjective portion of type 4 signal.
16 25 32 34 37 42 49 51
Entire potion
Jitter (%) 7.15 3.16 10.21 13.48 32.16 7.69 5.03 6.29 Shimmer (%) 36.75 14.73 41.83 33.5 29.91 42.94 33.43 25.89
SNR (dB) 2.9 6.8 2.6 8.3 8 3.4 5.9 7.2
Trk 4880 888 2915 2763 2300 8019 1406 1683
Err 105 22 306 440 225 388 163 234
Subjective portion
Jitter (%) 10.01 3.62 8.94 4.83 5.31 0.78 2.4 5.93 Shimmer (%) 43.22 13 33.16 36.3 26.72 12.79 27.64 20.96
SNR (dB) 2.5 6.6 3.3 5.6 5.2 4.2 4.2 8.2
Trk 3008 439 1570 493 931 248 338 1166
Err 57 8 96 38 89 3 34 143
In conclusion, although the sample selection methods using the entire and subjective portion have commonly used, jitter, shimmer, and SNR values showed a clear difference between two methods according to signal typing. Since the location of the different sample selection affects the distinct difference of perturbation measures in a given pathological sustained vowel, we must carefully select the sample segment to analyze perturbation measures.
In next chapter, the variation between frames according to signal typing will be shown with moving window approach which is proposed in <Figure 1>.
3.2 Moving window analysis
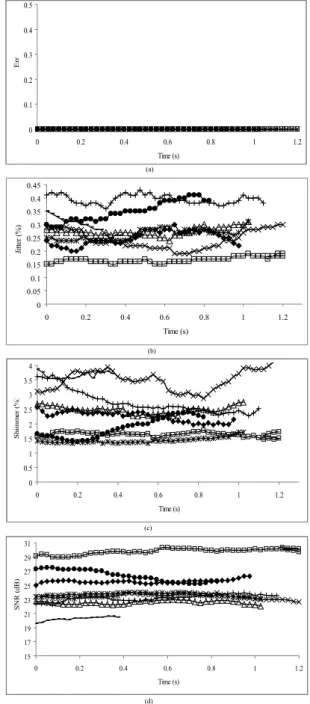
<Figure 3> shows perturbation parameters such as jitter (%), shimmer (%), and SNR (dB) estimated through the moving window in type 1 signals. All values of “Err” were 0. In most of the type 1 signals, jitter, shimmer, SNR were stable though every frames. However, in some subjects these values changed depending on the location of the window.
<Table 6> shows the locations indicating the minimum perturbation which indicates the most stable portion within type 1 signals. Although most samples had minimum values for the three parameters in similar places, these values were different from those estimated in the subjective portion of the type 1 signal as shown in <Table 2>. Even in type 1 signal, the location of minimum perturbation varied between subjects. Therefore we should not select the samples in the middle or entire portion of the given voice signal without evidence.
In signal type 1, the recommendation for sample selection procedures is as follows:
If the perturbation measures have similar minimum perturbation location, the location corresponding to more than two perturbation measures is the time point for the sample selection.
If the perturbation measures have a different minimum perturbation location like subject 2 and 9, we should choose one location by comparing the values of perturbation measures estimated in the entire frames through moving window with minimum perturbation values.
0 0.05 0.1 0.15 0.2 0.25 0.3 0.35 0.4 0.45
0 0.2 0.4 0.6 0.8 1 1.2
Time (s)
Jitter(%)
0 0.5 1 1.5 2 2.5 3 3.5 4
0 0.2 0.4 0.6 0.8 1 1.2
Time (s)
Shimmer(%)
15 17 19 21 23 25 27 29 31
0 0.2 0.4 0.6 0.8 1 1.2
Time (s)
SNR(dB)
0 0.1 0.2 0.3 0.4 0.5
0 0.2 0.4 0.6 0.8 1 1.2
Time (s)
Err
(a)
(b)
(c)
(d)
Figure 3. “Err” and perturbation parameters estimated from sample selection method based on moving window in type 1 signals. (a) Err (b) jitter (%) (c) shimmer (%) (d) SNR (dB) ( : subject2, : subject 3, : subject 4, : subject 5, : subject 6, : subject 8, : subject 9, : subject 27)
Table 6. Minimum perturbation positions and the selected time points according to each subject in type 1 signals.
Percent jitter (time point)
Percent shimmer (time point)
SNR (time point)
Selected time point 2 0.2 ( 0.125s, 0.15s) 1.95 (0.825s) 26.3 (0.95s) (0.95s)
3 0.15 (0.6s) 1.46 (1.125s) 30.3 (1.125s) 1.125s
4 0.24 (0.625s) 2.26 (0.675s) 23 (0.625s) 0.625s
5 0.19 (0.7s) 2.87 (0.825s) 23.9 (0.7s) 0.7s
6 0.24 (0.4s) 1.33 (0.4s) 24 (0.425s) 0.4s
8 0.29 (0.075s) 1.39 (0.2s) 27.5 (0.075s) 0.075s
9 0.36 (0.3s) 2.28 (1.05s) 23.9 (0.9s) (0.9s)
27 0.25 (0.325s) 3.54 (0.125s) 20.6 (0.325s) 0.325s
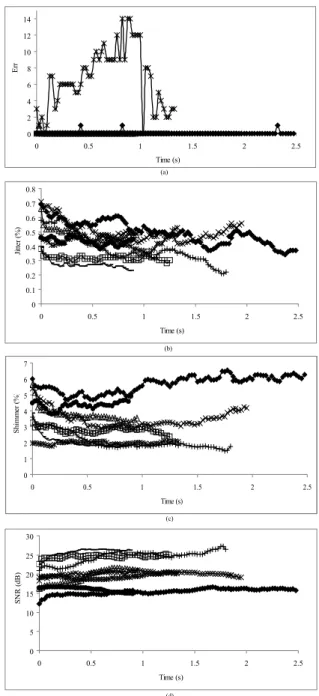
<Figure 4> shows perturbation parameters such as jitter (%), shimmer (%), and SNR (dB) estimated through the moving window in type 2 signals. Although the “Err” values of most of the type 2 signals were less than 10, perturbation measures tended to be unstable between every frames of moving window compared to the type 1 signals.
<Table 7> shows the location and value of each minimum perturbation measure for type 2 signals. As compared to the type 1 signals, these signals tended to reach a minimum for each parameter at different time points. The selected time points were determined from same procedures recommended in signal type 1 because type 2 signals were appropriate for perturbation analysis.
Table 7. Minimum perturbation positions and the selected time points according to each subject in type 2 signals.
Percent jitter (time point)
Percent shimmer (time point)
SNR (time point)
Selected time point 13 0.34 ( 2.375s) 4.69 (0.55s) 16.6 (1.675s) 1.625s 24 0.38 (0.575s) 3.79 (1.175s) 16.7 (1.175s) 1.175s
35 0.42 (0.5s) 3.28 (0.875s) 21.6 (0.725s) 0.725s
39 0.42 (1.325s) 2.88 (0.9s) 21 (0.9s) 0.9s
40 0.34 (1.05s) 1.79 (0.175s) 20.5(1.225s) 1.05s
43 0.28 (1.225s) 2.36 (1.25s) 25.2 (1.225s) 1.225s
44 0.21 (1.75s) 1.5 (1.75s) 27.2 (1.75s) 1.75s
52 0.23 (0.85s) 1.76 (0.85s) 26.5 (0.625s) 0.85s
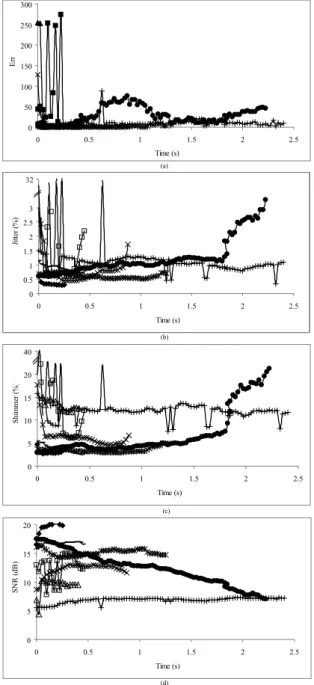
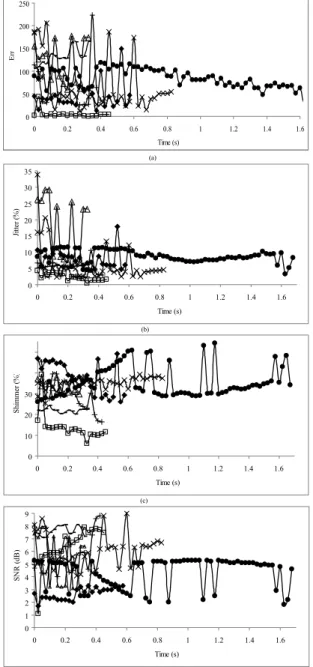
<Figure 5> shows perturbation parameters such as jitter (%), shimmer (%), and SNR (dB) estimated through the moving window in type 3 signals. The “Err” values for the type 3 signals were greater than our cutoff of 10 and the type 3 signals seemed to be inappropriate for acoustic analysis. However, the moving window technique can detect frames where this value dropped below 10 and the samples are transiently suitable for acoustic analysis. Compared to type 1 and 2 signals, the type 3 signals showed abrupt changes between in perturbation parameters between frames.
0 2 4 6 8 10 12 14
0 0.5 1 1.5 2 2.5
Time (s)
Err
(a)
0 0.1 0.2 0.3 0.4 0.5 0.6 0.7 0.8
0 0.5 1 1.5 2 2.5
Time (s)
Jitter(%)
(b)
0 1 2 3 4 5 6 7
0 0.5 1 1.5 2 2.5
Time (s)
Shimmer(%)
(c)
0 5 10 15 20 25 30
0 0.5 1 1.5 2 2.5
Time (s)
SNR(dB)
(d)
Figure 4. “Err” and perturbation parameters estimated from sample selection method based on moving window in type 2 signals. (a) Err (b) jitter (%) (c) shimmer (%) (d) SNR (dB) ( : subject 13, : subject 24, : subject 35,
: subject 39, : subject 40, : subject 43, : subject 44, : subject 52)
0 0.5 1 1.5 2 2.5 3 32
0 0.5 1 1.5 2 2.5
Time (s)
Jitter(%)
0 5 10 15 20 40
0 0.5 1 1.5 2 2.5
Time (s)
Shimmer(%)
0 5 10 15 20
0 0.5 1 1.5 2 2.5
Time (s)
SNR(dB)
0 50 100 150 200 250 300
0 0.5 1 1.5 2 2.5
Time (s)
Err
(a)
(b)
(c)
(d)
Figure 4. “Err” and perturbation parameters estimated from sample selection method based on moving window in type 3 signals. (a) Err (b) jitter (%) (c) shimmer (%) (d) SNR (dB) ( : subject 17, : subject 19, : subject 22,
: subject 47, : subject 50, : subject 53, : subject 57, : subject 63)
<Table 8> shows the location and value of each minimum perturbation measure for type 3 signals. Most of the voice signals had a different position of the minimum perturbation in each parameter. It has well known that the perturbation analysis cannot be applied to signal type 3 because of many error counts.
However, the type 3 signals had the frames which “Err” has less than 10 through sample selection method based on moving
window. The locations of minimum perturbation of <Table 8>
corresponded to areas with “Err” less than 10. Accordingly, the perturbation analysis after selecting segments of the voice in which “Err” was below 10 could be applied for type 3 signals. In
<Table 8>, the selected time points are determined from same procedures recommended in signal type 1 and 2.
Table 8. Minimum perturbation positions and the selected time points according to each subject in type 3 signals.
Percent jitter (time point)
Percent shimmer (time point)
SNR (time point)
Selected time point 17 0.29 ( 0.225s) 2.77 (0.05s) 20.1 (0.175s) 0.175s
19 0.6 (0.275s) 6.11 (1.325s) 15 (0.275s) 0.275s
22 0.72 (0.15s) 11.84 (0.325s) 10.2 (0.075s) 0.15s
47 0.45 (0.3s) 4.58 (0.675s) 13 (0.325s) 0.325s
50 0.5 (1.025s) 2.89 (0.75s) 16.4 (0.025s) 1.025s
53 0.59 (0.1s) 2.89 (0s) 17.5 (0s) 0s
57 0.33 (2.325s) 7.49 (1.25s) 7.3 (2s) 2.325s
63 0.72 (0.4s) 2.52 (0.425s) 17 (0.4s) 0.4s
<Figure 6> shows perturbation parameters such as jitter (%), shimmer (%), and SNR (dB) estimated through the moving window in type 4 signals. As shown in <Figure 6>, “Err” values were above 10 for all frames of the moving window except for subject 25. These results confirm the type 4 signals are primarily stochastic in behavior and are therefore known as unsuitable signals for both perturbation and nonlinear dynamic analysis. At present, there is no objective method to be able to analyze the type 4 signals.
In type 4 signal, only one signal in which “Err” is below 10 was analyzed. The selected time point is determined from same procedures recommended in signal type 1.
Table 9. Minimum perturbation positions and the selected time points according to each subject in type 4 signals.
Percent jitter (time point)
Percent shimmer (time point)
SNR (time point)
Selected time point
16 X X X X
25 0.42 (0.325s) 5.96 (0.325s) 7.9 (0.325s) 0.352s
32 X X X X
34 X X X X
37 X X X X
42 X X X X
49 X X X X
51 X X X X
0 5 10 15 20 25 30 35
0 0.2 0.4 0.6 0.8 1 1.2 1.4 1.6
Time (s)
Jitter(%)
40 50
(a)
(b)
0 10 20 30
0 0.2 0.4 0.6 0.8 1 1.2 1.4 1.6
Time (s)
Shimmer(%)
0 1 2 3 4 5 6 7 8 9
0 0.2 0.4 0.6 0.8 1 1.2 1.4 1.6
Time (s)
SNR(dB)
(c)
(d) 0
50 100 150 200 250
0 0.2 0.4 0.6 0.8 1 1.2 1.4 1.6
Time (s)
Err
Figure 6. “Err” and perturbation parameters estimated from sample selection method based on moving window in type 4 signals. (a) Err (b) jitter (%) (c) shimmer (%) (d) SNR (dB)
( : subject 16, : subject 25, : subject 32, : subject 34, : subject 37, : subject 42,
: subject 49, : subject 51)
4. Conclusion
The perturbation analysis has known as an important method to analyze various voice signals so far. The perturbation measures like jitter, shimmer, and SNR are largely estimated from a particular segment from the middle, entire, or subjective portion of the given voice signal to avoid the negative effects of onset and offset although there are many possible regions to be able to
analyze the voice signals. This method is applied for a pathological voice which appears to be large variations in pitch period and amplitude without efficient evidence.
In this study, according to Titze’s suggestion that voice signals should be reviewed and categorized as type 1, 2, or 3 to determine whether a particular signal is appropriate for perturbation analysis, the pathological voice signals were classified as signal type 1, 2, 3, and, in addition, signal type 4.
Then, the perturbation measures like jitter, shimmer, SNR were extracted in the subjective and entire portion. The differences of the perturbation measures between the subjective and entire portion tended to be getting bigger as from type 1 to type 4 signals. The different sample locations affected the results of measurement. Therefore, the sample selection method based on moving window with consecutive samples of 0.5 seconds in length moving forward at 25 millisecond increments was proposed to analyze the sustained pathological voice signals according to signal typing.
What is an objective and reliable method for sample selection?
We recommend that sample selection approaches according to signal typing should the following rules.
In type 1 and 2 signals,
If perturbation measures have same minimum perturbation location, the united time is for the sample selection.
If perturbation measures have a similar minimum perturbation location, the location corresponding to more than two perturbation measures is the time point for the sample selection.
If perturbation measures have a different minimum perturbation location, we should choose one location by comparing the values of perturbation measures estimated in every frame of moving window with minimum perturbation values.
It has well-known that type 3 signals cannot be analyzed using perturbation analysis. However, the type 3 signals had the frames which “Err” is less than 10 through sample selection method based on moving window. All frames indicating minimum perturbation were corresponded to the ones in which “Err” are less than 10. Finally, the perturbation analysis after selecting out samples of the section that error counts are less than 10 can be applied for the type 3 signals. At present, there is no method to analyze the type 4 signals which are perceived as increasingly dysphonic. Future research will endeavor to determine the best way to evaluate such voices.
In conclusion, the sample selection approach based on moving window is the objective and convenient method to analysis voice signals at the moment.
Acknowledgements
I appreciate the contribution to this work of the speech language pathologist: Dr. Seong Hee Choi (Catholic University of Daegu), Dr. Jack J. Jiang (UW-Madison), Alicia J. Sprecher (UW-Madison).
References
[1] Lieberman, P. (1961). "Perturbations in vocal pitch", Journal of the Acoustical Society of America, Vol. 33, No. 5, pp.
597-603.
[2] Titze I.R. (1995). "Workshop on Acoustic Voice Analysis:
Summary Statement", National Center for Voice and Speech, Denver, CO, USA.
[3] Kay Elemetrics Corp. (1993). "Multi-dimensional voice program: software instruction manual", Kay Elemetrics Corporation.
[4] Zhang, Y., Wallace, S. M., and Jiang, J.J. (2005).
"Comparison of nonlinear dynamic methods and perturbation methods for voice analysis", Journal of the Acoustical Society of America, Vol. 118, No. 4, pp. 2551-2560.
[5] Titze, I. R. and Liang, H. (1993). "Comparison of F0 extraction method for high-precision voice perturbation measurements", Journal of Speech and Hearing Research, Vol.
36, No. 6, pp. 1120-1133.
[6] Bielamowicz, S., Kreiman, J., Gerratt, B. R., Dauer, M. S., and Berke, G. S. (1996). "Comparison of voice analysis systems for perturbation measurement", Journal of Speech and Hearing Research, Vol. 39, pp. 126-134.
[7] Behrman, A., Agresti, C. J., Blumstein E., Lee N. (1998).
"Microphone and Electroglottographic Data from Dysphonic Patients: Type 1, 2 and 3 Signals", Journal of Voice, Vol. 12, No. 2, pp. 249-260.
[8] Van As-Brooks, C. J., Koopmans-van Beinum, F. J., Pols, L.
C., Hilgers, F. J. (2006). "Acoustic Signal Typing for Evaluation of Voice Quality in Tracheoesophageal Speech", Journal of Voice, Vol. 20, No. 3, pp. 355-368.
[9] Sprecher A, Olszewski A, Jiang J.J., and Zhang Y. (2010).
"Updating signal typing in voice: addition of type 4 signals", Journal of the Acoustical Society of America, Vol. 127, No.
6, pp. 3710-16.
[10] Lee J.Y., Choi S.H., Jiang J.J., Hahn M, Choi H.S. (2010).
"Perturbation and Perceptual Analysis of Pathological Sustained Vowels according to Signal Typing", Phonetics and
Speech Sciences, Vol. 2, No. 2, pp. 109-115.
[1] Titze, I. R., Baken, R., and Herzel, H. (1993). "Evidence of chaos in vocal fold vibration", Vocal Fold Physiology: New Frontiers in Basic Science, Singular Publishing Group, pp.
143-188.
[12] Jiang, J. J., Zhang, Y., and McGilligan, C. (2006). "Chaos in voice, from modeling to measurement", Journal of Voice, Vol. 20, No. 1, pp. 2-17.
[13] Hertrich, I., Lutzenberger, W., Spieker, S., and Ackermann, H. (1997). "Fractal dimension of sustained vowel productions in neurological dysphonias: an acoustic and electroglottographic analysis", Journal of the Acoustical Society of America, Vol. 102, No. 1, pp. 652-654.
[14] Giovanni, A., Ouaknine, M., and Triglia, J. M. (1998).
"Determination of largest Lyapunov exponents of vocal signal:
application to unilateral laryngeal paralysis", Journal of Voice, Vol. 13, No. 3, pp. 341-354.
[15] Zhang, Y., Jiang, J. J., Biazzo, L., Jorgensen, M., and Berman, M. (2005). "Perturbation and nonlinear dynamic analyses of voices from patients with unilateral laryngeal paralysis", Journal of Voice, Vol. 19, No. 4, pp. 519-528.
[16] Zhang, Y., McGilligan, C., Zhou, L., Vig, M., and Jiang, J.
J. (2004). "Nonlinear dynamic analysis of voices before and after surgical excision of vocal polyps", Journal of the Acoustical Society of America, Vol. 115, No.5, pp. 2270-2277.
[17] Herzel, H. and Berry, D. (1994). "Analysis of vocal disorders with methods from nonlinear dynamics", Journal of Speech and Hearing Research, Vol. 37, pp. 1008-1019.
[18] Jiang, J. J., Zhang, Y., and Ford, C. N. (2003). "Nonlinear dynamics of phonations in excised larynx experiments", Journal of the Acoustical Society of America, Vol. 114, No.
2003, pp. 2198-2205.
[19] Zhang, Y., Jiang, J. J. (2003). "Nonlinear dynamic analysis of signal typing of pathological human voices", Electronics Letters, Vol. 39, No. 2003, pp. 1021-1023.
[20] Petrovic´-Lazic´, M., Babac, S., Vukovic´, M., Kosanovic´, R., and Ivankovic´, Z. (2010). "Acoustic Voice Analysis of Patients with Vocal Fold Polyp", Journal of Voice, Vol. 25, No. 1, pp. 94-97.
[21] Lim, Jae-Yol, Choi, Jae-Nam, Kim, Kwang-Moon and Choi, Hong-Shik (2006). "Voice analysis of patients with diverse types of Reinke's edema and clinical use of electroglottographic measurements", Acta Oto-Laryngologica, 126, pp. 62-69.
[22] Uloza, V., Saferis, V., and Uloziene, I. (2005). "Perceptual
and Acoustic Assessment of Voice Pathology and the Efficacy of Endolaryngeal Phonomicrosurgery", Journal of Voice, Vol.
19, No. 1, pp. 138-145.
[23] Rahn, D. A. 3rd, Chou, M., Jiang, J. J., and Zhang, Y.
(2007). "Phonatory Impairment in Parkinson's Disease:
Evidence from Nonlinear Dynamic Analysis and Perturbation Analysis", Journal of Voice, Vol. 21, No. 1, pp. 64-71.
[24] Robinson, J. L., Mandel, S., and Sataloff, R. T. (2005).
"Objective Voice Measures in Nonsinging Patients With Unilateral Superior Laryngeal Nerve Paresis", Journal of Voice, Vol. 19, No. 4, pp. 665-667.
[25] Milenkovic P. (2001). TF32 User’s Manual. Madison, WI.
• 이지연 (Lee, JiYeoun), Corresponding author The Faculty of Medical Engineering
Jungwon University
Donbu-ri #5, Goesan-eup, Goesan-gun Chungcheongbuk-do, 367-805, South Korea.
Tel: +1-10-6751-1476 E-mail: [email protected]
Research Interests: speech signal processing, voice measurement in patients with laryngeal pathology, etc.