Neonatal and Infant Mortality in Korea, Japan, and the U.S.: Effect of Birth Weight Distribution and Birth Weight-Specific Mortality Rates
Difference in crude neonatal and infant mortality rates (NMR and IMR) among different countries is due to the differences in its two determinants: birth weight distribution (BWD) and birth weight-specific mortality rates (BW-SMRs). We aimed to determine impact of BWD and BW-SMRs on differences in crude NMR and IMR among Korea, Japan, and the U.S. Our study used the live birth data of the period 2009 through 2010. Crude NMR/IMR are the lowest in Japan, 1.1/2.1, compared to 1.8/3.2, in Korea, and 4.1/6.2, in the U.S., respectively. Japanese had the best BW-SMRs of all birth weight groups compared to the Koreans and the U.S. The U.S. BWD was unfavorable with very low birth weight (< 1,500 g) rate of 1.4%, compared to 0.6% in Korea, and 0.8% in Japan. If Koreans and Japanese had the same BWD as in the U.S., their crude NMR/IMR would be 3.9/6.1 for the Koreans and 1.5/2.5 for the Japanese. If both Koreans and Japanese had the same BW-SMRs as in the U.S., the crude NMR/IMR would be 2.0/3.8 for the Koreans and 2.7/5.0 for the Japanese. In conclusion, compared to the U.S., lower crude NMR or IMR in Japan is mainly attributable to its better BW-SMRs. Koreans had lower crude NMR and IMR, primarily from its favorable BWD. Comparing crude NMR or IMR among different countries should include further exploration of its two determinants, BW-SMRs reflecting medical care, and BWD reflecting socio-demographic conditions.
Keywords: Infant Mortality; Birth Weight; Korea; Japan; the United States Do-Hyun Kim,1 Jihyun Jeon,2
Chang Gi Park,3 Sudhir Sriram,3 and Kwang-sun Lee3
1Department of Pediatrics, Dongguk University Ilsan Hospital, Goyang, Korea; 2Department of Pediatrics, CHA Gangnam Medical Center, CHA University, Seoul, Korea; 3Department of Pediatrics, University of Chicago Comer Children’s Hospital, Chicago, USA Received: 4 April 2016
Accepted: 29 May 2016 Address for Correspondence:
Jihyun Jeon, MD
Department of Pediatrics, CHA Gangnam Medical Center, CHA University, 569 Nonhyon-ro, Gangnam-gu, Seoul 06125, Korea E-mail: [email protected]
Funding: This work was supported by the Dongguk University Research Fund of 2014.
http://dx.doi.org/10.3346/jkms.2016.31.9.1450 • J Korean Med Sci 2016; 31: 1450-1454
INTRODUCTION
Neonatal and infant mortality rates (NMR, IMR) are tradition- ally used as health care or social indicators of individual coun- tries. In 2011, the latest year that data are available for all OECD member nations, Japan had IMR of 2.3 per 1,000 live births, and Korea had 3.0 per 1,000 live births, lower than the average of OECD member nations, 4.0 per 1,000 live births. Japan and Ko- rea ranked 3rd and 10th among the 34 OECD member coun- tries, while the U.S. ranked 31st with its IMR of 6.1 per 1,000 live births (1).
Comparing NMR or IMR among different countries is of lim- ited value or often misleading unless one accounts its two de- terminants, birth weight distribution (BWD) and birth weight- specific mortality rates (BW-SMRs). NMR or IMR has its two components, mortality rates in individual birth weight groups, and proportions of its birthweight groups in a population. Thus, it can be viewed as the sum of BW-SMRs multiplied by the pro- portion of live births in each birth weight category (2). The BW- SMR is influenced by the level of health care, among them most importantly by the level of neonatal medical care.
On the other hand, BWD of a live birth population is associ-
ated with its sociodemographic status, including maternal age, parity, education, and complications of pregnancy. Race is a factor which is associated with both factors, more with BWD and less with BW-SMRs. Thus, crude NMR or IMR does not re- flect the level of infant medical care independent of sociode- mographic conditions or vice versa. Our objective is then to de- termine impact of these two factors, BWD and BW-SMRs on differences in crude NMR and IMR among three countries, Ko- rea, Japan, and the U.S.
MATERIALS AND METHODS
Our study population includes live births for the years 2009 throu- gh 2010, from the linked birth/infant death data files of the U.S.
National Center for Health Statistics (NCHS) (n = 8,130,051), the Statistics Korea (n = 915,020), and Japan Ministry of Health, Labour, and Welfare (n = 2,141,339) (3-8). We excluded 5,019 infants whose birth weights or mortality status were not stated (1,543 in the U.S., 3,013 in Korea, and 463 in Japan). Thus, our final study population consisted of 11,181,391 live births of the U.S. (n = 8,128,508), Korea (n = 912,007), and Japan (n = 2,140,876).
The NMR is defined as number of deaths within 28 days per
1,000 live births and IMR, number of deaths within 1 year per 1,000 live births.
First, we estimated the impact of difference in BW-SMRs on the difference in crude mortality rates among these three coun- tries, controlling for the difference in BWD. So, we estimated expected NMR and IMR of Korea and Japan, assuming that both these two countries had the same BWD as in the U.S. Second, we estimated the impact of difference in BWD on the difference in crude mortality rates by estimating expected NMR and IMR of Korea and Japan, assuming that these two countries had the same mortality rates in each of all birth weight categories.
RESULTS
Neonatal and infant mortality rates, birth weight distribution, and birth weight-specific mortality rates in Korea, Japan, and the U.S.
In the period 2009-2010, NMR and IMR in Korea were 1.8 and 3.2 per 1,000 live births, respectively, significantly lower than in the U.S. of 4.1 and 6.2 per 1,000 live births respectively, but high- er than in Japan, 1.1 and 2.1 per 1,000 live births respectively (Table 1). Comparing different countries, the crude rates may differ by the differences in its two components, BWD and BW- SMRs. Lower birth weight groups have exponentially higher mortality than the larger birth weight groups. Thus, although it is a small proportion, this smaller birth weight group would greatly affect the overall crude rate. As well, difference in mor- tality rates in individual birth weight groups among different countries would also contribute to the variance in their overall crude mortality rates.
In this period, proportion of live births with < 2,500 g was 5.0% in Korea, lower than 8.2% in the U.S. and 9.6% in Japan (Table 1). The difference was more pronounced in the propor- tion of very low birth weight infant (< 1,500 g, VLBWI); 0.6% in Korea and 0.8% in Japan, while it was 1.4% in the U.S., more than twice higher than in Korea or 75% more than in Japan. BW-SMRs were also quite different among these three countries (Table 1).
Compared to Korea and the U.S., Japan had lower BW-S NMR and IMR in all birth weight categories. It is notable that Koreans had higher infant mortality in the VLBWI group, compared to the Japanese or the U.S.
Thus, we compared independent contributions of these two components on the crude mortality rate in three countries. First, we estimated expected crude NMR and IMR in Korea and Ja- pan using BWD of the U.S. births but with actual BW-SMRs of Korea and Japan. Second, we estimated expected crude NMR and IMR in Korea and Japan using BW-SMRs of the U.S. but with actual BWD of Korea and Japan.
Expected neonatal and infant mortality rates in Korea after standardization with birth weight distribution and birth weight-specific mortality rates in the U.S.
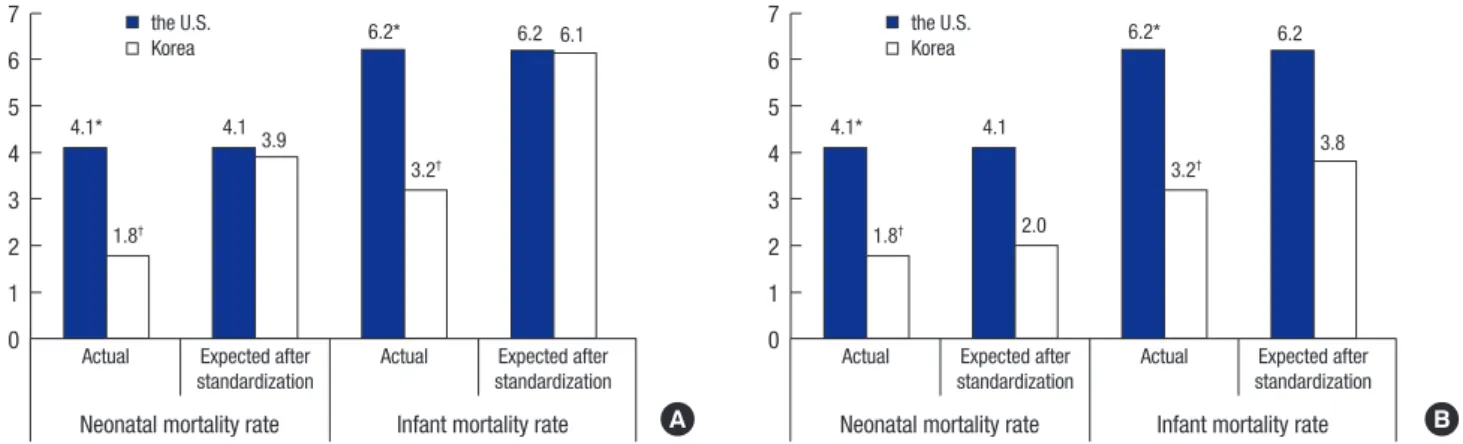
Standardizing BWD of Korea with that of the U.S. resulted in ex- pected crude NMR and IMR in Korea of 3.9 and 6.1 per 1,000 respectively, higher than the actual crude rates of 1.8 and 3.2 per 1,000 respectively (Fig. 1A, Table 2). These expected rates were quite similar to the U.S. NMR and IMR of 4.1 and 6.2 per 1,000, respectively. Standardizing BW-S NMR and IMR of Korea with those of the U.S. resulted in expected crude NMR and IMR in Korea of 2.0 and 3.8 per 1,000 respectively, slightly higher than the actual crude rates of 1.8 and 3.2 per 1,000, respectively (Fig.
1B, Table 2). These two estimations indicate that the lower NMR and IMR in Korea than in the U.S. is predominantly due to its favorable BWD.
Expected neonatal and infant mortality rates in Japan after standardization with birth weight distribution and birth weight-specific mortality rates in the U.S.
Similar comparison was made for the difference in mortality rates between Japan and the U.S. (Fig. 2, Table 2). Standardizing BWD of Japan with that of the U.S. resulted in expected crude NMR and IMR in Japan of 1.5 and 2.5 per 1,000 respectively, somewhat higher than the actual crude rates of 1.1 and 2.1 per 1,000 respectively (Fig. 2A, Table 2). Standardizing BW-S NMR and IMR of Japan with those of the U.S. resulted in expected crude NMR and IMR in Japan of 2.7 and 5.0 per 1,000 respec- tively, remarkably higher, about 2.5-folds higher than the actual crude NMR and IMR (Fig. 2B, Table 2). These observations sug- gest that the lower NMR and IMR in Japan than in the U.S. are due to both factors, predominantly by its better BW-SMRs and lesser by its favorable BWD.
Table 1. Number of live births, neonatal and infant mortality rates in the U.S., Korea, and Japan, 2009-2010
Birth weight, g No. of live births Distribution, % Neonatal mortality rate Infant mortality rate
the U.S.* Korea† Japan‡ the U.S.* Korea† Japan‡ the U.S.* Korea† Japan‡ the U.S.* Korea† Japan‡
< 1,000 58,801 2,000 6,382 0.7 0.2 0.3 361.8 344.5 115.2 405.4 449.5 156.2
1,000-1,499 60,922 3,388 9,707 0.7 0.4 0.5 39.0 67.3 28.6 54.4 96.5 41.7
1,500-1,999 129,199 7,558 25,979 1.6 0.8 1.2 16.0 16.9 12.9 24.9 24.9 23.6
2,000-2,499 415,868 32,584 163,652 5.1 3.6 7.6 5.2 4.1 2.1 10.1 7.8 4.6
2,500 ≤ 7,463,718 866,477 1,935,156 91.8 95.0 90.4 0.7 0.5 0.4 2.2 1.4 0.9
All 8,128,508 912,007 2,140,876 100.0 100.0 100.0 4.1 1.8 1.1 6.2 3.2 2.1
*Data from the U.S. National Center for Health Statistics; †Data from the Statistics Korea; ‡Data from Japan Ministry of Health, Labour, and Welfare (3-8).
Table 2. Actual and expected neonatal and infant mortality rates in Korea (A) and Japan (B), 2009-2010
Countries Live births
Neonate Infant
Actual Expected after standardization with
BWD in the U.S.
Expected after standardization with
BW-SMRs in the U.S. Actual Expected after standardization with
BWD in the U.S.
Expected after standardization with BW-SMRs in the U.S.
Deaths MR Deaths* MR† Deaths‡ MR§ Deaths MR Deaths* MR† Deaths‡ MR§
(A) the U.S.ll
Korea¶ 8,128,508
912,007 33,257
1,621 4.1
1.8 3,599 3.9 1,793 2.0 50,779
2,923 6.2
3.2 5,553 6.1 3,466 3.8
(B) the U.S.ll Japan**
8,128,508 2,140,876
33,257 2,370
4.1
1.1 3,125 1.5 5,793 2.7
50,779 4,530
6.2
2.1 5,395 2.5 10,693 5.0
BWD, birth weight distribution; BW-SMR(s), birth weight-specific mortality rate(s).
*Sum of expected BW-S neonatal or infant deaths {(BWD(%) in the U.S. × total live births in Korea or Japan × BW-SMRs in Korea or Japan)/1,000}; †(Total expected neonatal or infant deaths in Korea or Japan/total live births in Korea or Japan) × 1,000; ‡Sum of expected BW-S neonatal or infant deaths (BW-SMRs in the U.S. × BW-S live births in Korea or Japan/1,000); §(Total expected neonatal or infant deaths in Korea or Japan/total live births in Korea or Japan) × 1,000; llData from the U.S. National Center for Health Statistics; ¶Data from the Statistics Korea; **Data from Japan Ministry of Health, Labour, and Welfare (3-8).
Fig. 1. Actual and expected neonatal and infant mortality rates in Korea after standardization with birth weight distribution (A) and birth weight-specific mortality rates (B) in the U.S. If Koreans had the same birth weight distribution as in the U.S., their crude neonatal and infant mortality rates would be 3.9/6.1. If Koreans had the same birth weight- specific mortality rates as in the U.S., the crude neonatal and infant mortality rates would be 2.0/3.8.
*Data from the U.S. National Center for Health Statistics; †Data from the Statistics Korea (3-6).
Actual Expected after standardization
Neonatal mortality rate Infant mortality rate Expected after standardization Actual
7 6 5 4 3 2 1 0
4.1*
1.8†
4.1 3.9
6.2*
3.2†
6.2 6.1 the U.S.
Korea
Actual Expected after standardization
Neonatal mortality rate Infant mortality rate Expected after standardization Actual
7 6 5 4 3 2 1 0
4.1*
1.8†
4.1
2.0
6.2*
3.2† 6.2
3.8 the U.S.
Korea
A B
Fig. 2. Actual and expected neonatal and infant mortality rates in Japan after standardization with birth weight distribution (A) and birth weight-specific mortality rates (B) in the U.S. If Japanese had the same birth weight distribution as in the U.S., their crude neonatal and infant mortality rates would be 1.5/2.5. If Japanese had the same birth weight- specific mortality rates as in the U.S., the crude neonatal and infant mortality rates would be 2.7/5.0.
*Data from the U.S. National Center for Health Statistics; †Data from Japan Ministry of Health, Labour, and Welfare (3,4,7,8).
Actual Expected after standardization
Neonatal mortality rate Infant mortality rate Expected after standardization Actual
7 6 5 4 3 2 1 0
4.1*
1.1†
4.1
1.5
6.2*
2.1† 6.2
2.5 the U.S.
Japan
A
Actual Expected after standardization
Neonatal mortality rate Infant mortality rate Expected after standardization Actual
7 6 5 4 3 2 1 0
4.1*
1.1†
4.1 2.7
6.2*
2.1† 6.2
5.0 the U.S.
Japan
B
DISCUSSION
NMR and IMR are believed to reflect level of health care and socioeconomic status of a population. Our study demonstrates
that comparing crude NMR and IMR among different countries has a limited value or often is misleading. Our study delineates that lower NMR and IMR in Korea than in the U.S. is primarily due to its favorable BWD, lesser prevalence of births of small
birth weight or premature groups having higher mortality, and little from the difference in BW-S MR. On the other hand, Japan has lower NMR and IMR than the U.S., because of its favorable BWD and also its remarkably low BW-S MR.
IMR of the U.S. ranked lower, the 11th in the world in the pe- riod 1950-1955 with its IMR of 30.5 per 1,000 live births. But this rank has become progressively worsened over time, the 17th in 1970-1975 and the 22nd in the 1990-1995. By the period 2010- 2015 its world rank hit the 40th, although its IMR has declined remarkably to 5.9 per 1,000 live births. This trend was there when we compared IMR of the three countries, the U.S., Japan and Korea, the latter two countries reducing their IMR below that of the U.S., by the late 1960s in Japan and by the 1990s in Korea (9).
This pattern in mortality transition among countries may be readily explained by the status of two determinants of mortality rates, BWD and BW-S MR over time. In the 1950s, there was a wide disparity in health care, particularly in infant care among countries. Then, BW-S MR in general was more influential fac- tor than BWD. But since then knowledge and technology in in- fant health care, particularly neonatal care have progressively diffused to the world, including Korea. Thus, when the level of BW-S MR has become similar in many countries, the difference in the other determinant, BWD has become the predominant factor on the crude NMR and IMR. BWD has become even more important since it has changed little within individual countries over many decades although it has varied widely among coun- tries. In other words, in the middle of the 20th century, the U.S.
had better health care than many other countries, resulting in its low IMR ranking in the world. But when in the late 20th cen- tury, other industrialized or even developing countries have improved their infant care level similar to that of the U.S., the U.S. IMR ranked worse than many of these countries, primarily because of little change in their BWD that has remained worse than many other countries.
In the study period 2009-2010, the U.S. had VLBWI, about 1.5% of all births, but this group contributed to 71.1% of all neo- natal deaths and 53.5% of all infant deaths. In Korea and Japan this proportion of VLBWI were far lower, about half of the U.S., 0.6% and 0.8%, respectively, thus having far less impact on the crude NMR and IMR. Some specific reasons have been suggest- ed for the causes of preterm birth or low birth weight, such as maternal sociodemographic status, race, age, education, health status and access to health care. And these factors were associ- ated with difference in crude IMR (10-14). However, recent stud- ies suggest that among all maternal factors, maternal race or ethnicity is the overwhelming factor in explaining the differ- ence in BWD, thus the resulting difference in NMR and IMR among the countries (15-17). To our knowledge, our study is the first to include both the BWD and also, BW-SMR in com- paring NMR and IMR of Korea, Japan and the U.S.
In conclusion, our study emphasizes that when comparing
NMR or IMR among different populations or over time, one should include the impact of its two components, BWD and BW-SMR. This is particularly important in VLBWI having cru- cial impact on the crude NMR and IMR. The remarkably low, current NMR and IMR in Korea compared to the U.S. and many other countries is certainly not due to its superior infant care but rather due to its favorably low proportion of preterm or low birth weight births. With further improvement in infant medi- cal care in Korea as in Japan, its IMR would rank at near to the top among industrialized countries, surely better than Japan, since the BWD in Korea is more favorable than in Japan.
DISCLOSURE
The authors have no potential conflicts of interest to disclose.
AUTHOR CONTRIBUTION
Conception and design: Kim DH, Jeon J, Park CG, Sriram S, Lee KS. Acquisition of data: Kim DH, Jeon J. Analysis and interpre- tation of data: Kim DH, Jeon J, Park CG, Sriram S, Lee KS. First draft of the manuscript: Kim DH. Revision of the manuscript:
Kim DH, Jeon J, Park CG, Sriram S, Lee KS. Manuscript approv- al: all authors.
ORCID
Do-Hyun Kim http://orcid.org/0000-0002-5003-8475 Jihyun Jeon http://orcid.org/0000-0002-4512-2728 Chang Gi Park http://orcid.org/0000-0003-3366-4279 Sudhir Sriram http://orcid.org/0000-0002-1496-5108 Kwang-sun Lee http://orcid.org/0000-0003-2932-0836 REFERENCES
1. Organisation for Economic Co-operation and Development. OECD health status: infant mortality rates [Internet]. Available at http://data.oecd.org/
healthstat/infant-mortality-rates.htm [accessed on 15 January 2015].
2. Lee KS, Paneth N, Gartner LM, Pearlman MA, Gruss L. Neonatal mortali- ty: an analysis of the recent improvement in the United States. Am J Pub- lic Health 1980; 70: 15-21.
3. Mathews TJ, MacDorman MF. Infant mortality statistics from the 2009 period linked birth/infant death data set. Natl Vital Stat Rep 2013; 61:
1-27.
4. Matthews TJ, MacDorman MF. Infant mortality statistics from the 2010 period linked birth/infant death data set. Natl Vital Stat Rep 2013; 62:
1-26.
5. Statistics Korea. Birth Statistics in 2009. Daejeon: Statistics Korea, 2009.
6. Statistics Korea. Birth Statistics in 2010. Daejeon: Statistics Korea, 2010.
7. Ministry of Health, Labour, and Welfare (JP). Statistics: natality 2010 [In- ternet]. Available at http://www.e-stat.go.jp/SG1/estat/ListE.do?lid=0000 01101824 [accessed on 15 January 2015].
8. Ministry of Health, Labour, and Welfare (JP). Statistics: infant mortality 2010 [Internet]. Available at http://www.e-stat.go.jp/SG1/estat/ListE.do?lid
=000001101826 [accessed on 15 January 2015].
9. United Nations; Central Intelligence Agency (US). List of countries by in- fant mortality rate: CIA world factbook [Internet]. Available at https://en.
wikipedia.org/wiki/List of countries by infant mortality rate [accessed on 24 January 2016].
10. Macdorman MF, Mathews TJ. Recent trends in infant mortality in the United States. NCHS Data Brief 2008; 9: 1-8.
11. Anderson GF, Squires DA. Measuring the U.S. health care system: a cross- national comparison. Issue Brief (Commonw Fund) 2010; 90: 1-10.
12. Mathews TJ, Miniño AM, Osterman MJ, Strobino DM, Guyer B. Annual summary of vital statistics: 2008. Pediatrics 2011; 127: 146-57.
13. Chang JY, Lee KS, Hahn WH, Chung SH, Choi YS, Shim KS, Bae CW. De- creasing trends of neonatal and infant mortality rates in Korea: compared
with Japan, USA, and OECD nations. J Korean Med Sci 2011; 26: 1115-23.
14. Hamilton BE, Hoyert DL, Martin JA, Strobino DM, Guyer B. Annual sum- mary of vital statistics: 2010-2011. Pediatrics 2013; 131: 548-58.
15. Lim JW, Lee JJ, Park CG, Sriram S, Lee KS. Birth outcomes of Koreans by birthplace of infants and their mothers, the United States versus Korea, 1995-2004. J Korean Med Sci 2010; 25: 1343-51.
16. Schempf AH, Mendola P, Hamilton BE, Hayes DK, Makuc DM. Perinatal outcomes for Asian, Native Hawaiian, and other Pacific Islander mothers of single and multiple race/ethnicity: California and Hawaii, 2003-2005.
Am J Public Health 2010; 100: 877-87.
17. Lee JS, Yoon JM, Cheon EJ, Ko KO, Shim JW, Park CG, Bae CW, Lim JW.
Comparison of neonatal and infant mortality rates between infants born in South Korea and those born in the United States. Neonatal Med 2014;
21: 211-7.