pISSN 1598-2033 eISSN 2233-5706 Journal of the Korea Institute of Building Construction, Vol. 13, No. 4
http://dx.doi.org/10.5345/JKIBC.2013.13.4.400
www.jkibc.org
Transition Analysis of Friction Factor According to Pumping Pressure in Pumping Test Using High Strength Concrete for High‐rise Buildings
Kwon, Hae-Won
*Kim, Young-Su
1)Department of Architectural Engineering, Pusan National University, Geumjeong-Gu, Busan, 609-735, Korea
Abstract
In high-rise buildings, high-strength concrete is widely used to reduce the section of structure members under axial load. Also, the price increase of materials is very important item in the high-rise buildings. Especially, concrete used high-pressure pump due to consecutive structural assembly. Unlike slump type of ordinary concrete, high strength concrete has different properties of concrete pumping due to viscosity. However, there have been no Korean studies on the pumping properties of high strength concrete. Therefore, this paper measures the friction factor of high strength concrete with changes in the pressure of concrete pumping. We analyzed the trends of the friction factor based on changes in the pressure of concrete pumping, and then calculated the quantity of concrete deposited for each specified concrete strength and location of placement. After comparing these results with the quantity of concrete deposited measured in field, we evaluated the pumping properties of high strength concrete. Through the tests and the review, we attempt to suggest some basic information for the In-Situ application of high strength concrete.
Keywords : friction factor, pumping test, high strength concrete, pumpability
1. Introduction
More high-rise buildings have been built in Korea for efficient land use and a fine view.
High-strength concrete is chiefly used for high-rise buildings to reduce the section of the structural members and secure the axial load. In addition, price increase(=>lifting) of construction materials is one of the main factors to be considered. In particular, for cold joint prevention and security of structural durability, all the tasks and works in a high-rise building construction project should be performed continuously, and a high-pressure pump(=a stationary pump) is generally used[1].
Received : March 5, 2013
Revision received : March 11, 2013 Accepted : April 1, 2013
* Corresponding author : Kwon, Hae-Won
[Tel: 82-70-7127-8104, E-mail: [email protected]]
©2013 The Korea Institute of Building Construction, All rights reserved.
But due to its high viscosity, high-strength concrete shows different pumping characteristics from slump type of ordinary concrete[2,3].
Although the pumping characteristics are an important factor that needs to be considered at an initial phase for the selection of pumping equipment and (vertical(x)) zoning for construction, few cases have been studied and analyzed in Korea[2,3,4].
Therefore, concrete discharge velocity was measured based on pumping pressure to obtain the friction factor[6,7], which was compared with the velocities estimated at different places and different pumping pressures.
In this study, the friction factor of the
high-strength concrete was estimated at different
pumping pressures, and was compared with the
friction factor obtained in the construction site in
order to present a reasonable friction factor
calculation method for the site applicability of high-strength concrete, and provide fundamental data for the site applicability of pumping.
2. Research plan and methodology
2.1 Research plan
To verify the pumping characteristics of high-strength concrete, the tests were planned by dividing them into Series I and II as shown in Table 1. In Series I of the horizontal pumping test, the discharge velocity and discharge amount with the change of pumping pressure by design strength were estimated in order to understand the characteristics of the friction factor of high-strength concrete. In Series II of the vertical pumping test, pumping pressure and discharge velocity with the change of placement height and design standard were measured at the site to understand the relationship with the estimated values in Series I. Through the tests, the characteristics of friction factor based on the changes of pumping pressure were verified, and the results obtained from the actual application were analyzed to provide fundamental data for the site application of high-strength concrete for high-rise building construction projects.
Series
No. Classification
of experiment Factors Variables
I Horizontal pumping test of high strength
concrete -Compressive
strength(MPa) 40, 50, 60 I Horizontal pumping test
of high strength
concrete Pumping
pressure(Bar) 60, 80, 100 II Vertical pumping test
of high strength
concrete -Compressive
strength(MPa) 40, 50, 60 II Vertical pumping test
of high strength concrete
Height of placing floor(m)
(Recovery Place)
70, 85, 100, 115, 130, 145, 160, 175, 190,
205
Table 1. Experimental scheme
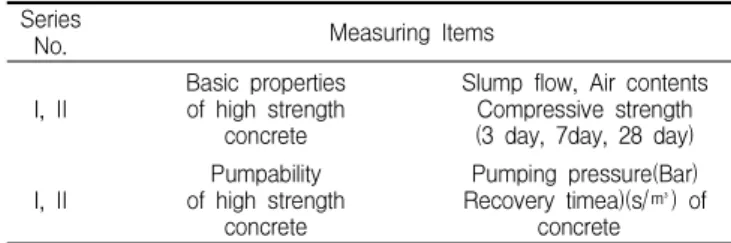
Table 2. Measuring items
SeriesNo. Measuring Items
I, II Basic properties of high strength
concrete
Slump flow, Air contents Compressive strength (3 day, 7day, 28 day)
I, II Pumpability
of high strength concrete
Pumping pressure(Bar) Recovery timea)(s/㎥) of
concrete
a) Time it took to output a certain amount of concrete from pipe.
2.2 Experimental method
To provide the fundamental data for the site application of high-strength concrete, in terms of slump flow, air content and compressive strength by age, the high-strength concrete was tested through Series I and II in compliance with KS. In addition, the tests of the Series I and II can be summarized as follows.
2.2.1 Horizontal pumping test(Series I)
In the horizontal pumping test, different levels of pumping pressure were set to understand the friction factor of high-strength concrete. The pipes were zigzag placed horizontally to about 400m in total length and connected with each other using curved pipes with a radius of either 500mm or 1000mm.
The physical properties of the concrete used in
the study were tested before and after pumping,
and the number of cylinder strokes and cycles
were recorded using dynamic data loggers placed
at different locations of the pumping equipment
and the pipes from the beginning of the pumping
to the complete filling of the hopper after the
concrete was filled in the entire pipe. In addition,
all the watches used in the test were set
identically to the second to ensure the precision of
the records. However, the filling time of concrete
using the hopper was measured from the point of
time when the concrete was discharged stably and
continuously without discontinuation to secure
homogenous pumpability.
Transition Analysis of Friction Factor According to Pumping Pressure in Pumping Test Using High Strength Concrete for High‐rise Buildings
Figure 1. Horizontal pumping test
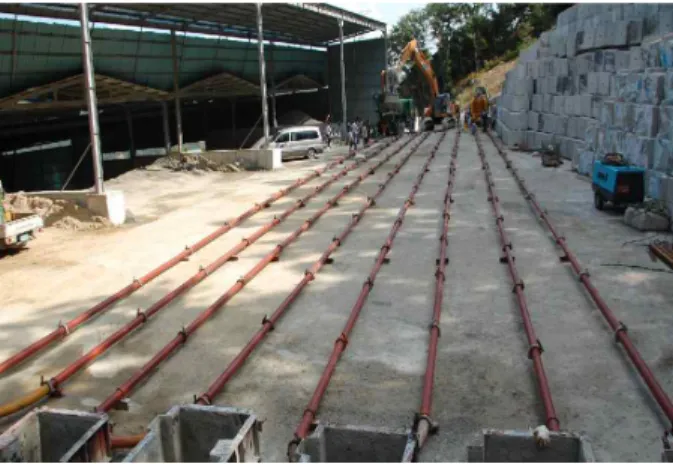
2.2.2 Vertical pumping test (Series II)
In the vertical pumping test, the pumping pressure and discharge volume per hour were measured at the setting height between 70m and 205m of an actual structure every 15 minutes within an error range of +2.0 and-1.0%, the physical properties of the incoming materials were tested, and the 28-day compressive strength was also measured as shown in Figure 3. Whenever the discharge volume was measured at each height, it was measured more than 8 times by continuously placing concrete from a ready-mixed concrete truck(6㎥), and the physical properties of incoming materials were tested in compliance with the site quality control criteria.
Figure 3. Field application of Vertical pipe line
2.2.3 Friction factor of the concrete
Concrete is a composite that has both solid and
liquid properties. However, it was assumed that
concrete flows steadily without being contracted,
and the friction factor was calculated using
Equation (1) obtained through Bernoulli ’s rule and
the conservation of energy principle based on the
time and the pressure measured during which a
certain volume of concrete is discharged [2,3,8].
×
×
× × --(1)
Here,
: pumping pressure ( kgf/㎡ )
: friction loss within the pipe ( kgf/㎡ )
: local pressure loss ( kgf/㎡ )
: pressure loss from height ( kgf/㎡ ) : friction factor
: horizontal pipe length ( m ) : diameter of the pipe ( m ) ) : velocity of flow ( m/s )
: acceleration of gravity (9.8 m/s
2) : specific weight ( kgf/㎥ )
: local friction resistance coefficient : vertical pipe height ( m )
3. Experimental results and considerations
3.1 Horizontal pumping test results
Through the analysis of the basic properties of high-strength concrete it was found that the slump flow and air content satisfied the permit standards stipulated by KS, and all of the 28 compressive strengths also meet the design strength as shown in Table 3. The concrete placed at the pressure of 100 bar was shown to lose about 70-100mm slump flow. This is believed to be because the high viscosity of the concrete increased the pumping load and the flow was deteriorated after the pumping[9].
Table 3. Physical properties of horizontal pumping test
Classification(Fck(MPa), Pumping before & after)
Fresh concrete
properties Compressive
strength(MPa) Slump
flow(mm) O-lot
(s) Air
Contents
(%) 3 day 7 day 28 day
40 before 690/690 2″50 4.0 37.9. 42.0 50.8
after 630/610 2″40 3.5 - - 53.3
50 before 700/680 4″59 4.3 41.6 46.2 61.1
after 600/590 2″84 4.0 - - 61.3
60 before 700/680 3″50 4.5 51.7 59.6 72.4
after 600/590 2″43 4.0 - - 71.6
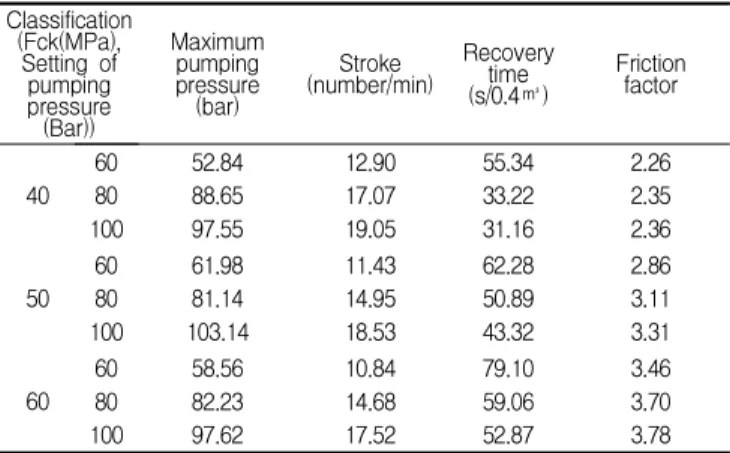
pumping characteristics of high-strength concrete were, as shown in Table 4, found to be as follows.
The higher the pumping pressure, the faster the discharge velocity, and the higher the fiction factor in all of the design strength levels. From this, it can be interpreted that the increase in pumping velocity resulted in more crashes between particles and higher strength, and the friction rose as a result[9]. In addition, the higher the design strength, the lower the discharge velocity, which might imply that a relatively low water-to-binder ratio caused friction between aggregate particles, and the friction factor also increased accordingly[10].
Table 4. Pumpability properties of horizontal pumping test
Classification(Fck(MPa), Setting of pumping pressure (Bar))
Maximum pumping pressure (bar)
Stroke
(number/min) Recovery
(s/0.4㎥)time Friction factor
40 60 52.84 12.90 55.34 2.26
80 88.65 17.07 33.22 2.35
100 97.55 19.05 31.16 2.36
50
60 61.98 11.43 62.28 2.86
80 81.14 14.95 50.89 3.11
100 103.14 18.53 43.32 3.31
60 60 58.56 10.84 79.10 3.46
80 82.23 14.68 59.06 3.70
100 97.62 17.52 52.87 3.78
3.2 Vertical pumping test results
Table 5 shows the basic physical properties of the high-strength concrete in the vertical pipes placed at the site. For the results of the test of high-strength concrete, the average of 400 tests of the physical properties of incoming materials is shown. The results of air content and slump flow that satisfy the incoming inspection criteria were used, and the 28-day compressive strengths were all found to satisfy the design strength.
In the vertical pumping test, the pumping
pressure and discharge volume per hour was
measured every 15 minutes at the setting height
Transition Analysis of Friction Factor According to Pumping Pressure in Pumping Test Using High Strength Concrete for High‐rise Buildings
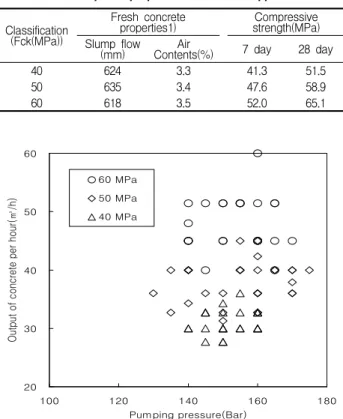
between 70m and 205m of an actual structure within an error range between +2.0 and -1.0 percent. Figure 4 shows the test results, and the average discharge volume per hour was between 20 and 60㎥, and pumping pressure was between 120 and 180 bar. At this time, the higher the concrete was placed, the less the discharge volume and the higher the pumping pressure. In addition, the highest discharge volume per hour was found at the lower part of the building structure less than 30 floors, despite the use of 60 MPa high-strength concrete with a high friction factor. This is believed to be because the discharge velocity increased as the pumping pressure became relatively higher.
Table 5. Physical properties of vertical application
Classification(Fck(MPa))
Fresh concrete
properties1) Compressive
strength(MPa) Slump flow
(mm) Air
Contents(%) 7 day 28 day
40 624 3.3 41.3 51.5
50 635 3.4 47.6 58.9
60 618 3.5 52.0 65.1
20 30 40 50 60
100 120 140 160 180
Pumping pressure(Bar)
Output of concrete per hour(㎥/h)
60 MPa 50 MPa 40 MPa
Figure 4. Output of concrete per hour and pumping pressure of vertical pumping test
3.3 Horizontal and vertical pumping tests results and considerations
Through the horizontal and vertical pumping
tests, the friction factor of high-strength concrete with the changes of pumping pressure was measured, based on which Equation(1) was drawn using Bernoulli ’s rule and the conservation of energy principle. The characteristics of the friction factor were verified to estimate discharge velocity at different heights of concrete displacements in an actual concrete site by using Equation(1).
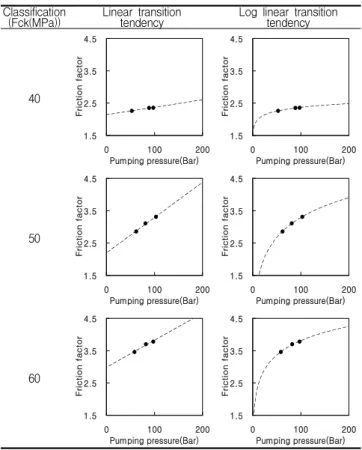
Therefore, to understand the transition tendency of the friction factor with the changes in pumping pressure, the transition tendency of the friction factor was analyzed with the changes in pumping pressure at each design strength level. The analysis of the trend line was performed using the linear and log linear models. Tables 6 and 7 are the results of the analyses of the trend line. The higher the pumping pressure, the higher the friction factor. In particular, the log linear model showed a coefficient of determination(R2) that was higher than 0.95, which better matched the transition tendency of the friction factor, and it is considered desirable to use the log model in estimating the friction factor with the changes of the pressure. The transition tendency of the friction factor was calculated with the changes of the pressure obtained from the field application in the vertical pumping test in Figure 4 using the log linear model in Table 7 that has a relatively higher coefficient of determination. Also, the friction factor was recalculated by substituting the pumping pressure, discharge volume per hour, and placement height obtained from the vertical pumping test at the site in Figure 4 into Equation (1).
The recalculated friction factor based on the
figures measured in the vertical pumping test and
the friction factor estimated using the log linear
model based on the transitional tendency of the
pressure obtained in the horizontal pumping test
were analyzed, and the results are shown in Figure
was shown, which has a relatively high correlation.
However, the y-intercept was about -0.03, and the recalculated friction factor using the figures of the vertical pumping test was slightly higher, which is believed to be because the slump flow of the concrete in the vertical pumping test was slightly lower than that in the horizontal pumping test.
Classification
(Fck(MPa)) Linear transition
tendency Log linear transition tendency
40
1.5 2.5 3.5 4.5
0 100 200
Pumping pressure(Bar)
Friction factor
1.5 2.5 3.5 4.5
0 100 200
Pumping pressure(Bar)
Friction factor
50
1.5 2.5 3.5 4.5
0 100 200
Pumping pressure(Bar)
Friction factor
1.5 2.5 3.5 4.5
0 100 200
Pumping pressure(Bar)
Friction factor
60
1.5 2.5 3.5 4.5
0 100 200
Pumping pressure(Bar)
Friction factor
1.5 2.5 3.5 4.5
0 100 200
Pumping pressure(Bar)
Friction factor
Table 6. Transition tendency of friction factor
Classification
(Fck(MPa)) Type of
function R squared Log linear transition tendency
40 Linear
Log Linear 0.9749
0.9951 y = 0.0026 x + 2.1160 y = 0.1743 ln(x) + 1.5666
50 Linear
Log Linear 0.9007
0.9776 y = 0.0045 x + 3.0083 y = 0.2689 ln(x) + 2.1985
60 Linear
Log Linear 0.9676
0.9702 y = 0.0088 x + 2.9359 y = 0.6304 ln(x) + 0.8873
Table 7. Transition tendency of friction factor and R squared
These results are different from those of Bernoulli ’s rule in the assumption that the concrete is non-contracted fluid. For better estimations, the
changes of pumping pressure should be reflected when the discharge velocity is estimated at each concrete placement level.
Figure 5. Friction factor of proposed formular and field application result
4. Conclusion
In this study, the transition tendency of the friction factor was verified with the changes of pumping pressure and design strength through the horizontal pumping test, and the friction factor was recalculated using Bernoulli ’s rule and the conservation of energy principle based on the figures measured in the vertical pumping test. As a result, the transition tendencies of the friction factor with the changes of the pumping pressure were compared, and the findings of this research are as follows.
1) All the slump flow levels and air content levels are found to be within the ranges of 600±100
㎜ and of 3.5 ± 1.5%, respectively, and all of
the 29-compressive strength levels were also
shown to satisfy the design strength, both in
the horizontal and in the vertical tests.
Transition Analysis of Friction Factor According to Pumping Pressure in Pumping Test Using High Strength Concrete for High‐rise Buildings