Mapping QTL for ratooning ability in advanced backcross lines from an Oryza sativa x O. rufipogon cross
Shi-dong Ji, Xiao Luo, Sang-Nag Ahn*
Department of Agronomy, College of Agriculture and Life Sciences, Chungnam National University, Daejeon 305-764, Korea Received on 3 March 2014, revised on 21 March 2014, accepted on 21 March 2014
Abstract : Ratooning ability is one of the major different traits from perennial to cultivated rice and annual type. We developed a set of 126 introgression lines derived from a cross between Hwayeong and W1944 (O. rufipogon) to gain an insight into the genetic factors underlying differences between common wild rice and cultivated rice. One IL, CR6 among the 126 ILs of BC3F4 showed a significant difference in rationing ability compared with Hwayeong. To further characterize the rationing ability, CR6 was selected and crossed to Hwayeong to produce three secondary populations, BC4F2, BC4F3 and BC5F2. In the Hwayeong background, the W1944 allele was associated with an increase in rationing ability. QTL analysis showed that the qRAT5 for rationing ability was linked to RM194 (R2=6.6%, 19.6%, and 44.5%
in the BC4F2, BC5F2, and BC5F3, respectively). The putative qRAT5 was also tightly linked to QTLs for spikelets per panicle and grain weight indicating that this region harbors a QTL cluster related to domestication. To our knowledge, this is the first report to map the major QTL for ratooning ability in rice. The SSR markers linked to qRAT5 would be useful in marker-assisted selection for breeding lines with enhanced ratooning ability.
Key words : Rice, Ratooning ability, QTL, Introgression lines
*Corresponding author: Tel: +82-42-821-5728 E-mail address: [email protected]
I. Introduction
Rice was first domesticated from wild species about 10,000 years ago (Oka, 1988). During the course of domestication from wild rice to cultivated rice, profound changes of agronomic traits and genetic diversity occurred (Sun et al., 2001). It was a process that occurred over an extended period of time.
Genetic loci that were selected from existing genetic variation in the wild species may appear fixed within domesticated rice, but will show variation within the wild species (Sweeney and McCouch, 2007). Many studies have shown that domestication traits are influenced by many loci through crossing between O.
sativa cultivars and O. rufipogon, combined with mapping (Xiong et al., 1999; Bres-Patry et al., 2001;
Cai and Morishima, 2002; Thomson et al., 2003).
Introgression lines (ILs), or chromosome segment substitution lines, are effective for searching and identifying QTL as a single Mendelian factor by blocking noise from the genetic background. Eshed and Zamir (1994) constructed the first complete set of introgression lines in tomato consisting of near isogenic lines (NILs) carrying single Lycopersicon pennellii chromosomal segment in an otherwise homogeneous background of Lycopersicon esculentum, representing the entire wild tomato genome. Paterson et al. (1990) proposed substitution mapping as a method for fine mapping of QTLs. In rice, introgression lines carrying O. glaberrima were constructed (Doi et al., 1997). Using introgression lines combined with substitution mapping, several studies demonstrated that ILs are powerful tools for the identification of new genes (Eshed and Zamir, 1994; Kubo et al., 2002) and distinguishing pleiotropy versus linkage (Yamamoto et al., 1998).
Ratooning is the ability of rice plants to regenerate
new tillers after harvest and may be one practical way to increase rice production per unit area. A large variation exists for rationing ability among rice germplasm and cultural management, light, temperature, soil fertility and growth duration affect ratooning ability (Cuevas-Perez, 1980). Ratooning ability is one major characteristic of some O. rufipogon accessions (Cai and Morishima, 2002). W1944, an accession of O.
rufipogon belongs to perennial ecotype. The perennial and annual ecotypes are characterized by a set of life history traits. The perennial habit compared to the annual is associated with vigorous vegetative growth and low seed production. Ratooning ability is one of the major different traits from perennial to cultivated rice and annual type. Genetic studies on rationing ability are quite limited.
In the previous studies (Lee et al. 2005, Yuan et al. 2009), 126 introgression lines were developed from a cross between a wild progenitor, W1944 (O .rufipogon) and an elite Korea japonica cultivar (O. sativa), Hwayeong. In this study, we developed nearly isogenic lines (NIL) in the Hwayeong background containing a single O.rufipogon-derived introgression on chromosome 5 to fine map the QTL for rationing ability.
II. Materials and methods
1. Plant materials
An introgression line CR6 (BC3F4) was selected to analyze QTL for ratooning ability. CR6 carried six segments of W1944 and the procedure to develop mapping populations is described in the study by Lou et al. (2013). Three populations BC4F3, BC5F2 and BC5F3 were produced in 2008, 2009 and 2010, respectively. Three populations consisted of 311 and 317 plants and 14 lines, respectively. 14 BC5F2 plants with informative recombination breakpoints between RM18003 and RM249 were selfed to produce 14 BC5F3
lines for substitution mapping.
2. Evaluation of low-temperature germinability
Two populations (BC4F3, and BC5F2), 14 recombinant lines along with the two parental lines CR7111-30 and Hwayeong were grown in the field during the summer of 2008, 2009 and 2010 at the Chungnam National University, Daejeon, respectively. All the populations and lines were planted with 15cm between plants, 30cm between rows and 25 plants per row. Each BC5F3
line was represented with one replication.
Three methods were adopted to evaluate the ratooning ability. Firstly, plants were cut 10cm above soil one month after heading (method 1) following the method by Cai and Morishima (2002). Secondly, plants were cut under panicle neck one month after heading (method 2), and lastly, plants were cut right under panicle neck two months after heading (method 3). In Methods 1 and 2, newly grown shoots and old shoots of plants were counted after harvest, and the ratio of newly grown shoots to old shoots was calculated and used as the ratooning ability. In Method 3, both the number of newly emerged shoots (SN) and shoot length (SL) were considered. Ratooning ability was scored by 0-9 scales as follows: 0; no new shoot, 1;
SN ≤3, SL≤3cm, 3; 3<SN≤4, 3cm<SL≤5cm, 5; 4<SN
≤5, 5<SL≤7cm, 7; 5<SN≤7, 7<SL≤10cm and 9; SN>7, SL≥10cm. In the BC4F3 and BC5F2 populations, ratooning ability of the plants was evaluated by Method 3. And Methods 1, 2, and 3 were used to evaluate ratooning ability in the BC5F3 lines. Each five plants in each row in the BC5F3 lines were used to evaluate the ratooning ability with Methods 1, 2 and 3, respectively.
3. DNA extraction and SSR analysis
DNA was extracted from fresh leaf of each plant of BC4F3, BC5F2 populations and BC5F3, DNA extraction was performed using the CTAB method described in Causse et al. (1994). Among the heterozygous BC4F3
Table 1. QTL detected in the BC4F3 and BC5F2 populations and BC5F3 lines.
Trait# Marker Year Pop. P R2 Phenotypic mean
HH HW WW
RAT RM194
2008 BC4F3 method 3 0.0001 6.6 1.9±1.7 2.6±2.0 3.2±1.8
2009 BC5F2 method 3 0.0001 19.6 1.9±2.3 4.2±2.8 5.6±2. 8
2010 BC5F3
method 2 0.0001 43.0 20.1±17.8 46.1±26.1 84.6±37.1 method 1 0.0001 31.1 10.4±12.9 35.1±27.1 56.0±31.8
method 3 0.0001 44.5 1±1.7 4±2.7 7±2.1
BC4F3, BC5F2 populations and BC5F3 lines were used to detect QTLs on chromosome 5 in 2008, 2009 and 2010, respectively. # RAT: ratooning ability.
and BC5F3 lines, each plant genotype was determined by tightly linked SSR markers in the target region.
The PCR reaction mixture containing 30ng of DNA, 1 unit of Taq polymerase, 2.5 uM each dNTP, 8 uM F, R primer, and 10x PCR buffer (10 mM Tris –HCl pH 8.3, 50 mM KCl, 1.5mM MgCl2, 0.1% Gelatin). Ampli- fication was accomplished with the Thermo (BioRad) by using the step-cycle program set to denature at 94℃ for 5 min, subsequent denaturing was at 94℃
for 1 min., annealing was 55℃ for 1 min., extension was 72℃ for 1 min., and step 2 through 4 were repeated for a total 35 cycles with a final extension at 72℃ for 5 min. PCR products were run on 4%
polyacrylamide denaturing gel for 2 hours at 1800- 2000V, and marker bands were revealed using the silver staining kit purchased from Bioneer Co., Korea (Panaud et al., 1996, www.bioneer.co.kr). Amplified DNA fragments showing clear polymorphism were used for the analysis of BILs and linkage mapping.
According to available public rice genomic sequence (http:// www.gramene.org) and (http://rice.genomics.
org.cn/rice/index), one insert/deletion markers, INDEL3 was developed using primer 3.0 (See details in Lou et al., 2013).
4. QTL analysis
One-way ANOVA was performed to determine the effect of each marker on each trait. Phenotypic means of three genotypic classes, Hwayeong and W1944
homozygote and heterozygote were compared based on t-test and a probability level of 5% was used as the threshold for the detection of a QTL. The proportion of the total phenotypic variation explained by each QTL was calculated as an R2 value, from the regressions of each marker/phenotype combination. QTLs were fine mapped by comparing the phenotypic means of three genotypic classes within the target region using the ANOVA feature in DataDesk 4.0 program.
III. Results
1. Comparison of the parents for ratooning ability and variation in the population
Frequency distribution of the ratooning ability in BC5F2 are displayed in Fig. 1. Frequencies of the rationing ability showed bimodal distributions. Most of the plants showed phenotypic values between two parents in Method 3.
2. QTL for ratooning ability
A BC4F3 population was developed to detect OTL for ratooning ability which showed segregation in the BC4F2 population (Lou et al., 2013). For construction of isogenic lines, a plant CR7111-30 carrying the O.
rufipogon segment on chromosome 5from the BC4F3
population was crossed to Hwayeong and a BC5F2
population was produced. Ratooning ability was
Fig. 1. Frequency distribution of the ratooning ability in the BC5F2 population. WW, HH and HW indicate O. rufipogon homozygote, Hwayeong homozygote and heterozygote, respectively.
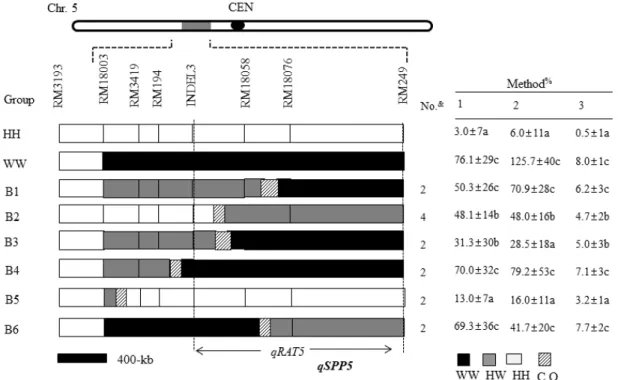
Fig. 2. Graphical genotypes of the BC5F3 lines that were used for the substitution mapping of qRAT5. The white portions of the graph(HH) indicate homozygous Hwayeong chromosome segments, the black regions (WW) indicate homozygous O. rufipogon chromosomes, the gray areas (HW) indicate heterozygous regions, and the slashed areas are regions where crossing-over occurred.
The table on the right of the graphical genotypes shows the mean values of RAT for each genotype. The broken vertical lines define the interval containing qRAT5. qSPP5 was delimited between INDEL3 and RM18076 in the report by Lou et al. (2013). The relationship between qRAT5 and qSPP5 remains to be clarified. &Number of lines in each group. #The numbers that are followed by different letters in each column were significantly different according to Tukey’s HSD test at 5%.
evaluated in the BC4F3 and BC5F2 populations. Four markers (RM18003, RM3419, RM194 and Indel3) on chromosome 5 were used to genotype the BC4F3
population (Fig. 2). The QTL analysis results indicated the existence of the QTL for rationing ability on chromosome 5 (Table 1). The same QTL was also
detected in three populations. The phenotypic variance explained by each QTL ranged from 6.6% (BC4F3) to 44.5% (BC5F3) (Table 1). The qRAT5 QTL explained 31.1-44.5% of the total phenotypic variance in BC5F3, respectively indicating that qRAT5 is the major QTL.
3. Correlation coefficients
Correlation coefficients showed that the RAT has significant correlation coefficient with SPP (r= 0.52, P<0.01), but negative coefficient with grain weight (r= -0.60, P<0.01) in the BC5F3 lines.
4. Substitution mapping of qRAT5 using BC5F3 lines
Substitution mapping of qRAT5 was carried out using 14 BC5F3 lines (Fig. 2). Eight markers were used to screen 14 BC4F3 lines, and these lines were
evaluated for the RAT. The lines were classified into 6 groups based on the genotypes of the SSR markers.
The mean phenotypic values of the RAT for each group were compared to those of the controls, Hwayeong and CR7111-30. The most informative group was B2.
The RAT of group B2 with a breakpoint between markers RM18058 and INDEL3 displayed significant differerence from that of CR7111-30 but was significantly higher than that of Hwayeong. These results imply that qSPP5 was located downstream of INDEL3 and upstream of RM249. It should be noted that the RAT of group B3 was not statistically different from that of group B2 although their genotypes are different (Fig. 2). This discrepancy between two groups might be due to the evaluation method because rationing ability is affected by many factors.
IV. Discussion
Introgression lines are identical for the entire genome except for a few introgressed segments compared with the recurrent parent, and all the phenotypic variation in the ILs could be associated with the introgressed segment (Eshed and Zamir 1994). A set of 126 introgression lines derived from a cross between Hwayeong and W1944 (Orufipogon) was developed by using marker-assisted selection (Yuan et al. 2009). In this study, one IL, CR6 from the 126 ILs, was chosen to further characterize the rationing ability QTL, qRAT5. Our results revealed that introgression lines were powerful tools in identifying genes underlying complex quantitative traits. In Hwayeong background, the W1944 allele at the qRAT5 locus was associated with higher regeneration ability. QTL analysis showed that qRAT5 was tightly linked to RM194 (R2=6.6%, 19.6%, 44.5% in BC4F3, BC5F2 and BC5F3, respectively). As documented in this study, R2 values steadily increased with advanced generations of backcrossing, from 6.6% in the BC4F3
generation to between 31.1 and 44.5% in the BC5F3
generation. As the number of spurious donor (i.e., O.
rufipogon) introgressions in the genetic background decreased and the between markers and the target gene(s) decreased, the proportion of the phenotypic variation that could be explained by the markers was greatly enhanced.
O. rufipogon is classified into perennial and annual ecotype, being the wild progenitor of cultivated rice (Oka 1988). The perennial habit compared to the annual is associated with vigorous vegetative growth and low seed production (Cai and Morishima, 2002).
Ratooning ability is one main method to evaluate vegetative vigor. Ratooning is considered to be one practical way to increase rice production per unit area and unit time. Because rationed rice has shorter duration than a new crop, it may have potential to increase productivity where cropping intensity is limited by inadequate irrigation facilities (Zandstra and Samson, 1979. Cuevas-Perez, 1980). However, genetic studies on ratooning ability are quite limited.
Zhenbo et al. (1997) identified 6 QTLs for rationing ability on chromosomes 1, 3, 5, 6, and 7 using 133 doubled haploid lines derived from a cross between Zhaiyeqin 8 (indica) and Jingxi 17 (japonica). These QTLs explained 8.5 - 18.3% of the phenotypic variance.
Ishimaru et al. (2001) detected three QTLs for ratooning ability on chromosomes 5, 6 and 12 using 98 BC1 plants from a cross between Nipponbare and Kasalath. Cai and Morishima (2002) detected two QTLs for ratooning ability on chromosomes 6 and 11 using RILs from a cross between W1944 (O. rufipogon) and Pei-kuh (indicia).
It is noteworthy that the QTL on chromosome 6 was shared by three independent reports. The location of qRAT5 detected in this study is different from the QTL detected by Ishimaru et al. (2001) which is located on the terminal short arm region of chromosome 5.
Although the relationship between qRAT5 in this study and the QTL identified by Zhenbo et al. (1997) is not clear because lack of common markers and a low resolution, qRAT5 detected in the present study
might be a new locus for ratooning ability based on its position.
Many researches were carried out to map domes- tication-related traits using O. rufipogon as plant materials (Xiao et al., 1998; Xiong et al. 1999;
Bres-Patry et al. 2001; Cai and Morishima 2002;
Thomson et al. 2003; Xie et al. 2006). Several researchers have noted that QTLs for domestication traits tend to cluster within a certain region of the rice genome.
These clusters for domestication traits have been reported on rice chromosomes 3, 4, 6, 7, 8, 9, 11 and 12 (Xiong et al. 1999; Cai and Morishima 2002).
However, no QTL cluster for domestication-related traits was reported on chromosome 5. In the previous study, we reported a tight linkage of QTLs for grain weight and spikelets per panicle on chromosome 5 (Luo et al., 2013). Using the same set of isogenic lines, we detected qRAT5 in the similar region on the short arm of the chromosome 5 and these QTLs were all linked to RM194, indicating a QTL cluster in the region.
So far, no major QTL associated with ratooning ability has been detected suggesting that qRAT5 is a new QTL for ratooning ability. The locus, qRAT5 is of particular interest because it is assocated with higher SPP (data not shown). Additional experiments are needed to determine the effect of qRAT5 on other agronomic traits.
Acknowledgements
This work was carried out with the support of “Golden Seed Project” (Project No. PJ00993301), Ministry of Agriculture, Food and Rural Affairs (MAFRA), Ministry of Oceans and Fisheries (MOF), Rural Development Administration (RDA) and Korea Forest Service (KFS), Republic of Korea.
References
Bres-Patry C, Lorieux M, Clement G, Bangraz M, Ghesquiere A. 2001. Heredity and genetic mapping of domestication-related
traits in a temperate japonica weedy rice. Theor Appl Genet 102:118-126.
Cai HW, Morishima H. 2002. QTL clusters reflect character associations in wild and cultivated rice. Theor Appl Genet 104:1217-1228.
Causse MA, Fulton TM, Cho YG, Ahn SN, et al. 1994. Saturated Molecular Map of the Rice Genome Based on an Interspecific Backcross Population. Genetics 138:1251-1274.
Cuevas-Perez FE. 1980. Inheritance and association of six agronomic traits and stem-base carbohydrate concentrations on ratooning ability in rice Oryza sativa L. Ph. D. Thesis, Oregon State University. p. 102.
Doi K, Iwata N, Yoshimura A. 1997. The construction of chromosome introgression lines of African rice (Oryza glaberrima Steud.) in the background of japonica (O. sativa L). Rice Genet Newsl 14:39-41.
Eshed Y, Zamir D. 1994. Introgressions from Lycopersicon pennellii can improve the soluble-solids yield of tomato hybrids. Theor Appl Genet 88:891-897.
Ishimaru K, Yano M, Aoki N, Ono K, Hirose T, Lin SY, Monna L, Sasaki T, Ohsugi R. 2001. Toward the mapping of physiological and agronomic characters on a rice function map: QTL analysis and comparison between QTLs and expressed sequence tags. Theor Appl Genet 102:793-800.
Kubo T, Aida Y, Nakamura K, Tsunematsu H, Doi K, Yoshimura A. 2002. Reciprocal chromosome segment substitution series derived from Japonica and Indica cross of rice (Oryza sativa L.). Breed Science. 52:319-325.
Lee SJ, Oh CS, Suh JP, McCouch SR, Ahn SN. 2005.
Identification of QTLs for domestication-related and agronomic traits in an Oryza sativa × O. rufipogon BC1F7 population.
Plant Breeding 124:209-219.
Luo X, Ji SD, Yuan PR, Lee HS, Kim DM, Balkunde S, Kang JW, Ahn SN. 2013. QTL mapping reveals a tight linkage between QTLs for grain weight and panicle spikelet number in rice. Rice 6:33.
McCouch SR, Teytelman L, Xu Y, Lobos KB, et al. 2002.
Development and mapping of 2,240 new SSR markers for rice (Oryza sativa L.). DNA Research 9:199-207.
Oka HI. 1988. Origin of Cultivated Rice. Elsevier Science/Japan Scientific Societies Press.
Panaud O, Chen X, McCouch SR. 1996. Development of microsatellite markers and characterization of simple sequence length polymorphism (SSLP) in rice (Oryza sativa L.).
Molecular General Genetics. 252:597-607.
Paterson AH, Deverna JW, Lanini B, Tanksley SD. 1990. Fine mapping of quantitative trait loci using selected overlapping recombinant chromosomes in an interspecies cross of tomato. Genetics 124:735-742.
Sun CQ, Wang XK, Yoshimura A, Iwata N. 2001. Comparison of the genetic diversity of common wild rice (Oryza rufipogon Griff.) and cultivated rice (O. sativa L.) using RFLP markers. Theor Appl Genet 102:157-162.
Sweeney M, McCouch S. 2007. The complex history of the
domestication of rice. Ann Bot: doi 10.1093/aob/mcm128 Thomson MJ, Tai TH, McClung AM, Lai XH, Hinga ME,
Lobos KB et al. 2003. Mapping quantitative trait loci for yield, yield components and morphological traits in an advanced backcross population between Oryza rufipogon and the Oryza sativa cultivar Jefferson. Theor Appl Genet 107:479-493.
Xiao J, Li J, Grandilloa S, Ahn SN, Yuan L, Tanksley SD et al. (1998) Identification of trait-improving quantitative trait loci alleles from a wild rice relative, Oryza rufipogon.
Genetics 150: 899-909.
Xie X, Song MH, Jin F, Ahn SN, Suh JP, Hwang HG et al.
2006. Fine mapping of a grain weight quantitative trait locus on rice chromosome 8 using near-isogenic lines derived from a cross between Oryza sativa and Oryza rufipogon.
Theor Appl Genet 113:885-894.
Xiong LZ, Liu KD, Dai XK, Xu CG, Zhang Q. 1999.
Identification of genetic factors controlling domestication-related
traits of rice using a F2 population of a cross between Oryza sativa and O. rufipogon. Theor Appl Genet 98:243-251.
Yamamoto T, Kuboki Y, Lin SY, Sasaki T, Yano M. 1998. Fine mapping of quantitative trait loci Hd-1, Hd-2 and Hd-3, controlling heading date of rice, as single Mendelian factor.
Theor Appl Genet 97:37-44.
Yuan PR, Kim HJ, Chen QH, Ju HG, Lee SJ, Ji SD, Ahn SN.
2009. QTL dissection of agronomic and domestication trait using introgression lines carrying wild rice (Oryza ruffipongon Griff.) segments in cultivated rice (O. sativa L.) background.
J Crop Sci Biotech 12(4):241-248.
Zandstra HG, Samson BT. 1979. Rice ratoon management.
Paper presented at the International Rice Research Conference, 17-21 April. p. 10.
Zhenbo T, Lishuang S, Zuolian Y, Chaofu L, Ying C, Kaida Z, Lihuang Z. 1997. Identification of QTLs for ratooning ability and grain yield traits of rice and analysis of their genetic effects. Acta Agronomica Sinica 23(3):289-295.