JOURNAL OF THE KOREAN SOCIETY OF AGRICULTURAL ENGINEERS, MAR. 2008, pp. 11-16
Scenario-Based Exposure Risk Assessment of Molinate in a Paddy Plot : (1) Analysis of simulation results
시나리오별 논에서의 Molinate 노출위험도 분석: (1) 시뮬레이션 결과 분석
Chung, Sang-Ok*,†․Park, Ki-Jung**․Son, Seung-Ho*
정상옥*,†․박기중**․손성호*
Abstract
The effects of water and pesticide management practices on ponded water pesticide concentrations in a paddy plot were analysed using the RICEWQ model. The molinate which is a herbicide widely used in rice culture, and frequently detected in paddy environment was selected. In a previous study, the RICEWQ model was success- fully calibrated with field data obtained from a paddy plot in Daegu. The calibrated model was run using water and pesticide management scenarios with a set of measured meteorological data for 1997-2006 in Daegu.
For all three ponded water depths with the label rate application, the amount of molinate dissipated in ponded water and volatilized accounted for more than 70%, and the runoff losses were less than 9%. The molinate losses through drainage in the very shallow ponded depth showed 40% less than that in deep ponded depth. Comparing with the deep and shallow ponded depth, the very shallow depth was the best with regards to the reduction of molinate runoff losses. Simulations with different pesticide application rates, label rate and double label rate, showed molinate concentrations in the ponded water increased linearly with the application rate increase.
Keywords : RICEWQ, Paddy, Pesticide, Molinate, Scenario analysis
I. Introduction*
Pesticide runoff from paddy fields to adjacent receiving water system is a major concern. In Korea, several researchers have monitored pesticides introduced into the aquatic ecosystems(Kim, et al., 1997 ; Lee, et al., 1995).
* Kyungpook National University, College of Agricultural Life Science
** Rural Research Institute
†Corresponding author. Tel.: +82-53-950-5734 Fax: +82-53-950-6752
E-mail address: [email protected]
Over the past few decades, studies have been conducted to investigate the fate and transport processes of pesticides in nature(Park, 2007).
The fate of a pesticide is influenced by the che- mical and physical properties of the pesticide, site characteristics such as soil, geology, vege- tation, climate and weather conditions, and the pesticide handling practices. Individual pesticide vary widely in its response to environmental processes. Each factor must be considered when determining the likelihood of pesticide movement and off-target effects. Many experimental studies
have provided basic data and made important steps towards understanding these processes ; however, these are often site-specific to some degree.
The mathematical model for pesticide fate and transport in rice paddies should evaluate dissi- pation in an aquatic system and predict the run- off losses of pesticides to receiving waters. In this study, the RICEWQ model was used. It was assessed by Christen et al.(2006), and was found to be the most suitable model for the assess- ment of the pesticide exposure risk to the sur- face waters neighbouring rice paddies(Karpouzas and Capri, 2004). The RICEWQ was calibrated in the accompanying paper with field experiment data in Daegu(Chung et al., 2007).
The main purpose of this study is to analyze the molinate concentrations in a paddy plot for different water and pesticide management, and to assess the potential of molinate contamina- tion of water resources in realistic local agricul- tural scenarios.
II. Materials and Methods
The RICEWQ was developed to evaluate the fate and transport of pesticides in rice paddies, while minimizing input requirements by Waterborne Environmental Inc. of USA in 1999 (Williams et al, 2004). The model was intended to simulate pesticide dissipation and runoff losses to receiving waters ; the RICEWQ 1.7.2, latest version, is used in this study. The detailed description of the RICEWQ can be found elsewhere(Williams et al. 2004 ; Chung et al. 2005 ; Christen et al. 2006 ; and Park 2007).
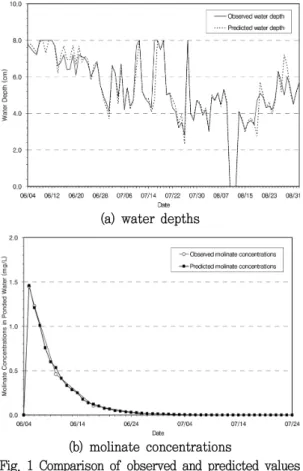
In a previous study, the RICEWQ model was successfully calibrated using field data obtained in Daegu in 2006 rice growing season(Fig. 1).
The calibrated model showed RMSE of 0.537 cm for ponded water depth and RMSE of 0.036 mg/L for the molinate concentrations in the ponded water(Table 1) (Chung et al., 2007).
In this study, a scenario-based pesticide simu- lation was performed and the results were
(a) water depths
(b) molinate concentrations
Fig. 1 Comparison of observed and predicted values in 2006
Table 1 Statistical analysis of the efficiency of the RICEWQ model
Statistical indicators Water balance Mass balance Root mean square error 0.537 cm 0.036 mg/L
Modeling efficiency※ 0.909 0.996 Nash-Sutcliffe coefficient※ 0.909 0.996 Coefficient of residual mass※ -0.001 0.026
Reduced error estimate 0.301 cm 0.061 mg/L
※ Units are dimensionless
Table 3 Meteorological data from 4 June to 2 September for 1997-2006 used for the simulation Year Total Precipitation
(mm)
Average R.H.
(%)
Total Sunshine hour (hour)
Average Temperature (℃)
Average Wind speed (m/s)
Total ETa (mm)
1997 737.9 66.4 690.7 24.4 1.8 388.8
1998 702.3 71.2 517.6 23.8 2.6 355.5
1999 567.0 73.0 571.9 24.2 2.6 389.6
2000 613.0 71.3 636.8 24.5 1.9 393.3
2001 477.4 68.0 739.8 25.2 1.8 409.6
2002 873.5 69.1 641.3 23.8 2.5 379.5
2003 913.2 74.1 486.7 23.0 2.2 315.0
2004 806.8 68.1 617.3 24.4 2.3 405.6
2005 555.8 69.2 609.1 25.1 2.3 401.1
2006 759.7 68.9 637.8 24.1 2.3 390.0
Mean 700.7 69.9 612.36 24.27 2.22 382.7
analyzed to understand the potential effect of the predicted molinate concentrations with different ponding depths and pesticide management prac- tices. Concerning pesticide application, Lee et al.(1998) reported that approximately 56% of farmers followed the recommended dosage on the label, and the rest 42% applied more than the recommended dosage. Granular molinate was mainly spread by hand(62%), while some farmers used a high-pressure sprayer(more than 25%).
The registered label for the molinate is 1.5 kg/
ha(active ingredient). However, farmers tend to use excessive amounts of pesticides whether the crop is growing well or not. If this being the case, the possibility of causing a harmful effect in non-target organisms occurs. Molinate drift losses in using the power granule sprayer resulted in the direct introduction of molinate to adjacent water bodies.
Table 2 shows the scenarios developed in this study. The calibrated model was run for the scenarios with a set of measured meteoro- logical data for 1997-2006 growing season(Table 3) using the same parameter values as those used for the model calibration.
Table 2 Water and pesticide management scenarios used in this study
Scenario Ponded
Water Management
Water depths (cm)
Application Rate
Application methods
Application Efficiency
(%)
A deep 6 - 10
label rate manual 100 B shallow 4 - 8
C very shallow 2 - 6
D deep 6 - 10
double
label rate manual 100 E shallow 4 - 8
F very shallow 2 - 6
G deep 6 - 10
label rate power granule sprayer
95 H shallow 4 - 8
I very shallow 2 - 6
III. Results and Discussion
1. Water management scenarios
The results of predicted water and molinate mass balance under the different ponded condi- tions were analysed. Table 4 shows the com- parison of 10-year average water balance with respect to the ponded depth. The very shallow ponded depth used 5% less irrigation water than the deep ponded depth. However, the drainage for the very shallow ponded depth was only 1%
less than the deep ponded depth.
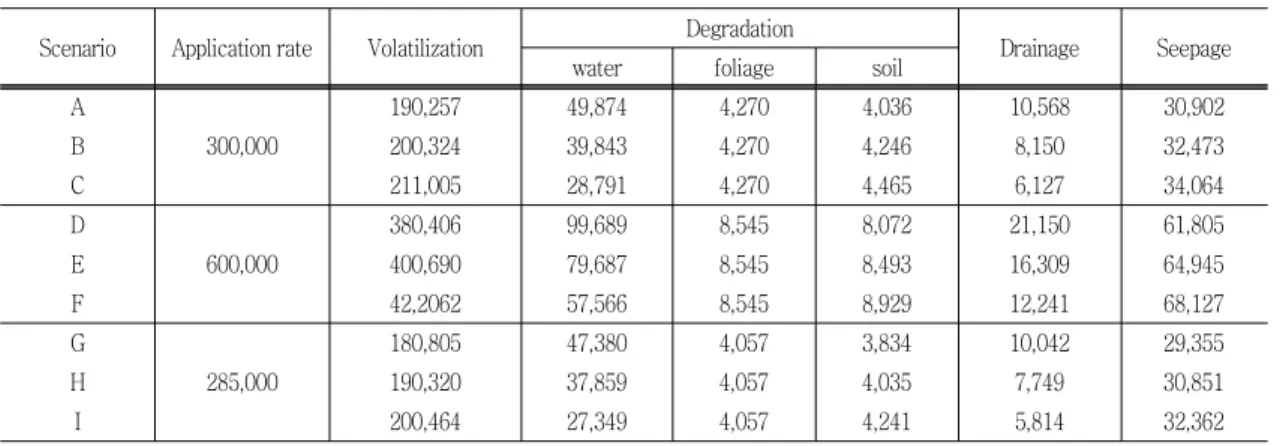
Table 5 Comparison of 10-year average molinate dissipation amount with respect to scenarios (unit : mg/0.2 ha)
Scenario Application rate Volatilization Degradation
Drainage Seepage
water foliage soil
A 190,257 49,874 4,270 4,036 10,568 30,902
B 300,000 200,324 39,843 4,270 4,246 8,150 32,473
C 211,005 28,791 4,270 4,465 6,127 34,064
D 380,406 99,689 8,545 8,072 21,150 61,805
E 600,000 400,690 79,687 8,545 8,493 16,309 64,945
F 42,2062 57,566 8,545 8,929 12,241 68,127
G 180,805 47,380 4,057 3,834 10,042 29,355
H 285,000 190,320 37,859 4,057 4,035 7,749 30,851
I 200,464 27,349 4,057 4,241 5,814 32,362
Table 4 Comparison of 10-year average water balance with respect to the ponded depth
(unit : mm) Scenario
Input Output
Rainfall Irrigation ET Drainage Seepage Storage change A
700.7
258.1 382.7 415.9 163.8 -10.6
B 250.1 382.7 414.1 163.8 -10.0
C 246.1 382.7 411.9 163.8 -11.7
Table 5 shows the 10-year average molinate dissipation amount along the different pathways with respect to scenarios. For all cases, the amount of molinate dissipated in ponded water and volatilized accounted for more than 70%, and runoff losses were less than 9%. Molinate losses through seepage were much larger than those through drainage. The molinate losses through drainage in the very shallow ponded depth(scenarios C, F, I) showed 40% less than that in deep ponded depth(scenarios A, D, G).
Comparing with the deep and shallow ponded depth, the very shallow depth was the best with regards to the reduction of molinate runoff losses.
The predicted average molinate concentrations in ponded water for scenarios A, B, C are shown in Fig. 2. The predicted maximum molinate con-
centrations reached one day after treatment(DAT) for all conditions. Then the concentration de- creased rapidly until about 5 DAT ; thereafter the molinate dissipation rate became slower.
A pesticide that has vaporized(evaporated) can be carried from the treated area by air currents.
The movement of pesticide vapors in the atmo- sphere is called volatilization. Volatilization, unlike spray or dust drift, has a close relation to the ponded depth in a paddy plot. On 5 DAT, the molinate dissipation rate in the very shallow ponded depth showed a greater increase than both deep and shallow ponded depth and then the molinate concentrations in the very shallow ponded depth showed the lowest ; this was due to higher volatilization and evapotranspiration.
In the deep ponded depth scenario, the half- life and 90% reduction date of molinate were 3.7 DAT and 11.8 DAT, respectively. In the shallow ponded depth scenario, the half-life and 90% reduction date of molinate was 3.0 DAT and 9.6 DAT, respectively. The very shallow ponded depth scenario showed a shorter half- life(2.2 DAT) and 90% reduction date(6.3 DAT) than the deep and shallow ponded depth sce- narios.
Fig. 2 Simulated ten-year average molinate con- centrations in ponded water for different ponding depths(scenarios A, B, C)
2. Pesticide treatment amount scenarios The predicted molinate mass balance in ponded water treated with double label rate under the different ponded conditions(scenarios D, E, F) were analysed. For all cases, the amount of molinate dissipated in ponded water and vola- tilized accounted for more than 80%, and runoff losses were less than 9%. In these scenarios, molinate losses were approximately twice those in scenarios A, B and C, the registered label dose.
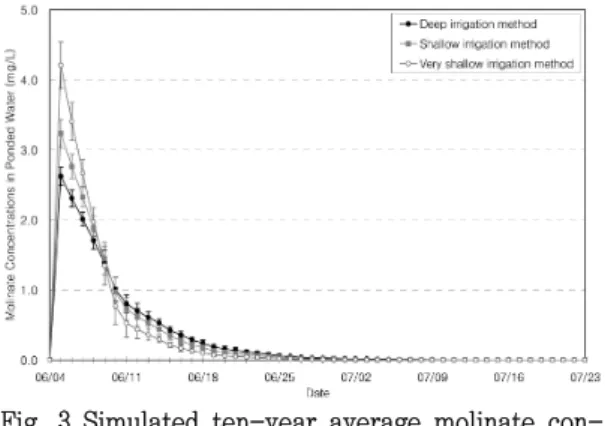
Fig. 3 shows the predicted molinate concen- trations in ponded water treated with double label rate for the different ponding depths. Although the amount of pesticide applied was different, the periods for reaching half-life and 90% reduc- tion of molinate concentrations in ponded water were similar, and the maximum concentrations for the double label rate were about double the concentrations of the label rate.
3. Pesticide treatment method scenarios The power granule spray scenarios G, H, and I had a 95% application efficiency compared to a 100% for the other scenarios. For all cases, the amount of molinate dissipated in ponded water and volatilized accounted for more than 70%,
Fig. 3 Simulated ten-year average molinate con- centrations in ponded water for different ponding depths with double label rate(sce- narios D, E, F)
and runoff losses were less than 9%. Compared with scenarios A, B and C, volatilization and degradation losses in scenarios G, H and I decreased by about 5%, respectively which is very reasonable considering application efficiency.
Fig. 4 shows the predicted molinate concentra- tions in ponded water treated with the label rate by power granule sprayer using the different ponding depths. As in scenarios A, B and C, the maximum concentration of molinate in ponded water appeared on one DAT, and was about 0.06 mg/L lower than that using manual spray.
Fig. 4 Simulated ten-year average molinate con- centrations in ponded water for different water depths using power granule sprayer (scenarios G, H, I)
IV. Conclusions
In this study, the RICEWQ model was used to predict molinate concentrations for various water and pesticide management scenarios in a paddy plot. Results obtained from this study are summarized as follows :
1. The comparison of the 10-year average water balance with respect to the ponded depth showed that the very shallow ponded depth used 5%
less irrigation water than the deep ponded depth.
However, the drainage for the very shallow ponded depth was only 1% less than the deep ponded depth.
2. The 10-year average molinate dissipation amount along the different pathways with respect to scenarios showed that the amount of moli- nate dissipated in ponded water and volatilized accounted for more than 70%, and runoff losses less than 9%. Molinate losses through seepage were much larger than those through drainage.
The molinate losses through drainage in the very shallow ponded depth showed 40% less than that in deep ponded depth. Comparing with the deep and shallow ponded depth, the very shallow ponded depth was best with regards to the reduction of molinate runoff losses. Simulations with different pesticide application rates, label rate and double label rate, showed molinate concentrations in the ponded water increased linearly with the application rate increase. Further study warrants for the establishment of the pes- ticide management standards and best manage- ment practices.
In general, the RICEWQ model can be success- fully used for the simulation of the pesticide fate and transport in rice paddy, and hence, it can be used for the establishment of the pes-
ticide management standards and best manage- ment practices in the future.
This work was supported by the Korea Re- search Foundation Grant funded by the Korean Government(MOEHRD-2005-D00093).
References
1. Christen, E. W., Chung, S. O. and Quayle, W., 2006. Simulating the fate of molinate in rice paddies using the RICEWQ Model, Agricul- tural Water Management, 85:38-46.
2. Chung, S. O., Park, K. J., Christen, E. 2005.
Estimation of pesticide fate in a paddy field using RICEWQ model. KCID J. 12(1):38-49.
3. Chung, S. O., Park, K. J., Son, S. H., 2008.
Calibration and sensitivity analysis of the RICEWQ model. Journal of the Korean Society of Agricultural Engineers. (In review)
4. Karpouzas, D. G. and Capri, E., 2004. Higher Tier Risk Assessment for Pesticides Applied in Rice Paddies : Filling the Gap at European Level. Outlooks on Pest Management - Fe- bruary 2004, pp.36-41.
5. Kim, K., Kim, J. H. and Park, C. K., 1997.
Pesticide Runoff from Soil Surface by Rainfall, Korean Journal of Environmental Agriculture 16(3): 274-284.
6. Lee, I. Y., Park, J. E., Park, T. S., Kim, T. W.
and Oh, B. Y., 1998. Fact-finding Survey on Herbicide Use in Paddy Rice at Farmer's Level, The Korean Journal of Pesticide Science, 2(2):
19-125. (in Korean)
7. Lee, S.R., Kim, Y.H. and Lee, M.G., 1995.
Information Resources for the Establishment of Tolerances on Pesticide Residues in Water Quality, Korean Journal of Environmental Agri- culture 14(3): 351-373.