¶ Corresponding Author: JiHye Jung, Dept. of Hospitality Management, Hanyang University, Seoul 130-701, Korea, Tel. +82-10- 5011-5799, Fax. +82-2-796-9488, E-mail: [email protected]
Culinary Science & Hospitality Research. 2016;22(1):19-31.
https://cshr.jams.or.kr/ ISSN 2466‐0752 (Print) ISSN 2466‐1023 (Online)
The Influence of NCS (National Competency Standard) Food and Beverage Practice Class using the SCAMPER Method on Learning Motivation: Subject to Specialized High Schools
Sangmin Jeong
1, Jinuk Moon
1, Heon Su Ha
2and Jihye Jung
1¶1
Dept. of Hospitality Management, Hanyang University
2
Dept. of Foodservice Management, Gyungjoo University
ABSTRACT: In this study, the SCAMPER method which is a creative thinking method is applied in the food and beverage class of a specialized high school NCS study module to enhance creative thinking and investigate the influence on learning motivation of students. For verification, 10 sessions of 50 mi- nutes classes were performed on 1, 2 grade students in H high school located in Gyeonggi-do Yangju City from August to November 2015 subject to 54 subjects in the experiment group and 54 subject in the control group. To look into the influence of the NCS food and beverage practice class using the SCAMPER method on learning motivation, pre ․ post survey investigation was conducted on the students for measurements through surveys to deduct conclusions. As a result, it was verified that the NCS food and beverage practice class using the SCAMPER method had positive influence on the learning motivation of specialized high school students and positive change was also found in the awareness of SCAMPER method using classes and creative activities in the students. In this study, the influence of the NCS food and beverage practice class using the SCAMPER method on learning motivation subject to specialized high school students is investigated to have meaning as data to expand the research range of NCS food and beverage practice education.
Keywords: NCS, SCAMPER method, specialized high school, learning motivation
INTRODUCTION
In accordance with the industrial structure of the 21
stcentury industry and labor market that is quickly changing, vocational education is demanding train- ing of professional manpower with existing theories and practical skills from practice based classes[19].
For this, the National Competency Standards (NCS) development is connecting education(training) and qualification systems with industrial fields not only for development of personal career, but also for de-
velopment of human resources in national aspect [16]. Also, the job competency that is wanted in in- dustrial fields is becoming diversified and profe- ssionalized that the demand on professional man- power is continuously increasing[15].
For this, the 18
thCommission on Presidential Tran-
sition announced the ‘competency based society im-
plementation’ as the 2013 major government pro-
ject to train young talents who will lead the future
competitiveness and promote vocational competen-
cy development[1]. This shows that social composi-
tion of ability and competency being respected rath- er than specifications is nationally required due to the development of national competency standard to make a competency based society in the acade- mic based society. Employment focused high school (specialized high school, meister high school) voca- tional education systems are strengthened to pro- vide opportunities of vocational education based on various careers in school education aspect to esta- blish a system of career development and degree achievement of high school graduate employees[1].
However, the current education route has strong tendency of students entering regular high school education in which the ratio of students entering specialized high schools after middle school gradua- tion is continuously reducing since 2010 with 68.3
% in 2010, 61.0% in 2011, and 50% in 2012. The larger problem is that the purpose of vocational edu- cation organizations is not being fulfilled in which the ratio of specialized high school graduates enter- ing university is beyond the half of 63.7% in 2011[2].
Diversification of vocational competency in industrial fields, creative ability and attitude are emphasized as the causes of this issue, but the purpose of speci- alized high schools is focused on curriculum for sim- ple technician training in which brave and free thinking is troubled that learning motivation of crea- tive self-expression is hard to be expected[17].
The government has decided to introduce the 2001 National Competency Standards(NCS hereafter) to increase the relationship between vocational edu- cation organizations and industrial field[3].
National Competency Standards(NCS) is a systemi- zation of competencies(knowledge, technique, atti- tude) required for successful work in industrial fields by industrial parts and levels determined by the na- tion in which there are 24 large classifications, 77 medium classifications, 227 small classifications, 857 subdivided classifications, and 2415 competency gr- oups with a level system of level 1~level 8[3]. Also, the government is planning to establish a ‘cooper- ative development system’ with businesses, qualifi- cation experts, and educators as developers in the NCS development process to operate the NCS curri- culum and connect development processes and re- vise learning module development qualifications sys- tems[18]. If the NCS learning module is used as
teaching and curriculum material in educational tra- ining organizations such as meister high schools or specialized high schools, the existing sample techni- cian training of theory and practice focused features can change into field oriented features[4].
The rising issue in NCS today is the nation led business, but the situation of having to rapidly revo- lutionize the whole educational curriculum can also be pointed out. As policies change too rapidly, vari- ous issues are appearing in education fields. Also, there is competency based knowledge, but there is also a port of allowing various thinking by opening creativity through theories that all knowledge edu- cation cannot focus only on practical competency in fields[29]. The NCS has developed a learning module focused on vocational competency in which learning motivation which is important in educational curri- culums is difficult to appear. According to previous researches to induce this learning motivation, the SCAMPER method showed significant influence on inducing learning motivation[17].
In this research, the SCAMPER method which is a creative thinking method is applied in a food and beverage class of the specialized high school NCS learning module to enhance creative thinking and investigate the influence on the learning motivation of students. For this, 7 checklists of the SCAMPER method was used to write a food and beverage guideline for 10 sessions. Using the SCAMPER me- thod, it is aimed to verify the influence on the learn- ing motivation of before-after students and provide implications to improve the specialized high school NCS curriculum.
LITERATURE REVIEW
Specialized High School National Competency Standards
NCS means ‘standardization of competency re-
quired to successfully perform work by individuals
through scientific and systematic deduction in na-
tional perspective.’ Based on this definition, it is
composed of standards that can judge and evaluate
standardized competency and achievement that are
essentially demanded from individuals. Thus, orga-
nized contents are included to evaluate standar-
dized knowledge, techniques, and attitudes that are
required for duty performance. Also, NCS must in- clude all abilities to successfully perform duties that are required in relevant jobs that not only knowl- edge, techniques, and attitudes that are required by individuals, but also application of these abilities must take place to be suggested as duty perform- ance that can be applied in new environments[16].
It is defined in the reform specialized high school curriculum as “high schools performing education in specialized fields such as tourism high schools, de- sign high schools, and information high schools sub- ject to students who receive early job preparation education in relevant industrial fields by deciding their career with talent and aptitude in specialized fields.” Also, it is defined as “high schools that pro- fessionally perform experience focused education with purpose of talent training in particular fields”
in which vocational high schools, and art ․ music ․ physical high schools are all included[30]. Therefore, specialized high schools are vocational education or- ganizations that perform liberal vocational education and professional education in specialized field con- nected with specific industries subject to students who have decided their career in early stages with talent, aptitude, and interest in specialized fields[21].
It is necessary for the characteristics and features of specialized high school curriculums to be newly used in accordance with NCS. The current industry is desiring talents who can actively adapt to the change of field duty due to the active convergence between industries in which the curriculum must be changed into a convergent form and solutions must be suggested to revise courses and departments, strengthen basic vocational abilities, and improve teaching-learning methods to solve these issues.
Students who have somewhat low basic mathemat- ical skills especially have difficulty in enhancing their skills after entering specialized high school in which plans to promotion of colleges and construction of post-entering systems are required. For the NCS ba- sed curriculum customized to the industrial demand in specialized high schools, it is necessary to seri- ously review the basic learning skill issues of stu- dents who enter specialized high schools. The speci- alized high school NCS based vocational curriculum can suggest plans that follow the NCS large classi-
fication system[22].
Scamper Method
There are various types of problems that must be solved by using creativity. Rather than vaguely thin- king about how to solve these problems, writing down all details that comes up and comparing each detail allows an individual to prevent omitting im- portant details[5]. The checklist method is a method for this demand in which all questions are set and ideas are made by checking each item[23]. The SC- AMPER method is the most representative checklist method which B. Eberle supplemented and recom- posed the model made by A. Osborn to create ideas.
SCAMPER is an abbreviation of 7 thinking processes in which it starts from a particular subject or pro- blem as it changes depending on the question and it helps create various ideas[6].
This SCAMPER method helps everyday life and makes each content to be easily memorized in whi- ch it is commonly used to develop creativity. B.
Eberle elaborately explained the SCAMPER idea th- rough his book to mention that enhancement of per- sonality and competency for creativity is recom- mended[7].
For food and beverage class using the SCAMPER method, the characteristics of the 7 factors of SC- AMPER must accurately understood. The following table is a summary of the contents of B. Eberle’s SCAMPER[8].
Learning Motivation
Learning motivation is intrinsic ․ psychological en- ergy that helps achieve a goal in internal condition to vitalize and maintain goal behavior[9]. Learning is acquiring new behavior and learning motivation when changing from existing behavior is the driving force to start new learning in which it is about con- trol and adjustment of behavior that was previously learned[10].
Therefore, learning motivation is the subordinate
concept of motivation as a direction and intensity
of effort that is used to fulfill a specific goal related
to learning[11] in which preparation or attitude of
learning in a specific situation or condition, thus
learning attitude and will of continuing learning that
has already started are also included[12].
Checklist Question form Activity content
S Substitute What can it be substituted to? Plan to substitute into something else C Combine What can it be combined with? Plan to combine or mix A Adapt Can ideas be adapted from somewhere else? Plan to mimic or borrow
M
Modify What happens if it is modified? Plan to give change by modification Magnify What happens if it is magnified? Plan for change by magnification
Minify What happens if it is minified? Plan for change by minification
P Put to
other uses Can it be put to other uses? Plan to use as other method or use E Eliminate What happens if it is eliminated? Plan for new idea by elimination
R Reverse
How can it be rearranged? Plan for new plan by changing composition What happens if it is reversed? Plan for new plan by reversing Table 1. B. Eberle’s SCAMPER checklist
The factors of learning motivation are not fixed and may frequently change depending on several relations that the understanding of systems sur- rounding the learner’s attention is asserted as a method that can improve learning motivation. Also, learning motivation is shown as the duration moti- vation of desire to continue learning after the learn- er has completed learning, participation motivation related to initial sense of purpose, and motivation to continue that activity[13]. Learning motivation is the influence on direction, intensity, and duration of activity in which it means the triggering of activity tendency that brings one or more effects[28].
By analysis on the learning motivation of learners and the class environment considering attention, re- lativity, confidence, and satisfaction aspects which are suiting motivation strategies, the cognitive effort level, subject related interest, and following acade- mic achievement of the learners increased[31].
Through diagnosis and prescription of attention concentration, relativity, confidence, and satisfaction of motivation, the learners did not drop out from class or conduct decision making with laziness in which it helped them to continuously study[32].
Based on the research above, learning motivation was summarized into 5 properties in which a ques- tionnaire was composed with 2 items each for mea- surement.
METHOD
In this research, the influence of NCS food and beverage practice class using SCAMPER on the learn- ing motivation of specialized high school students is to be investigated. 1, 2 grade students as H high school located in Yangju City were the subjects of this study with 54 subjects for the test group and 54 subjects for the control group. The research was conducted from August to November 2015 through 10 sessions of 50 minute classes. To investigate the influence of NCS food and beverage practice class using SCAMPER on learning motivation, pre ․ post survey investigation was performed on the students and SPSS statistical program was used to deduct conclusions. For the learning motivation measuring tool, learning motivation test items by Baek Yun Gyung[27] were referred to in which the researcher recomposed them fitting the purpose of this re- search. To confirm validity, the items were compo- sed of 5 assessment factors after review with a high school food and beverage teacher with a 10 year education career, food and beverage expert with a 10 year field career, and the researcher. The assess- ment factors were ‘attention,’ ‘relativity,’ ‘confiden- ce,’ satisfaction, ‘ and ’duration of ‘motivation.’ A to- tal of 10 items with 2 of each factor were included and the 5 point Likert scale was used for the assess- ment standard for measurement.
Regarding the data analysis method, data coding
Classification Group Number of
cases(N) Mean(M) Standard
deviation(SD) t-value p
Attention 1
Experimental group 54 3.15 .979
—
1.253 .213
Control group 54 3.39 1.017
Attention 2 Experimental group 54 3.24 .970
.406 .686
Control group 54 3.17 .927
Total Experimental group 54 3.19 .860
—
.500 .618
Control group 54 3.28 .872
Table 2 . Pre-homogeneity test on attention between the groups and data cleaning procedures were performed for
the statistical processing of the collected data and the SPSS (Statistical Package for Social Science) v.
18.0 statistics package programs was used for ana- lysis. Specifically, the following analysis was con- ducted.
First, independent sample t-test was performed to investigated the difference in pre-learning motiva- tion(attention, relativity, confidence, satisfaction, du- ration of motivation), between the groups.
Second, matching sample t-test was performed to investigate the pre-post change of learning motiva- tion(attention, relativity, confidence, satisfaction, du- ration of motivation) of each group.
RESULTS
In this study, the changes of learning motivation in the experimental group that received food and beverage practice classes using SCAMPER and the control group that received food and beverage prac- tice classes using NCS were comparatively analyzed.
Pre-homogeneity Test between the Groups
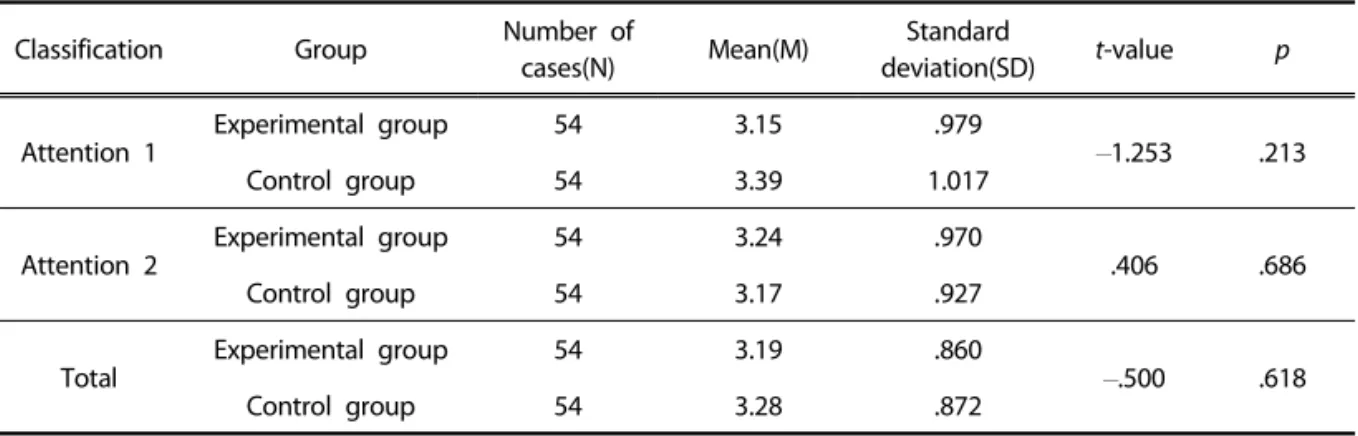
1) Pre-homogeneity Test on Attention between the Groups
Table 2 below shows the results of the indepen- dent sample t-test that was conducted to test pre- homogeneity on attention between the groups. As result of the analysis, it was shown that overall at- tention in the control group(M=3.28) was slightly higher than the experimental group(M=3.19), but
there was no statistically significant difference(t=
—0.500, p>.05). Also, there was no statistically sig- nificant difference between the groups for attention 1 and attention 1 which are subordinate factors (p>.05). It can be known that the experimental gr- oup and control group are homogeneous groups.
2) Pre-homogeneity Test on Relativity between the Groups
Table 3 below shows the results of the indepen- dent sample t-test that was conducted to test pre-homogeneity on relativity between the groups.
As result of the analysis, it was shown that overall relativity in the control group(M=3.33) was slightly higher than the experimental group(M=3.18), but there was no statistically significant difference(t=
—0.978, p>.05). Also, there was no statistically sig- nificant difference between the groups for relativity 1 and relativity 1 which are subordinate factors (p>.05). It can be known that the experimental gr- oup and control group are homogeneous groups.
3) Pre-homogeneity Test on Confidence between the Groups
Table 4 below shows the results of the in- dependent sample t-test that was conducted to test pre-homogeneity on confidence between the gr- oups. As result of the analysis, it was shown that overall confidence in the experimental group(M=
3.09) was slightly higher than the control group
(M=2.92), but there was no statistically significant
difference(t=0.949, p>.05). Also, there was no statisti-
cally significant difference between the groups for
Classification Group Number of
cases(N) Mean(M) Standard
deviation(SD) t-value p
Confidence 1
Experimental group 54 3.04 .971
.187 .852
Control group 54 3.00 1.082
Confidence 2
Experimental group 54 3.15 1.035
1.535 .128
Control group 54 2.83 1.095
Total
Experimental group 54 3.09 .906
.949 .345
Control group 54 2.92 1.018
Table 4. Pre- homogeneity test on confidence between the groups
Classification Group Number of
cases(N) Mean(M) Standard
deviation(SD) t-value p
Satisfaction 1
Experimental group 54 3.02 .942
—
.687 .493
Control group 54 3.15 1.017
Satisfaction 2
Experimental group 54 3.26 1.049
.666 .507
Control group 54 3.13 .972
Total
Experimental group 54 3.14 .892
.000 1.000
Control group 54 3.14 .876
Table 5. Pre-homogeneity test on satisfaction between the groups
Classification Group Number of
cases(N) Mean(M) Standard
deviation(SD) t-value p
Relativity 1 Experimental group 54 3.07 .949
—
1.810 .073
Control group 54 3.39 .856
Relativity 2 Experimental group 54 3.28 1.054
.000 1.000
Control group 54 3.28 .878
Total Experimental group 54 3.18 .902
—
.978 .330
Control group 54 3.33 .765
Table 3. P re-homogeneity test on relativity between the groups
confidence 1 and confidence 1 which are subordi- nate factors(p>.05). It can be known that the ex- perimental group and control group are homoge- neous groups.
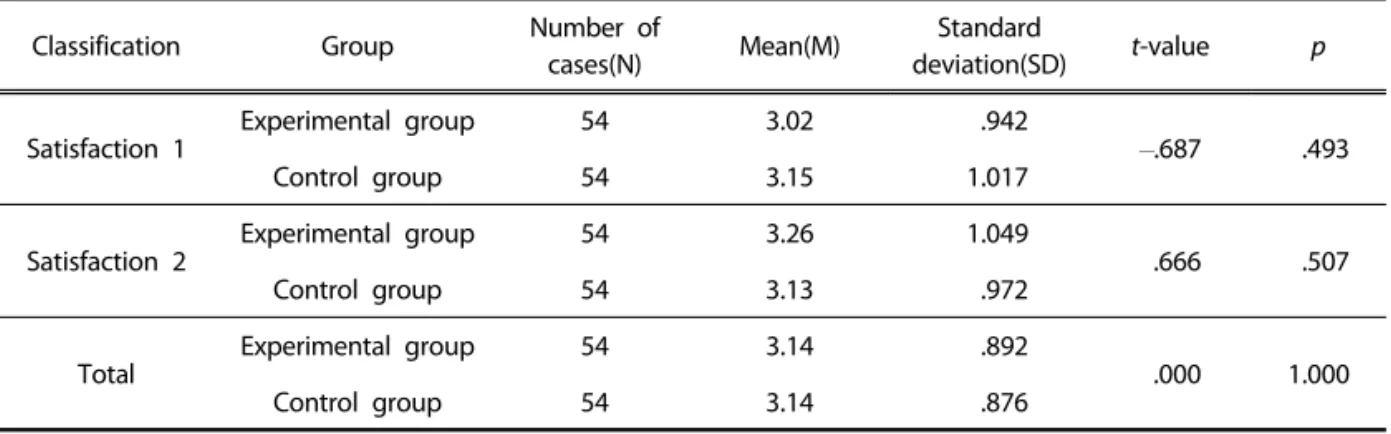
4) Pre-homogeneity Test on Satisfaction between the Groups
Table 5 below shows the results of the indepen-
dent sample t-test that was conducted to test pre-homogeneity on satisfaction between the gr- oups. As result of the analysis, it was shown that overall satisfaction in the experimental group(M=
3.14) was equivalent to the control group(M=3.14),
but there was no statistically significant difference
(t=0.000, p>.05). Also, there was no statistically signi-
ficant difference between the groups for satisfaction
Classification Group Number of
cases(N) Mean(M) Standard
deviation(SD) t-value p Duration of
motivation 1
Experimental group 54 3.20 .959
—
.516 .607
Control group 54 3.30 .903
Duration of motivation 2
Experimental group 54 3.30 1.021
.877 .382
Control group 54 3.13 .953
Total Experimental group 54 3.25 .894
.221 .825
Control group 54 3.21 .845
T able 6. Pre-homogeneity test on duration of motivation between the groups
1 and satisfaction 1 which are subordinate factors (p>.05). Thus, it can be known that the experimen- tal group and control group are homogeneous groups.
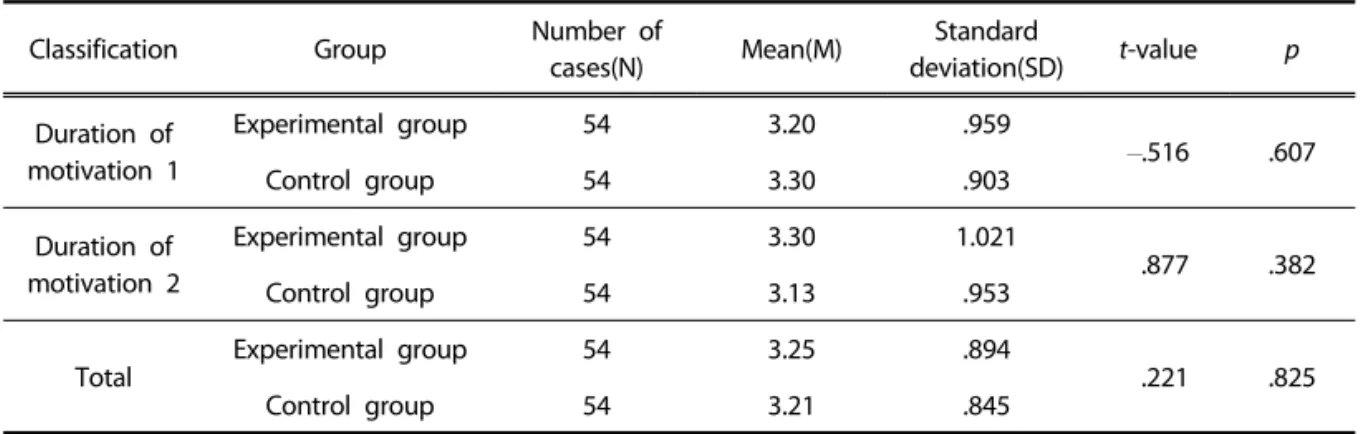
5) Pre-homogeneity Test on Duration of Moti- vation between the Groups
Table 6 below shows the results of the indepen- dent sample t-test that was conducted to test pre-homogeneity on duration of motivation be- tween the groups. As result of the analysis, it was shown that overall duration of motivation in the ex- perimental group(M=3.25) was slightly higher than the control group(M=3.21), but there was no statisti- cally significant difference(t=0.221, p>.05). Also, the- re was no statistically significant difference between the groups for duration of motivation 1 and dura- tion of motivation 1 which are subordinate factors (p>.05). It can be known that the experimental gr- oup and control group are homogeneous groups.
Pre-post Test on Learning Motivation
The following are results of the matching sample t-test that was conducted to investigate the pre-post change on the learning motivation in the experi- mental group that received food and beverage prac- tice classes using SCAMPER and the control group that received food and beverage practice classes us- ing NCS.
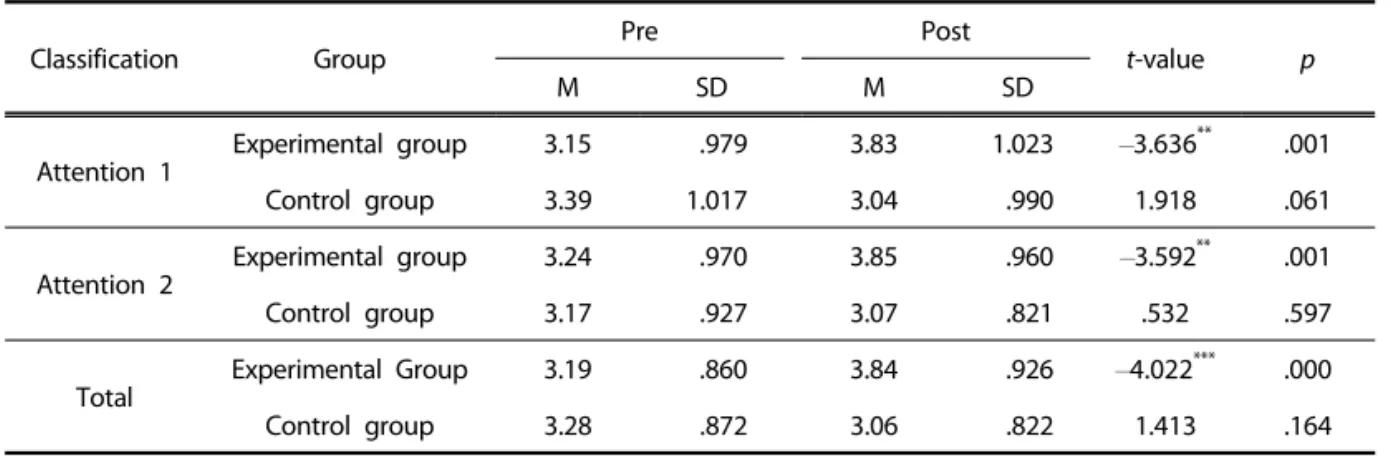
1) Pre-post Test on Attention by Groups
Table 7 below shows the results of the analysis on the pre-post changes on attention by groups.
Firstly regarding overall attention, pre-mean(M=3.28) decreased to post-mean(M=3.02) by 0.22 in the con-
trol group that received food and beverage practice classes using NCS, but there was no statistically sig- nificant difference(t=1.413, p>.05), and pre-mean (M
=3.19) increased to post-mean(M=3.84) by 0.65 in the experimental group that received food and be- verage practice classes using SCAMPER in which sta- tistically significant difference(t=
—4.022, p<.001) was shown.
For attention 1, pre-mean(M=3.39) decreased to post-mean(M=3.04) by 0.35 in the control group that received food and beverage practice classes using NCS, but there was no statistically significant differ- ence(t=1.918, p>.05), and pre-mean(M=3.15) increa- sed to post-mean(M=3.83) by 0.68 in the experi- mental group that received food and beverage prac- tice classes using SCAMPER in which statistically sig- nificant difference(t=
—3.636, p<.01) was shown.
For attention 2, pre-mean(M=3.17) decreased to post-mean(M=3.07) by 0.10 in the control group that received food and beverage practice classes using NCS, but there was no statistically significant differ- ence(t=0.532, p>.05), and pre-mean(M=3.24) increa- sed to post-mean(M=3.85) by 0.61 in the experi- mental group that received food and beverage prac- tice classes using SCAMPER in which statistically sig- nificant difference(t=
—3.592, p<.01) was shown.
Thus, considering the overall results, it can be known that the food and beverage practice classes using SCAMPER performed in this study had effect on improving attention of the students.
2) Pre-post Test on Relativity by Groups
Table 8 below shows the results of the analysis
Classification Group Pre Post
t-value p
M SD M SD
Attention 1 Experimental group 3.15 .979 3.83 1.023
—3.636
**.001
Control group 3.39 1.017 3.04 .990 1.918 .061
Attention 2 Experimental group 3.24 .970 3.85 .960
—3.592
**.001
Control group 3.17 .927 3.07 .821 .532 .597
Total
Experimental Group 3.19 .860 3.84 .926
—4.022
***.000
Control group 3.28 .872 3.06 .822 1.413 .164
**
p<. 01,
***p<. 001.
Table 7. Pre-post test on attention by groups
Classification Group
Pre Post
t-value p
M SD M SD
Relativity 1
Experimental group 3.07 .949 3.85 .899
—4.307
***.000
Control group 3.39 .856 3.04 .931 2.003 .051
Relativity 2
Experimental group 3.28 1.054 3.81 .913
—3.108
**.003
Control group 3.28 .878 2.98 .789 1.933 .059
Total
Experimental group 3.18 .902 3.83 .858
—3.997
***.000
Control group 3.33 .765 3.01 .774 2.228
*.030
*
p<. 05,
**p<. 01,
***p<. 001.
Table 8. Pre-post test on relativity by groups
on the pre-post changes on relativity by groups.
Firstly regarding overall relativity, pre-mean(M=3.33) decreased to post-mean(M=3.01) by 0.32 in the con- trol group that received food and beverage practice classes using NCS showing statistically significant dif- ference(t=2.228, p<.05), and pre-mean(M=3.18) in- creased to post-mean(M=3.83) by 0.65 in the ex- perimental group that received food and beverage practice classes using SCAMPER in which statistically significant difference(t=
—3.997, p<.001) was shown.
For relativity 1, pre-mean(M=3.39) decreased to post-mean(M=3.04) by 0.35 in the control group that received food and beverage practice classes using NCS, but there was no statistically significant differ- ence(t=2.003, p>.05), and pre-mean(M=3.07) increa- sed to post-mean(M=3.85) by 0.78 in the experi- mental group that received food and beverage prac-
tice classes using SCAMPER in which statistically sig- nificant difference(t=
—4.307, p<.001) was shown.
For relativity 2, pre-mean(M=3.28) decreased to post-mean(M=2.98) by 0.30 in the control group that received food and beverage practice classes using NCS, but there was no statistically significant differ- ence(t=1.933, p>.05), and pre-mean(M=3.28) increa- sed to post-mean(M=3.81) by 0.53 in the experi- mental group that received food and beverage prac- tice classes using SCAMPER in which statistically sig- nificant difference(t=
—3.108, p<.01) was shown.
Thus, considering the overall results, it can be known that the food and beverage practice classes using SCAMPER performed in this study had effect on improving relativity of the students.
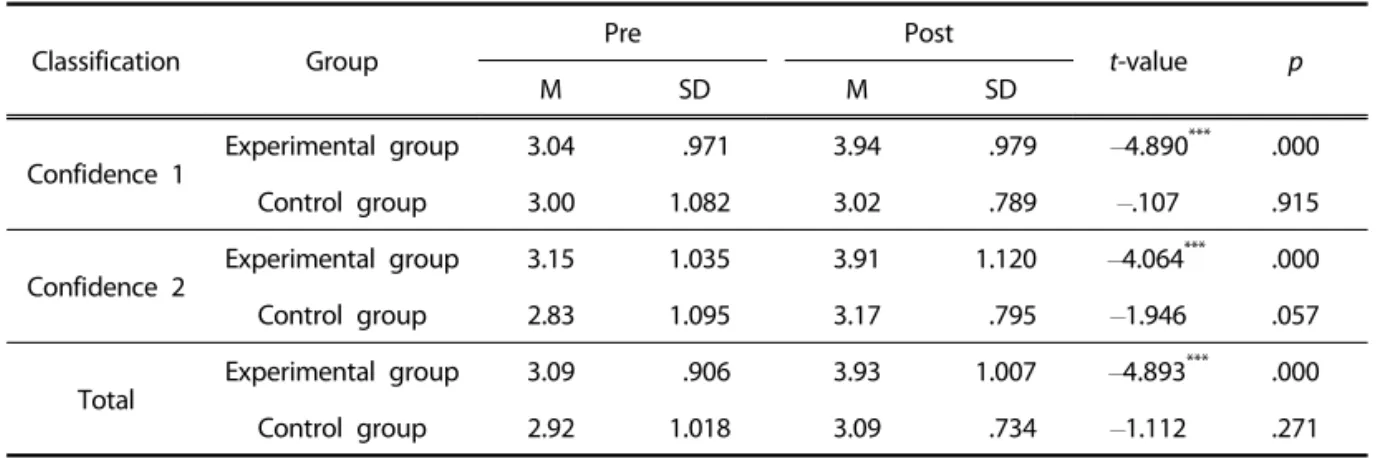
3) Pre-post Test on Confidence by Groups
Classification Group
Pre Post
t-value p
M SD M SD
Confidence 1
Experimental group 3.04 .971 3.94 .979
—4.890
***.000
Control group 3.00 1.082 3.02 .789
—.107 .915
Confidence 2
Experimental group 3.15 1.035 3.91 1.120
—4.064
***.000
Control group 2.83 1.095 3.17 .795
—1.946 .057
Total
Experimental group 3.09 .906 3.93 1.007
—4.893
***.000
Control group 2.92 1.018 3.09 .734
—1.112 .271
***
p<. 001.
Table 9. Pre-post test on confidence by groups
Table 9 below shows the results of the analysis on the pre-post changes on confidence by groups.
Firstly regarding overall confidence, pre-mean(M=
2.92) increased to post-mean(M=3.09) by 0.17 in the control group that received food and beverage prac- tice classes using NCS showing statistically sig- nificant difference(t=
—1.112, p>.05), and pre-mean (M=3.09) increased to post-mean(M=3.93) by 0.84 in the experimental group that received food and be- verage practice classes using SCAMPER in which statistically significant difference(t=
—4.893, p<.001) was shown.
For confidence 1, pre-mean(M=3.00) decreased to post-mean(M=3.02) by 0.02 in the control group that received food and beverage practice classes using NCS, but there was no statistically significant differ- ence(t=
—0.107, p>.05), and pre-mean (M=3.04) increa- sed to post-mean(M=3.94) by 0.90 in the experi- mental group that received food and beverage prac- tice classes using SCAMPER in which statistically sig- nificant difference(t=
—4.890, p<.001) was shown.
For confidence 2, pre-mean(M=2.83) increased to post-mean(M=3.17) by 0.34 in the control group that received food and beverage practice classes using NCS, but there was no statistically significant differ- ence(t=
—1.946, p>.05), and pre-mean (M=3.15) in- creased to post-mean(M=3.91) by 0.76 in the ex- perimental group that received food and beverage practice classes using SCAMPER in which statistically significant difference(t=
—4.064, p<.001) was shown.
Thus, considering the overall results, it can be known that the food and beverage practice classes
using SCAMPER performed in this study had effect on improving confidence of the students.
4) Pre-post Test on Satisfaction by Groups Table 10 below shows the results of the analysis on the pre-post changes on satisfaction by groups.
Firstly regarding overall satisfaction, pre-mean(M=
3.14) decreased to post-mean(M=3.03) by 0.11 in the control group that received food and beverage prac- tice classes using NCS showing statistically signi- ficant difference(t=0.788, p>.05), and pre-mean(M=
3.14) increased to post-mean(M=3.93) by 0.79 in the experimental group that received food and bever- age practice classes using SCAMPER in which statisti- cally significant difference(t=
—4.406, p<.001) was shown.
For satisfaction 1, pre-mean(M=3.15) decreased to post-mean(M=3.11) by 0.04 in the control group that received food and beverage practice classes using NCS, but there was no statistically significant di- fference(t=0.219, p>.05), and pre-mean(M=3.02) in- creased to post-mean(M=3.91) by 0.89 in the experi- mental group that received food and beverage prac- tice classes using SCAMPER in which statistically sig- nificant difference(t=
—4.724, p<.001) was shown.
For satisfaction 2, pre-mean(M=3.13) decreased to
post-mean(M=2.94) by 0.19 in the control group that
received food and beverage practice classes using
NCS, but there was no statistically significant differ-
ence(t=1.200, p>.05), and pre-mean(M=3.26) increa-
sed to post-mean(M=3.94) by 0.68 in the experi-
mental group that received food and beverage prac-
Classification Group Pre Post
t-value p
M SD M SD
Satisfaction 1
Experimental group 3.02 .942 3.91 1.086
—4.724
***.000
Control group 3.15 1.017 3.11 .883 .219 .828
Satisfaction 2
Experimental group 3.26 1.049 3.94 1.017
—3.600
**.001
Control group 3.13 .972 2.94 .834 1.200 .235
Total
Experimental group 3.14 .892 3.93 1.025
—4.406
***.000
Control group 3.14 .876 3.03 .786 .788 .434
**
p<. 01,
***p<. 001.
Table 10. Pre- post test on satisfaction by groups
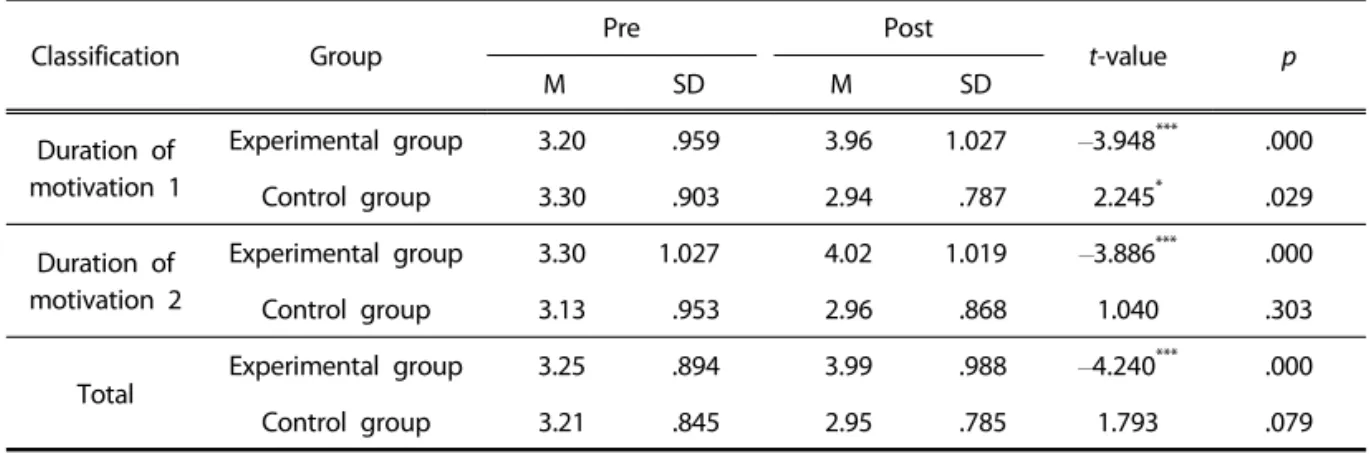
Classification Group Pre Post
t-value p
M SD M SD
Duration of motivation 1
Experimental group 3.20 .959 3.96 1.027
—3.948
***.000
Control group 3.30 .903 2.94 .787 2.245
*.029
Duration of motivation 2
Experimental group 3.30 1.027 4.02 1.019
—3.886
***.000
Control group 3.13 .953 2.96 .868 1.040 .303
Total Experimental group 3.25 .894 3.99 .988
—4.240
***.000
Control group 3.21 .845 2.95 .785 1.793 .079
*