실내 환경의 쾌적도 측정시스템 개발
Development of Comfort Sensing System for Human Environment
강정호*, 이재용**, 김우현***
Jeong-Ho Kang*, Jae-Yong Lee**, Woo-Hyun Kim***
<요 약>
본 연구는 웰빙 환경 조성에 적합한 습도센서, 온도센서와 기류센서를 이용한 쾌적도 측정시스템에 관한 것이다. 이 측정시스템이 나타내는 쾌적도는 기류와 온도에 민감하게
나타났다. 시스템을 위한 온도와 습도 일체형 센서와
기류센서를 설계 및 제작하고, 마이크로 컨트롤러에서 센서 신호를 측정하여 ISO7730에서 나타내는 예상온열 감지수 (PMV)와 쾌적감 지수(CSV)를 계산하고, 각각의 계산 값을 LCD에 표시하도록 하였다. 인위의 환경에서 실험한 결과, 본 시스템이 공기조화시스템, 자동차 기류조정시스템, 가정과 사무실 병원 등의 많은 분야에 적용이 될 수 있음을 알 수 있었다.
Keywords : 예상온열감지수, 쾌적감지수, 온열이론, 쾌적감, 생활환경
* 정회원, 다진시스템, 工博, 143-8 [email protected]
** 정회원, 영남이공대학, 교수
*** 정회원, 영남이공대학, 조교수
* Dajin system, Ph. D, Kyungpook National University 143-8, Hyeonggok-dong, Gumi, Gyeongbuk, 730-040, Korea
** Prof. Department of Robot Technology, Yeungnam College of Science & Technology.
1. Introduction
The thermal comfort that a human being feels in indoor environment has been known to be influenced mostly by six parameters, i.e. air temperature, radiation, air flow, humidity, activity level and clothing thermal resistance[1]. It was not until Fanger empirically established the well known PMV equation that the formulation of the parameters was successfully made. Fanger's PMV index basically quantifies the degree of discomfort and is expressed on such psycho physical scale as hot, warm, slightly warm, neutral, slightly cool, cool and cold. The most important requirement for an air conditioning system such as cooling and(or) heating apparatus is to create a comfortable human environment with high energy efficiency. With the rapid development of microprocessor technologies, bulk silicon
micromachining technologies and control tools such as fuzzy and neural network, there has been growing need for in situ monitoring of parameters necessary for the optimal control of air conditioning system.
The most important prerequisite for the commercial applications of the PMV scheme is to extract correct values of PMV index at low cost. Considering a thermal comfort, we have designed and fabricated a one bodied humidity/ temperature sensor and a flow sensor that detect air temperature, relative humidity and air flow in human environment using bulk and surface silicon micromachining technologies.
2. Design and fabrication
The design of sensors is based on a thermal comfort.
The controlling mechanism as a kind of heat exchanger helps the body core to maintain relatively
constant temperature in given thermal environment.
Heat is generated inside a human body and dissipates through various channels for the heat exchange between the body and thermal environment. To get values of PMV index in human environment, it is necessary to know air temperature, relative humidity and air flow. Therefore devices that each sensors for their values are designed and fabricated by bulk and surface silicon micromachining technologies[2]. In humidity sensor, after piezoresistors are diffused on silicon wafer, the diaphragm is formed by micromachining technology, then hygroscopic layer is coated with polyimide[3][4]. Each resistors are positioned at high sensitive region and the metal is deposited by evaporation. According to increase relative humidity in environment, hygroscopic layer is expanded. Because this layer is in contact with diaphragm, piezoresistors on diaphragm have increased value and is detected its relative humidity by electrical circuits such as driving and amplifier circuit. Fabrication processes are followed by standard cleaning, thermal oxidation, patterning of resistors, diffusion, Al evaporation, back side etching, dicing, wire bonding and packaging.
Also temperature sensor using temperature coefficient of diffused resistors has been constructed for testing and performance evaluation. Diffused resistors on silicon have temperature coefficient of resistance(TCR) and it was used as temperature sensor[5][6]. Temperature sensor and relative humidity sensor are in one bodied chip and have an driving circuit. The schematic diagram of the fabricated one bodied humidity/temperature sensor is given in figure 1.
Polyimide layer Piezoresistors Al
Silicon diaphragm
n-Si SiO22
Diffused resistor
Pyrex glass
Figure 1. The schematic diagram of the fabricated one bodied humidity/temperature sensor.
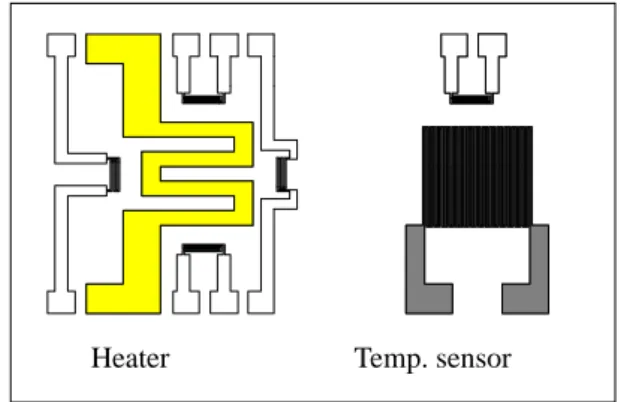
Flow sensor is made of Pt on ceramic plate. Pt is sputtered on ceramic plate. We design Pt patterns of 100Ωand 1㏀. Pt of 100Ω is used for heater and 1㏀
is used for detecting temperature of air flow in human environment. By constructing Wheaston bridge with other resistors, unbalanced output will be generated by air flow. A closed loop configuration, in which the temperature is kept constant by supply power and that
power is measured. And these loop control potentially offers higher response speeds[7]. The schematic diagram of the fabricated air flow sensor is given in figure 2. It is consisted of heater and temperature sensor, which is made of Pt on ceramic.
These fabricated sensors are packaged in probe with driving and amplifier circuit to detect temperature, relative humidity and air flow in human environment.
Microcontroller is used for measuring of output voltage of each sensor and calculates PMV index and displays the result of calculation of PMV on LCD.
Heater Temp. sensor
Figure 2. The schematic diagram of the fabricated air flow sensor.
Figure 3 shows a block diagram of the PMV indicator constructed using a one bodied humidity/temperature sensor and a flow sensor. The PMV indicator consists of; 1) a sensing unit with signal processing, 2) MPU(80C31 microcontroller) which calculates PMV index and controls the control unit, 3) a display part using LCD, and 4) keyboard. A PMV indicator has been fabricated using these sensors and MPU with PMV equation (1) in ISO7730[8], and experimental results with environment clearly suggest that our system can be used in many applications such as an air conditioning system, feedback controlling in automobile, home and hospital etc.
( ){( ) [ ( ) ]
( )
[ ] ( ) ( )
( ) ( )
[ ]
( )}PMV . e . M W . . M W P
. M W . . M Pa . M t
. f t t f h t t
. M
a
a
cl cl r cl c cl a
= ⋅ + − − × − − −
− − − − × ⋅ ⋅ − − ⋅ −
− × ⋅ ⋅ + − + − ⋅ ⋅ −
− −
−
−
0 303 0 028 3 05 10 5733 6 99
0 42 5815 17 10 5867 0 0014 34
3 96 10 273 273
0 36 3
5
8 4 4
Equation (1) where
( ) {
[
( ) ( )]
( )}tcl=35 7. −0 028. M−W−Icl⋅3 96. ×10−8⋅fcl tcl+2734−tr+2734 +fcl⋅h tc cl−ta
( ) ( ) ( )
h t t for t t V
V for t t V
c
cl a cl a ar
ar cl a ar
= − − ≥
− ≤
⎧
⎨⎪
⎩⎪
⎫
⎬⎪
⎭⎪
2 38 2 38 12 1
12 1 2 38 12 1
0 25 0 25
0 25
. . .
. . .
. .
.
f I for I m C W
I for I m C W
cl
cl cl
o
cl cl
= + ⋅ ≤ ⋅ ⋅o
+ ⋅ ≤ ⋅ ⋅
⎧⎨
⎪
⎩⎪
⎫⎬
⎪
⎭⎪
100 129 0 078
105 0 645 0 078
2 2
. . .
. . .
M : metabolic rate [met]=[58.2W/㎡]
W : external work [met]
Icl : thermal resistance of clothing [clo]=[0.155㎡℃/W]
fcl : ratio of man's surface area while clothed, to man's surface area while nude.
ta : air temperature [℃]
tr : mean radiant temperature [℃]
Var : relative air velocity [m/s]
Pa : partial water vapour pressure [Pa]
hc : convective heat transfer coefficient [W/㎡℃]
tcl : surface temperature of clothing [℃]
80C31 micro controller
Temperature
Humidity
Air flow
Key board
LCD
Control temperature
Control humidity Control air flow
Sensing unit Control unit
temperature, relative humidity, air flow PMV, CSV(comfort sensing vote)
Figure 3. A block diagram of the PMV indicator.
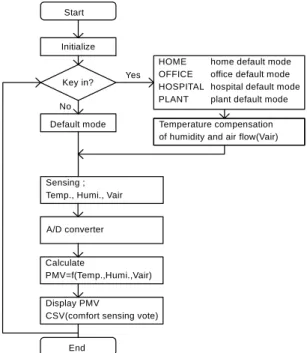
PMV indicator calculates PMV index using equation (1) and displays the result of PMV index in human environment on LCD. Figure 4 shows a flow chart of PMV indicator that 1)detect of temperature, humidity and air flow in human environment , 2)input parameters of metabolic, external work and clothing using keyboard, 3)calculate of PMV and 4)display on LCD. Initial step prepares internal user setting in special function register ,internal RAM and other devices.
According to key input, branch to modify of initial variable using key input and set default mode (home, office, hospital and plant). Values of default mode are based on mean values of each place. After mode selection, temperature, relative humidity and air flow
in human environment are detected from sensors.
Temperature compensation of detected values is complished in software and calculated to PMV and displayed on LCD device. Execution is returned to key input routine and repeat those routine.
Start
Key in?
Default mode
HOME OFFICE HOSPITAL PLANT
home default mode office default mode hospital default mode plant default mode
Temperature compensation of humidity and air flow(Vair)
Calculate
PMV=f(Temp.,Humi.,Vair)
Display PMV
CSV(comfort sensing vote)
End
Yes
No Initialize
Sensing ; Temp., Humi., Vair
A/D converter
Figure 4. Flow chart of PMV indicator.
3. Results and discussion
In order to construct a PMV indicator using fabricated sensors, it was necessary to investigate the characteristics of these sensors in response to temperature, humidity and air flow among other things.
Figure 5 is the bridge output voltage variation of humidity sensor. As shown in figure 5, sensitivity is 581.1㎶/%R.H., hysteresis is 1.67%FS, nonlinearity is 6.69%FS and response time is 150 ∼ 220 seconds.
TCO(temperature coefficient of offset) of humidity sensor is ±2%R.H./℃ in the temperature range of 5 to 45℃, and long term stability during 50days is within
±5.46%R.H.. Output voltage variation of temperature sensor is given in figure 6. In temperature sensor, sensitivity is 556㎶/℃ in the temperature range of
21.8 to 45.8℃.
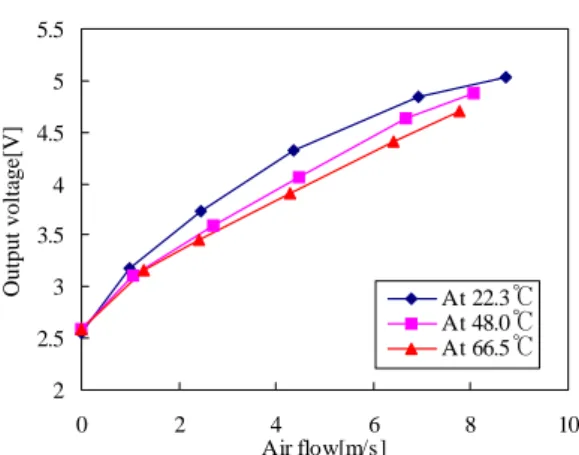
Figure 7 is the output voltage variation of the air flow sensor with air flow and temperature. The output voltage of bridge is decreased according to temperature, thus the conpensation of temperature is executed in software with temperature coefficient of voltage output.
100 110 120 130 140 150 160
0 20 40 60 80 100
Relative humidity[%R.H.]
Output voltage[]㎷
desorption
adsorption
Figure 5. The bridge output voltage variation of the humidity sensor with relative humidity.
We designed and made a PMV indicator using fabricated sensors. Figure 8 describes the PMV and CSV index changing aspects of physical factors such as temperature range of 20 to 30℃, humidity of about 65%R.H. and flow of 0.1m/s. Above healthy hundred men exposed to moderate thermal environment, and PMV and CSV of the fabricated-
-30 -25 -20 -15 -10 -5 0 5 10
-40 -20 0 20 40 60
Temperature[℃]
Output voltage[]㎷
Sensitivity : 556㎶ ℃/
Figure 6. The output voltage variation of the temperature sensor.
PMV indicator and PMV and CSV of a human being were recorded at the same time according to the variation of temperature.
It is clear from the figure 8 that the output values from PMV indicator are in a good agreement with PMV and CSV of a human being in korea. Because PMV indicator is constructed for human being, not korean. It is necessary that PMV indicator is modified for korean’s comfort using korean’s comfort database.
2 2.5 3 3.5 4 4.5 5 5.5
0 2 4 6 8 10
Air flow[m/s]
Output voltage[V]
At 22.3℃ At 48.0℃ At 66.5℃
Figure 7. The output voltage variation of air flow sensor with air flow and temperature.
50 55 60 65 70 75 80 85 90 95 100
19 24 29
Temperature[℃]
CSV
-3 -2 -1 0 1 2 3
PMV
CSV of a human being CSV of a fabricated indicator PMV of a human being PMV of a fabricated indicator
Figure 8. The PMV index changing aspects of physical factors.
4. Conclusions
Our work has demonstrated that a microsensor based PMV indicator can provide an effective means of measuring the comfort sensing of a human being.
Experimental results in simulated environment clearly suggest that our sensing system can be utilized in air conditioning system as a practical means of monitoring PMV indices and feedback controlling in automobile, home, office, hotel and hospital etc. Also base on comfort database of special environment in local region, modified PMV indicator can be utilized in air conditioning system.
References
1) Jong Uk Bu, Tae Yoon Kim, Young Sam Jun, Young Cho Shim and Sung Tae Kim : Silicon Based Thermal Comfort Sensing Device, TRANSDUCERS '95, EUROSENSORS IX, pp104∼107, (1995)
2) Jeongho Kang, Jinsu Park, Suhwan Mun and Sekwang Park : One-bodied humidity and temperature sensor having advanced linearity at low and high relative humidity range, Sensors and Actuators B, 76/1-3, pp.322∼326, (2001) 3) G. Gerlach and K. Sager : A piezoresistive
humidity sensor, Sensors and Actuators A, pp 181∼184, (1994)
4) Sekwang Park, Sungjune Park and Jeongho Kang : Poly Si Humidity Sensor Using BTDA MDA Polyimide, EACCS’95, CHEMICAL SENSOR, pp 217∼220, (1995)
5) F. Völklein and H. Baltes : Thermoelectric Properties of Polysilicon Films Doped with Phosporus and Boron, Sensors and Materials, VOL. 3, NO. 6, pp 325∼334, (1992)
6) Yozo Kanda : A Graphical Representation of the Piezoresistance Coefficients in Silicon, IEEE TRANSACTIONS ON ELECTRON DEVICES, VOL. ED 29, NO. 1, (1982)
7) Sekwang Park, Hyungpyo Kim and Yunseok Kang : Study of Flow Sensor Using Finite Difference Method, Sensors and Material, Vol. 7, No. 1, (1995)
8) ISO7730, International Standards Organization, Genova, (1984)
(2006년 6월 26일 접수, 2006년 11월 20일 채택)