Meta-analysis Study on Microenvironmental Characteristics of Radon Concentration in Korea
Cheol Min Lee*
†, Jung Sub Lee**, and Hye-Won Lee***
*Department of Chemical and Biological Engineering, Seokyeong University
**Environmental Health Research Division, Environmental Health Research Department, National Institute of Environmental Research, Ministry of Environment
***Institute of Risk Assessment, Seokyeong University
ABSTRACTObjective: The present study analyzed domestic and overseas academic journals to understand the research status and characteristics of radon concentration distribution in Korea in accordance with environmental conditions.
Methods: As part of the meta-analysis, pooled average concentration was calculated using an inverse variance- weighted average of the arithmetic means and standard deviations among the investigated values. Using the obtained pooled average concentration, a Monte-Carlo simulation was performed to increase the reliability of the occurrence possibility of the calculated concentration distribution. A total of 38 research articles were selected, including 27 articles published in domestic academic journals and 11 articles published in foreign academic journals.
Results: The comparison results showed differences in radon concentration distribution in accordance with regional and topographical characteristics.
Conclusion: Currently, even though research into radon is steadily picking up the pace in Korea much remains to be done. Additional research is thus needed to establish a baseline for radon emissions in Korea.
Key words: 222Rn, Monte-Carlo simulation, radon, meta-analysis
I. Introduction
Radon (
222Rn) is the most potential and harmful radioisotope among the radon isotopes.
1)It arises from soil and seeps into residential environments through concrete floors and wall cracks, holes in the floor, drain age pumps, connections between buildings, and small gaps or openings in hollow block walls. It is known that radon concentrations could sometimes reach levels harmful to public health if the gas flowing into a closed room is concentrated enough.
2)Generally, the concentration of radon in outside
air is very low but it can increase to high levels due to accumulation of radon gas in closed spaces.
The freezing point of radon is below minus 68
oC, and above this temperature, the element turns into gas. Because of its colorless and odorless properties in the gaseous state, radon is undetectable by human senses even in closed indoor spaces. More- over, radon is a radioactive gas, which decays into radioactive elements such as
218Po or
214Po that emit alpha rays. These rays could cause serious damage to alveoli present in the lungs.
3,4)Recent studies on people exposed to radon
5-7)showed that radon exposure at home and work is
†Corresponding author: Department of Chemical and Biological Engineering, Seokyeong University, 124 Seokyeong-ro, Seongbuk-gu, Seoul, 02713, South Korea, Tel: +82-2-940-2924, E-mail: [email protected]
Received: 11 June 2020, Revised: 19 June 2020, Accepted: 20 June 2020 초청논문 Invited article
a serious health risk, and people exposed to high concentrations of radon for extended periods of time have increased risks of eventually developing lung cancers due to the pathological effects and func- tional changes in the respiratory system. It was reported that this risk depends on the indoor con- centration of radon, duration of exposure, and degree of ventilation
8-11). As such, radon is mainly emitted from soil and rock. Building materials are also known to be a major potential source of radon in the indoor environment.
4,7,12-15)Even though the public’s concern about radon is increasing since a domestic broadcasting company started raising awareness about radon exposure and health risks via a special program in 2014, correct information on the distribution characteristics of radon concentrations and risk-related information is not sufficient due to the lack of relevant data and research in the Korean context.
13)Accordingly, the Korean Ministry of Environment started a four-year R&D program with the purpose of collecting risk- related information on radon and developing rele- vant and suitable communication techniques and a radiation hazard index.
13)The present study collects and presents the research findings published in domestic and foreign academic journals as a part of an effort to understand the current situation on radon research in Korea as well as the distribution characteristics of radon concen- trations in various environments.
II. Materials and Methods
1. Data collection
In order to collect the necessary information on domestic radon concentrations, relevant research papers were selected via a literature review and spe- cific selection criteria using an electronic journal search. Additional research articles corresponding to the contents of the present study were short listed from the reference lists of the previously selected research papers.
The words used for the literature search included the following: ‘radon’, ‘natural radiation’, ‘indoor environment’, ‘atmosphere’, ‘underground water’,
‘construction materials’, and ‘soil’. Words relating to environmental media, namely, ‘air’, ‘water’, and
‘soil’ were also used. The literature selection was limited to the Korean context, and only research articles published in related domestic and foreign academic journals, excluding presentations and reports at academic conferences, were selected. Thus, the resulting identified articles referred to investigations of radon under a domestic environment.
A total of 38 research articles were selected, including 27 articles published in domestic aca- demic journals and 11 articles published in foreign academic journals. The findings of these research articles helped in the identification of trends in radon research in Korea, and the distribution char- acteristics of radon concentrations under various conditions were then reviewed.
2. Data analysis
The collected data were used to review trends in radon concentration studies in Korea in terms of the year of investigation and the media. The types of investigation methods were also examined, and the distribution characteristics of radon concentrations according to various conditions, such as regions, seasons, construction materials, and soil (rock) media were identified. Then, pooled average con- centrations were presented as the inverse variance- weighted average as a result of meta-analysis for the arithmetic means and standard deviations among the investigated values using R statistics program.
A Monte-Carlo simulation was performed using the calculated pooled average concentration. This simu- lation was performed to understand the reliability of occurrence possibility of the calculated concentra- tion distributions, wherein the possibility of occur- rence was confirmed if thrice the standard deviation of the concentration range exceeded 99%.
The inverse variance-weighted average method,
which helps analyze effect–magnitude measures, is a method for calculating pooled averages from aver- age concentrations. These concentrations were sourced from the selected studies, with due consid- eration given to the size of each study such as the extent of data.
23)The method assumes an approxi- mately normal distribution of the estimated quantity of the pooled averages.
That is,
θ
1= N(θ
i, ω
i−1), i = 1, 2, ..., k
Here, ω
iis the inverse variance of θ
1, that is, . In addition, k denotes the number of studies and is independent. Therefore, if the esti- mated quantity of the pooled averages is assumed to be θ
1= θ
2=…= θ
k= θ, the distribution approxi- mates the normal distribution as follows.
Therefore, the relevant equations are
and
Assuming an asymptotic normal distribution of θ
1, the 95% confidence interval of θ
1was obtained using the equation below.
Here, ω
iacts as a weight in the pooling results, similar to many studies.
III. Results
1. Radon-related research in Korea
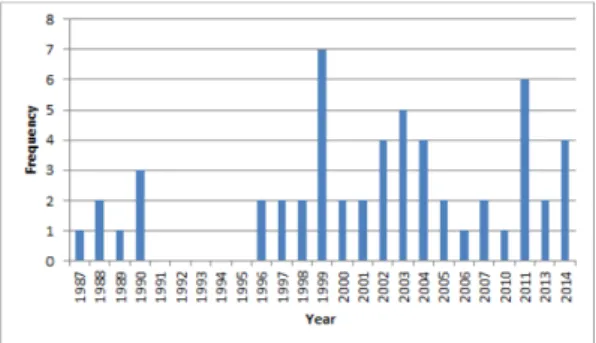
Figure 1 presents a sorting of the selected studies based on the year the field survey was conducted
in. This arrangement helps analyze the trends in research on radon with regard to various situations.
If the field survey was continued in the following year, the beginning year was used as a marker. If it was carried out over multiple years, each year was sorted and considered separately. If the year of the survey was not noted in the study, its submis- sion date was used to sort it accordingly.
The first domestic study on radon was carried out by the previous study,
16)who measured radon con- centrations in soil by installing radon cups at a depth of 50 cm below the ground at four locations in Jeju city from May 1987 to April 1988. The first surveys of radon concentration in indoor air were conducted by the previous study,
18)who surveyed indoor air radon concentrations in 34 houses with basements, general underground shopping arcades, subways, underground passages, and underground parking lots from February 1988 to January 1989.
This study surveyed radon indoor air concentrations for four locations (Seoul, Gunsan, Songtan, and Dogo) from December 1988 to April 1989. It was found that research on radon in Korea started in 1987 and continued until 1990, but no findings were reported from 1991 to 1994. Thereafter, stud- ies on this topic continued from 1995 to 2014.
These studies were most actively carried out in 1999, when as many as seven studies were pub- lished.
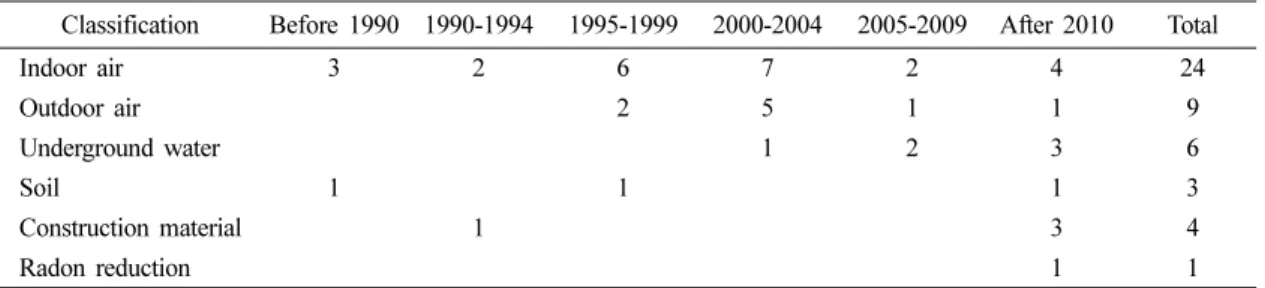
Table 1 sorts and presents the selected studies in
ωi 1
var θ( ) ---
=
θiωi~N θ ω( ∑ i,∑ωi)
∑
θ Σi 1k= θiωi
Σi 1k= ωi
---
=
var θ( ) 1 Σi 1k= ωi ---
=
θ 1.96 1
Σi 1k= ωi
---
±
Fig. 1. Trends showing number of studies on radon in various environments in Korea by year
terms of the media surveyed or the purpose of the survey (outdoor air, indoor air, soil, underground water, construction material, and radon reduction efficiency). It presents the trends in research on radon in Korea every five years. If the field survey was carried over to the following year, the results of the study that stretched over a longer period were retained. If the study covered multiple years, it was sorted in terms of each year in question. If the survey year was not identified in the research paper, the year of the study’s publication was used to sort the study (as explained previously).
The present study classified domestic radon- related surveys into indoor air radon concentration surveys, outdoor air (atmospheric) radon concentra- tion surveys, underground water radon concentration surveys, and radon emissions from soil and con- struction materials. Only one survey addressed reduction in radon concentration after construc- tion.
19)It was found that many indoor air radon concentration surveys have been steadily carried out from the beginning of the study period to the pres- ent year, whereas indoor air radon concentration surveys and underground water radon concentration surveys have been consistently performed after 1995 and 2000, respectively. Only a total of three soil radon concentration surveys were identified, one before 1990, one between 1995 and 1999, and one after 2010.
Most of these studies could have been spurred by the findings of previous work on radon in the envi- ronment, namely those that confirmed that radon
was a cause of lung cancer among uranium mine workers and that exposure to radon in closed indoor spaces and increase of radon exposure time raised the possibility of lung cancer occurrence.
3,5-7,11,20-22)In addition, radon is emitted from soil and is reported to be introduced indoors through cracks in building flooring (85-90%), construction materials (2-5%), and underground water (1% or less).
3)Radon is also known to dissolve and accumulate in water from underground sources.
4,7,15,23-26)The impor- tance of radon sources has also been recognized in Korea. Thus, radon concentration surveys in the underground water of subway stations have been carried out as part of air quality management, with many surveys of underground water and building materials having been conducted since 2000 from the perspective of collating baseline data to deter- mine the sources of the gas and to establish radon management plans.
2. Characteristics of radon concentration distribution in indoor environments
The present study was carried out in 2014 to secure basic data on the dangers of radon exposure, and developing communication methods and a haz- ard index over the next four years. To evaluate the effect of radon exposure on health, the data were reanalyzed using the findings of only those studies that investigated radon concentrations with an alpha track detector. This was done in the interests of attaining reliable results, by utilizing long-term rather than short-term measurements.
Table 1. Trends showing annual research on radon conducted in accordance with the media and survey purposes (unit: number of studies) Classification Before 1990 1990-1994 1995-1999 2000-2004 2005-2009 After 2010 Total
Indoor air 3 2 6 7 2 4 24
Outdoor air 2 5 1 1 9
Underground water 1 2 3 6
Soil 1 1 1 3
Construction material 1 3 4
Radon reduction 1 1
As part of the effort to calculate radon concen- trations inside residences nationwide, the pooled average concentration of radon was calculated using survey data from houses located in the metropolitan cities of Seoul, Busan, Daegu, Gwangju, Daejeon, and Incheon and nine Korean provinces (Table 2).
The pooled average indoor air concentration of radon within a residence was found to be 57.7±5.8 Bq/m
3, which does not exceed the recommended criterion for radon in the air of multi-purpose facil- ities as per the Indoor Air Quality Management Act of the Ministry of Environment, Korea. Moreover, this value is lower than half the recommended radon level in indoor residential air as per the stip- ulations of the United States Environmental Protec- tion Agency (148 Bq/m
3). The highest concentration of radon among the metropolitan cities was found in Seoul (76.2±20.1 Bq/m
3), and the highest concen- tration of radon among the provinces was found in Jeollabuk-do (90.2±30.5 Bq/m
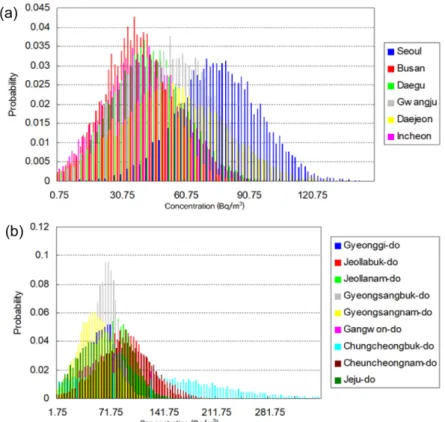
3). Fig. 2 shows pos- sible distributions of radon concentrations inside res-
idences located in six metropolitan cities and nine provinces, and calculated using a Monte-Carlo sim- ulation. The results show differences in the possible distribution of radon concentrations among cities. A comparison across six metropolitan cities indicates that Seoul and Chungcheongbuk-do have higher radon concentrations compared to other cities and provinces, respectively. Chungcheongbuk-do has high uranium content, and uranium is the mother nuclide of radon. Given the area’s topographic characteris- tics, it was home to many uranium mines, and thus shows higher radon concentration distribution com- pared to the other provinces. The data from these studies also showed that radon concentrations vary considerably within residences. Indeed, Lee et al.
(2012) found similar results and observed that radon concentrations within residences are affected by regional and topographical characteristics.
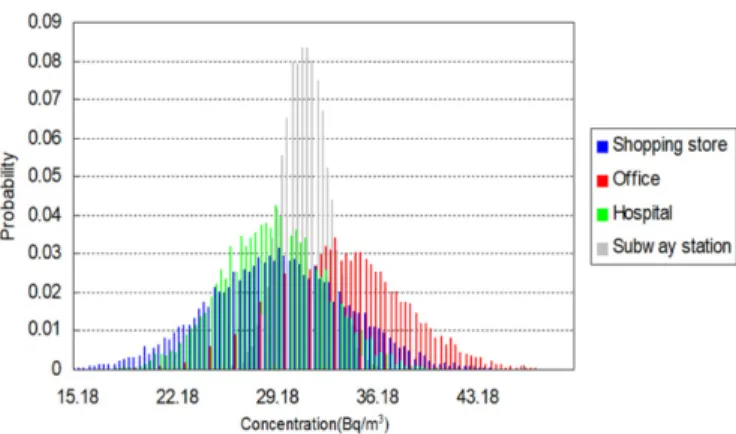
24)A comparison of radon concentrations in indoor air by building usage showed higher concentrations in offices and subways compared to stores and hos-
Table 2. Comparison of pooled average concentrations of radon in indoor residential air in metropolitan cities(unit: Bq/m3) Major metropolitan cities Number of studies Pooled average
concentration 95% confidence interval References
Seoul 7 76.2±20.1 36.8-115.6
Chang et al. (1991)3) Chung et al. (2001)7) Kim et al. (2002)18) Kim et al. (2005)19) Kim et al. (2011)17) Kim Y. S. (1990)15) Kim Y. S. (1991)16) Lee et al. (2006)26) Lee et al. (2015)25)
Busan 2 38.0±15.6 7.4-68.7
Daegu 2 43.0±17.8 8.1-77.9
Gwangju 2 57.2±17.8 22.3-92.1
Daejeon 2 52.8±25.3 3.3-102.4
Incheon 2 39.8±18.5 3.6-76.0
Gyeonggi-do 3 68.7±28.2 13.4-124.0
Jeollabuk-do 3 90.2±30.5 30.5-150.0
Jeollanam-do 3 76.6±23.9 29.7-123.4
Gyeongsangbuk-do 13 66.9±15.0 37.5-96.3
Gyeongsangnam-do 3 50.6±23.5 4.61-96.6
Kangwon-do 2 77.7±48.3 ND-172.3
Chungcheongbuk-do 2 87.7±103.9 ND-291.3
Chungcheongnam-do 3 89.6±37.5 16.2-163.0
Jeju 2 56.5±34.0 ND-123.1
Nationwide 51 57.7±5.8 46.3-69.0
ND: Not detected
pitals, but this difference was not large (Table 3).
To compare the distribution of radon concentrations by building usage, the possibility of the presence of radon in indoor air by building usage was calculated using a Monte-Carlo simulation. These results showed that the distribution of radon in offices was typically higher than that in other (non-office) build- ings. This may be due to insufficient ventilation than other building usages. In the case of subway stations, the fluctuation in radon concentrations was found to be lower than in the case of other building usages. In such cases, the low fluctuation in radon concentrations may be due to fewer environmental changes within each facility on account of con- trolled heating and air conditioning equipment. The difference in radon concentration within each sub- way station may be attributed to environmental fac- tors such as differences in geography and the depth
at which the station is located.
Figure 3 shows the results of a comparison of radon concentrations in underground and above- ground spaces.
28-31)Note that the under- and above- ground spaces of apartments were excluded from this analysis as it was determined that inclusion of these spaces may confound the data analysis; in the case of apartments, the differentiation between under- and above-ground spaces is not clear, and given the current structure of the apartments, there is no living area in underground spaces.
The radon concentration in underground spaces was found to be higher than that of above-ground spaces; the pooled average concentration of radon in 16 underground spaces was 34.8±3.8 Bq/m
3, and the corresponding value for 16 above-ground spaces was 32.5±3.0 Bq/m
3. The distribution of radon con- centrations was also found to be higher in under-
Fig. 2. Calculated probabilities of the distributions of radon concentrations in indoor residential air for (a) six majormetropolitan cities and (b) nine provinces in Korea
ground spaces, as shown in Fig. 4. This result is in agreement with that of an existing study
32)which explained that radon is emitted from soil and the in sufficient ventilation of the air near soil causes radon concentrations to be higher in underground spaces. Our study also confirms that the radon con- centration in underground spaces exceeds that in above-ground spaces.
Residence types in Korea are diverse compared to
other countries. Accordingly, in the present study, the types of residences in previous work were clas- sified into traditional housing, modern housing, and apartments, and the radon concentrations in the liv- ing spaces of each residence type were recorded.
33-35)Then, the pooled average concentration was calcu- lated.
For traditional housing, reanalysis of the data obtained from two studies showed radon concentra-
Fig. 3. Calculated probabilities of the distributions of radon concentrations according to building usage Table 3. Comparison of pooled average concentrations of radon in indoor air according to building usage (unit: Bq/m3)Building type Number of studies Pooled average
concentration 95% confidence interval References
Shopping store 4 29.8±4.9 20.2-39.3 Jeon and Kim (2006)10)
Jeon et al. (2007)11) Kim et al. (2002)18) Lee et al. (2006)26) Yoon et al. (2010)39)
Office 4 33.4±4.5 24.5-42.3
Hospital 4 29.1±3.6 22.0-36.1
Subway station 7 31.1±1.6 28.0-34.3
Fig. 4. Calculated probabilities of the distributions of radon concentrations in underground and above-ground spaces
tions of 70.6±57.4 Bq/m
3. The corresponding values for modern housing and apartments were 79.0±24.4 Bq/m
3and 40.1±9.8 Bq/m
3(from three studies each).
Apartments showed the lowest pooled average con- centration, whereas traditional housing showed pooled average concentrations lower than those of modern housing. The result indicates that, in the case of apartments, the radon emitted from soil seeps indoors to a less extent compared to other types of housing. The results of the comparison of the dis- tributions of pooled average concentrations of radon for traditional and modern housing showed that while the former has a wide concentration distribu- tion, modern housing is characterized by a narrower distribution compared to traditional housing. On the other hand, the average radon concentration is higher in modern housing than traditional housing (Fig. 5). This may be governed by the ventilation conditions depending on the building structure; in the case of traditional housing, they contribute sig- nificantly to the indoor radon concentrations com- pared to modern housing.
IV. Discussion
Recently, social interest in radon emissions in the indoor air environment has increased. Radon is mainly emitted by the soil and rock in building construction, and these emissions also add to radon
concentrations in indoor environments. It is known that people exposed to high concentrations of radon for an extended period of time could possibly develop lung cancer. Accordingly, active research on indoor radon is needed, and it is necessary to arrive at a baseline to be able to conduct relevant research in the future. On the other hand, research on radon is insufficient in the Korean context. Accordingly, the Ministry of Environment started research with the purpose of collecting information related to the danger of radon, and to develop communication methods and a suitable hazard index. To understand current status of radon-related research in Korea as well as the distribution characteristics of radon con- centrations in terms of environmental conditions, the findings of domestic and foreign academic journals were analyzed.
Material for this study was collected from elec- tronic journals via a literature reviews and research articles matching the content of the present study were selected.
Specific terms words were used in literature
search, which focused on investigations in domestic
environments. A total of 38 research articles were
selected (27 articles published in domestic academic
journals and 11 in foreign academic journals). The
trends of radon-related research in Korea and the
characteristics of radon concentration distributions
under various conditions were then investigated in
Fig. 5. Calculated probabilities of the distributions of radon concentrations according to residence typesterms of the year of the investigation and environ- mental media.
In addition, to probabilistically present the charac- teristics of radon concentration distributions, pooled average concentrations were calculated using inverse variance-weighted averages as part of the meta-anal- ysis of the arithmetic means and standard deviations among the investigated values. The obtained pooled average concentrations were fed into a Monte-Carlo simulation to increase the reliability of the occur- rence possibility of the calculated concentration dis- tributions.
Radon-related domestic surveys were classified into those measuring the amount of radon emitted in indoor, outdoor, underground water, and soil environments as well as by construction materials.
The first domestic radon-related research was car- ried out by Kang and Kim,
17)who measured radon concentrations in soil by installing radon cups.
Later, Kim et al.
28)carried out the first survey of radon concentrations in indoor air at four locations in Korea. These studies likely focused on radon concentrations in closed spaces given previous reports of the relationship between lung cancer in uranium mine workers and radon. With regard to the source of radon in indoor spaces, the highest proportion is reported to have been emitted from soil through gaps in building flooring (85-90%), fol- lowed by the radon emitted form construction mate- rials (2-5%) and underground water (1% or less).
3,36)The present study helped clarify the status of research on radon in Korea as well as the distribu- tion characteristics of radon concentrations under various conditions. Currently, even though research into radon is steadily picking up the pace in Korea much remains to be done. Additional research is thus needed to establish a baseline for radon emis- sions in Korea, and its results would be helpful to establish radon reduction policy.
V. Conclusions
To evaluate the effect of radon exposure on health, this study used data from long-term mea- surements effected with an alpha track detector so as to produce reliable results. The pooled averages of indoor residential radon concentrations were highest in Seoul and Jeollabuk-do among large domestic metropolitan cities and nine provinces (76.2±20.1 and 90.2±30.5 Bq/m
3, respectively).
As a result of Monte-Carlo simulation for possible distributions of radon concentrations had differences existed in the distributions of radon concentrations because of regional and topographical characteris- tics. Distributions of radon concentrations according to building usage were compared using Monte-Carlo simulation, and showed that the radon concentration in offices (where ventilation may be insufficient) was more or less high than that of buildings with other usages.
Radon concentrations were also compared between the underground and aboveground cases. As the dif- ferentiation between the aboveground and under- ground spaces in apartments is ambiguous, and because most underground spaces of apartments do not serve as living spaces, apartments were excluded from the analysis. The radon concentration in under- ground spaces was higher than that of aboveground spaces. This result can be attributed to the fact that the major source of radon is soil, and underground spaces are thus obviously influenced to a greater extent by radon concentration.
A comparison of radon concentration by residence
types (traditional housing, modern housing, and
apartments) indicated that apartments had the lowest
radon pooled average density (40.1±9.8 Bq/m
3). The
distributions of the pooled average concentrations of
radon showed that modern housing has a narrower
distribution compared to traditional housing. In the
case of apartments, the amount of radon seeping from soil in to the indoor environment was small, while modern housing was found to be less affected by the ventilation conditions due to the building structure compared to traditional housing.
Acknowledgments
This work was supported by a grant from the National Institute of Environment Research (NIER), funded by the Ministry of Environment (MOE) of the Republic of Korea (NIER-2020-04-01-001).
References
1. Barescut J, Laqriviere D, Stocki T, Chang BU, Kim YJ, Song MH, Kim GH, Jeong SY, Cho KW. Mea- surement of indoor radon concentration and actual effective dose estimation of schools at high radon area in Korea. Radioprotection. 2011; 46(6): S91- S95.
2. Bavarnegin E, Fathabadi N, Vahabi Moghaddam M, Vasheghani Farahani M, Moradi M, Babakhni A.
Radon exhalation rate and natural radionuclide con- tent in building materials of high background areas of Ramsar, Iran. Journal of Environmental Radio- activity. 2013; 117: 36-40.
3. Chang SY, Ha CY, Lee BH. Effective dose equiva- lent due to inhalation of indoor radon-222 daugh- ters in Korea. Journal of Radiation Protection and Research. 1991; 16(1): 1-13.
4. Chen J, Rahman NM, Atiya IA. Radon exhalation from building materials for decorative use. Journal of environmental radioactivity. 2010; 101(4): 317- 322.
5. Cho BW, Sung IH, Cho SY, Park SK. A prelimi- nary investigation of radon concentrations in ground water of South Korea. Journal of Soil and Ground- water Environment. 2007; 12(5): 98-104.
6. Cho BW, Choo CO, Kim MS, Lee YJ, Yun U, Lee BD. Uranium and radon concentrations in ground- water near the Icheon granite. The Journal of Engi- neering Geology. 2011; 21(3): 259-269.
7. Chung HJ, Baek SH, Kim JH. Radon concentration and prediction of annual exposure rate of under- ground shopping center in Daejeon area. Journal of Korean Society of Environmental Administration.
2001; 7(2): 219-225.
8. Cothern CR, Smith Jr JE. Environmental radon 35, 1st ed. New York: Springer Science & Business Media; 1987.
9. European Commission (EC). Radiological protec- tion principles concerning the natural radioactivity of building materials. Radiation Protection 112.
1999.
10. Jeon JS, Kim DC. Distribution of 222Rn concentra- tion in Seoul stations. Journal of Korean Society of Environmental Engineering. 2006; 28(6): 558-595.
11. Jeon JD, Kim DC, Lee JY. Temporal variations and sources of 222Rn in subway stations. Journal of Korean Society of Environmental Engineers. 2007;
29(11): 1231-1242.
12. Kang DW, Kim HG. Measurement of radon concen- tration in the near-surface soil gas by CR-39 detec- tors. Radiation Protection. 1988; 13(2): 57-66.
13. Kim HT, Lee CM, Kwon MH, Park TH, Park SH, Kwak JE, Kim SD. Research on preliminary study for the development of a risk communication pro- gram for radon. Journal of odor and indoor envi- ronment. 2016; 15(4): 375-384.
14. Kim YS. Indoor radon concentrations in the Seoul area. Korean Journal of Environmental Health Soci- ety. 1989; 15(1): 11-18.
15. Kim YS. Indoor radon levels in four different areas in Korea. Korean Journal of Environmental Health Society. 1990; 16(1): 1-7.
16. Kim YS. Indoor and outdoor radon concentrations in selected homes near nuclear power plants. Jour- nal of Korean Public Health Association. 1991;
17(2): 60-66.
17. Kim YJ, Chang BU, Park HM, Kim CK, Tokonami S. National radon survey in Korea. Radiation Pro- tection Dosimetry. 2011; 146(1-3): 6-10.
18. Kim YS, Lee CM, Kim HT, Iida T. A survey of indoor and outdoor radon concentrations by alpha track detector in Korea. Korean Journal of Environ- mental Health Science. 2002; 28(5): 71-76.
19. Kim YJ, Lee HY, Kim CS, Chang BU, Rho BH, Kim CK, Tokonami, S. Indoor radon, thoron, and thoron daughter concentrations in Korea. Interna- tional Congress Series. 2005; 1276: 46-49.
20. Kurnaz A, Küçükӧmeroğlu B, Çevik U, Çelebi N.
Radon level and indoor gamma doses in dwellings of Trabzon, Turkey. Applied Radiation and Iso- topes. 2011; 69(10): 1544-1559.
21. Lázár I, Tóth E, Marx G, Cziegler I, Köteles GJ.
Effects of residential radon on cancer incidence.
Journal of Radioanalytical and Nuclear Chemistry.
2003; 258(3): 519-524.
22. Lee DH, Ryu SH, Jo JH, Seo SC. Evaluation for effectiveness of radon mitigation on dwellings and public buildings in Korea. Journal of Korean Soci- ety of Occupational and Environmental Hygiene.
2014; 24: 518-527.
23. Lee CM, Kim YS, Kim KY, Kim JC, Jeon HJ.
Trend of study on suspended microorganism in Korea. Journal of Korean Society for Indoor Envi- ronment. 2007; 4(1): 59-71.
24. Lee CM, Sim IS, Cho YS, Park GY, Kim YS, Nam Goung SJ, Joo YK. Radon concentrations in vari- ous indoor environments and effective doses to inhabitants in Korea. Environmental and Pollution.
2012; 1(1): 55-68.
25. Lee ER, Chang BU, Kim HJ, Song MH, Kim YJ.
Geographical distribution of indoor radon and related geological characteristics in Bonghwa County, a provisional radon-prone area in Korea.
Radiation Protection Dosimetry. 2015; 167(4): 620- 625.
26. Lee JD, Kim YS, Son BS, Kim DS. A study of radon concentration in first floor and basement and prediction of annual exposure rate in Korea. Jour- nal of Environmental Science International. 2006;
15(4): 311-317.
27. Lubin JH, Boice Jr JD. Lung cancer risk from res- idential radon: meta-analysis of eight epidemio- logic studies, Journal of the National Cancer Insti- tute. 1997; 89(1): 49-57.
28. Neuberger JS, Gesell TF. Residential radon expo- sure and lung cancer: risk in nonsmokers. Health Physics. 2002; 83(1): 1-18.
29. Park TH, Kang DR, Park SH, Yoon DK, Lee CM.
Indoor radon concentration in Korea residential environments. Environmental Science and Pollu- tion Research. 2018; 25(13): 12678-12685.
30. Saad AF, Abdalla YK, Hussein NA, Elyaseery IS.
Radon exhalation rate from building materials used on the Garyounis University campus, Benghazi, Libya. Turkish Journal of Engineering and Environ-
mental Sciences. 2010; 34(1): 67-74.
31. Shweikani R, Giaddui TG, Durrani SA. The effect of soil parameters on the radon concentration val- ues in the environment. Radiation Measurements.
1995; 25(1-4): 581-584.
32. Singh AK, Kumar A, Prasad R. Distribution of radon levels in Udaipur. Asian Journal of Chemis- try. 2006; 18(5): 3408-3411.
33. United Nations Scientific Committee on the Effects of Atomic Radiation (UNSCEAR). Sources and effects of ionizing radiation: sources. United Nations Publication (Vol. 1). 2000.
34. United Nations Scientific Committee on the Effects of Atomic Radiation (UNSCEAR). Effects of ioniz- ing radiation: UNSCEAR 2006 report to the gen- eral assembly, with scientific annexes. United Nations Publications (Vol. 2). 2000.
35. United Nations Scientific Committee on the Effects of Atomic Radiation (UNSCEAR). Effects of ioniz- ing radiation: UNSCEAR 2006 report to the gen- eral assembly, with scientific annexes. United Nations Publications (Vol. 2). 2008.
36. Webb GAM. Exposure to radon. Radiation Protec- tion Dosimetry. 1992; 42(3): 191-195.
37. World Health Organization (WHO). Fact sheet No.
291: Radon and cancer. 2005. http://www.who.int/
mediacentre/factsheets/fs291/en/index.html.
[accessed 10 June 2020].
38. World Health Organization (WHO). WHO hand- book on indoor radon: a public health perspective.
2009. http://www.who.int/ionizing_radiation/env/
9789241547673/en/. [accessed 10 June 2020]
39. Yoon SW, Chang BU, Kim YJ, Byun JI, Yun JY.
Indoor radon distribution of subway stations in a Korean major city. Journal of Environmental Radio- activity. 2010; 101(4): 304-308.
<저자정보>
이철민(교수), 이정섭(연구관), 이혜원(연구원)