37
Evaluation of computed tomographic and radiographic myelography in normal miniature pigs
Mihyun Choi, Hyeyeon Lee, Mieun Kim, Junyoung Kim, Namsoon Lee, Jinhwa Chang, Joohyun Jung, Mincheol Choi*
College of Veterinary Medicine, Seoul National University, Seoul 151-742, Korea (Accepted: March 3, 2010)
Abstract :Evaluation of the myelography was studied in miniature pigs. Radiographs and computed tomographic (CT) images of the whole spine were obtained at clinically healthy twelve miniature pigs of 4 (8.7-10 kg) and 12 (26-31 kg) months. The assessments of the spinal cord were made in accordance with the Pavlov’s method and compared area ratio [at spinal cord (SC), vertebral canal (VC) and vertebral body (VB)]. The Pavlov’s ratio in the cervical spine was significant larger than that of thoracolumbar in radiographic myelography. On CT myelography, the area of the spinal cord had a significant difference between the cervical and thoracolumbar spine. Among the cervical spine, the ratios of spinal cord and vertebral body (SC : VB), vertebral canal and vertebral body (VC : VB) were minimum at the level of 4th cervical spine in both ages, while maximum at the level of 6th cervical spine in both months. In case of lumbar spine, the ratios of spinal cord and vertebral body (SC : VB) were the largest at the level of 4th lumbar spine in 4 months and at the level of 3rd lumbar spine in 12 months. In addition, the ratio of spinal cord and vertebral body (SC : VB) of the cervical spinal cord was significant lower at 4 months but the lumbar spinal cord showed lower pattern at 12 months old miniature pigs.
Keywords :computed tomography, miniature pigs, myelography, Pavlov’s ratio, radiography
Introduction
The miniature pigs recently have been used as substitution human models for experimental studies on compression of the spinal cord such as cauda equina syndrome was presented by several researchers [1, 4, 10-12]. Spinal disorders have been reported to play a major role in the development of symptoms as well as the prognosis [2] of a variety of diseases including Whiplash injury [10], which is characterized by persistent symptoms, and traumatic limb-plegia, neuro- pathy and degenerative changes.
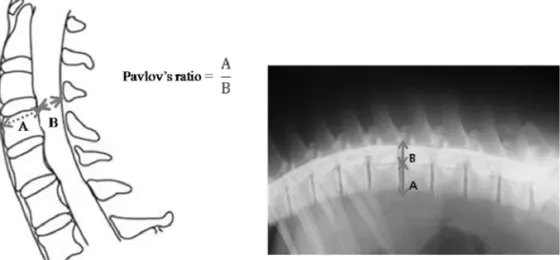
Using standard myelography and computed tomo- graphic (CT) myelography, there are a variety of ways to evaluate spinal cord. One of the most preferred techniques is to measure Pavlov’s ratio that is calculated using the diameter of the spinal canal and the diameter of the vertebral bodies at the midpoint [13]. This method is easy to calculate, useful and
unaffected by magnification errors on plain lateral radiographs.
The goals of this study are qualitative and quantitative evaluation of the normal spinal cord of the miniature pigs. Qualitative analyses were performed to general description of the normal spinal cord. Quantitative analyses were assessed using Pavlov’s ratio on the myelographic images and the area ratio of the spinal cord and vertebral body (SC : VB), the vertebral canal and vertebral body (VC : VB) on the CT myelographic scans of the miniature pigs. Furthermore these data inferred standard value of the normal spinal cord compared to experimental animal of the spinal disorders.
Materials and Methods
Animals
Ten healthy miniature pigs at 4 and 12 months of age were used in this study. All animals (PWG micro-
*Corresponding author: Mincheol Choi
Department of Veterinary Medicine, Seoul National University, Seoul 151-742, Korea [Tel: +82-2-880-1278, Fax: +82-2-880-8662, E-mail: [email protected]]
pig; PWG Genetics Korea, Korea) were raised under strict SPF barrier system and microbiologically well defined conditions. The miniature pigs were individually housed indoors in cages, fed dry pig food, and provided with water ad libitum.
Methods
The miniature pigs were fasted for one day prior to evaluation of the lumbar cistern myelography. General sedation was induced with an intramuscular injection of tiletamine plus zolazepam (Zoletil; Virvac, Korea), at the volume of 3-5 mg/kg ten minutes before the procedures for all examined miniature pigs. Survey radiographic examinations were performed at two different positionings, a right lateral and a ventrodorsal projection. After that, myelography was performed by
fluoroscopic-guidance. Lumbar puncture was achieved with a 22-gauge spinal needle, usually L4-5 and L5- 6 level and a short length of extension line was connected to the needle. When the needle reached at the subarachnoid space, free flow of the cerebrospinal fluid was observed. After that moment, the contrast injection was performed through the spinal needle by hand with a 20-mL syringe at slow rate. Non-ionic, iodinated contrast medium (Omnipaque, 300 mgI/mL for iohexol) was used the dose of 10~15 mL for each animal. After finishing procedures, a radiographic examination was performed at first and then CT scanning of the whole vertebrae regions with a CT scanner. Technical setting for all CT scans was 60 kVp, 60 mAs, 5-7 mm slice thickness.
On radiographs, the diameters of the spinal cord and Fig. 1. Pavlov’s ratio at each level in the cervical and lumbar spine.
Fig. 2. Transverse CT scan image demonstrating ROI tracing used to calculate areas for the spinal cord (SC), vertebral canal (VC) and vertebral body (VB).
the vertebral body at the cranial end plate through cervical and lumbar spine. After that, the values were measured and calculated the Pavlov’s ratio [16] (Fig.
1). On CT images, the diameters of sagittal and transverse images of the cervical and lumbar SC, VC and VB were made at each vertebral body [5] (Fig.
2). Then, these data were transformed using formula of elliptical area (A=π ×a×b) and mean area ratios (SC : VC, VB : VC) were calculated [5]. Two measure- ments were taken independently at each level by two observers. The interobservers and intraobservers agreements were analyzed by using k statistics. The k values falls between 0 (chance agreement only) and 1 (perfect agreement) [7]. Correlation coefficient and a p-value analysis were used to evaluate the correlation between the diagnostic tools and measurement. These were also used to examine the relationship between the values derived at each level according to the diagnostic tools. These tests were performed to determine if a value taken at a level can also be indicative of the values taken at the other levels.
Results
Radiography
The subarachoid space of all vertebral columns was filled with contrast media and these columns appeared dorsal and ventral to the cord in the lateral projection while lateral to the cord in the ventrodorsal projection.
The shape of the subarachnoid space is discrete, thin columns of contrast medium that are nearly parallel except 5th lumbar region. Ventral thoracolumbar subarachnoid space is thinner than its corresponding dorsal subarachnoid space in two miniature pigs. An hour-glass constriction pattern (Fig. 3) with the lowest value at the 5th cervical spine in the 12 month-old, there was no statistical significance between the levels or between each month of the miniature pigs. The smallest Pavlov’s ratio value is 0.73 in the cervical spine and 0.56 in the lumbar spine (Tables 1 and 2).
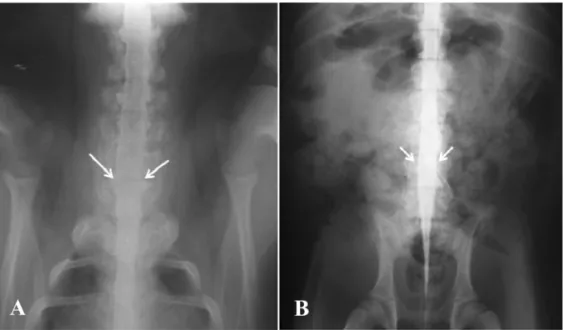
The biconvex shaped spinal cord appeared at level of 6th cervical and 4th lumbar spine (Fig. 4).
CT examination
The examination of CT images taken three times by
Fig. 4. Plain myelography shows brachial (A) and lumbar (B) intumescences.
Fig. 3. Comparision of Pavlov’s ratio calculated using plain myelography in the each month of the miniature pigs.
two observers was considered reliable at the cervical and lumbar spine level. The mean k values for the interobservers reliability were 0.9 at the cervical spine and 0.95 at the lumbar spine, respectively.
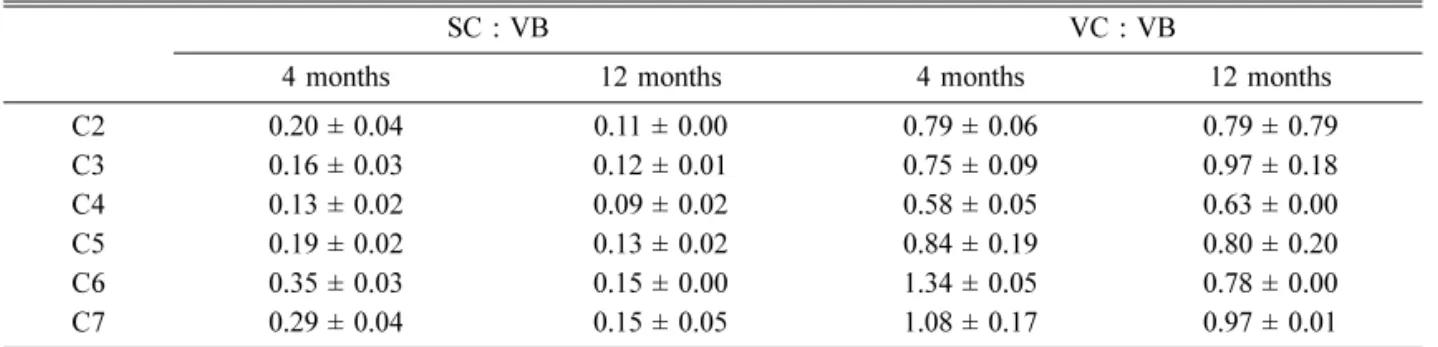
In CT evaluation, the SC and VB ratio in the cervical spine, the lowest value of spinal in each month was at the 4th cervical spine (0.13±0.02, 0.09±0.02; 4 and 12 months, mean±SE), whereas the highest value was at the 6th cervical spine (0.35±0.03, 0.15±0.00; 4 and 12 months, mean±SE) (Table 3). In the lumbar spine, the highest values were at the 4th lumbar (4 months, 0.12±0.02, mean±SE) and 3rd lumbar spine (12 months, 0.14±0.04, mean±SE) (Table 4).
In the VC and VB ratio, the lowest value in each
month was at the 4th cervical spine (0.58±0.05, 0.63
±0.00; 4 and 12 months, mean±SE). And the largest ratio was the 6th and 7th cervical spine (1.34±0.05, 0.97±0.01; 4 and 12 months, mean±SE) (Table 3).
In the lumbar spine, the highest values were at the 5th lumbar spine (4 months, 0.96±0.02, mean±SE) and L3 (12 months, 1.09±0.21, mean±SE) (Table 4).
In statistical analysis, the correlation coefficient was calculated to determine the correlation between the values that were Pavlov’s ratio and the area ratios (SC : VB, VC : VB). The results showed a significant correlation in the certain cervical and lumbar spine (p
< 0.01, r = 0.633).
Table 1. Pavlov’s ratio in the plain radiography at cervical spine (mean ± SE)
Age C2 C3 C4 C5 C6 C7
4 months 0.9 ± 0.11 0.95 ± 0.05 1.05 ± 0.10 1.03 ± 0.03 1.05 ± 0.07 0.99 ± 0.11 12 months 1.03 ± 0.08 0.94 ± 0.06 0.83 ± 0.04 0.79 ± 0.01 0.90 ± 0.01 0.94 ± 0.01 Table 2. Pavlov’s ratio in the plain radiography at lumbar spine (mean ± SE)
Age L1 L2 L3 L4 L5
4 months 0.67 ± 0.04 0.70 ± 0.04 0.73 ± 0.03 0.84 ± 0.02 0.83 ± 0.04
12 months 0.66 ± 0.08 0.64 ± 0.05 0.67 ± 0.05 0.79 ± 0.04 0.75 ± 0.04
Table 3. SC : VB and VC : VB of the cervical spine on CT myelography (Mean ± SE)
SC : VB VC : VB
4 months 12 months 4 months 12 months
C2 0.20 ± 0.04 0.11 ± 0.00 0.79 ± 0.06 0.79 ± 0.79
C3 0.16 ± 0.03 0.12 ± 0.01 0.75 ± 0.09 0.97 ± 0.18
C4 0.13 ± 0.02 0.09 ± 0.02 0.58 ± 0.05 0.63 ± 0.00
C5 0.19 ± 0.02 0.13 ± 0.02 0.84 ± 0.19 0.80 ± 0.20
C6 0.35 ± 0.03 0.15 ± 0.00 1.34 ± 0.05 0.78 ± 0.00
C7 0.29 ± 0.04 0.15 ± 0.05 1.08 ± 0.17 0.97 ± 0.01
SC: spinal cord, VB: vertebral body, VC: vertebral canal.
Table 4. SC : VB and VC : VB of the lumbar spine on CT myelography (Mean ± SE)
SC : VB VC : VB
4 months 12 months 4 months 12 months
L1 0.05 ± 0.01 0.10 ± 0.03 0.58 ± 0.03 0.94 ± 0.15
L2 0.08 ± 0.02 0.13 ± 0.01 0.89 ± 0.12 0.88 ± 0.19
L3 0.11 ± 0.04 0.14 ± 0.04 0.81 ± 0.17 1.09 ± 0.21
L4 0.12 ± 0.02 0.13 ± 0.01 0.92 ± 0.05 0.33 ± 0.27
L5 0.07 ± 0.00 0.03 ± 0.00 0.96 ± 0.02 0.89 ± 0.00
Discussion
Since Payne and Spillane [14] described the relationship between developmental myelopathy and spinal canal size, the diagnostic importance of the sagittal diameter (area) of the spinal canal has been reported by many authors [1, 3], and a myelography was proven to be a useful method in the measurement of the spinal disorders which showed neurologic impairments [8].
The spinal canal area can be evaluated in a variety of ways. The ratio of the sagittal diameter of the cervical canal to that of the vertebral body was first proposed as an indicator of the degree of develop- mental canal narrowing [13]. With the development of diagnostic methods, other reliable means for assessing disorders were introduced, such as the spinal canal area ratio to vertebral body from the single CT scans or CT myelography. The use of area ratios has been found to help correct difference in body sizes [5, 6].
In most animals, the normal myelography is characterized by discrete, thin columns of contrast medium that are nearly parallel except at the cauda equina where the subarachnoid space tapers to form the dural end sac. And it is also showed elevation of the ventral column and thinning of the contrast where it passes over the annuli of the intervertebral discs [15].
The spinal cord was not appear uniform in diameter owing to the normal widening of the spinal cord in the caudal cervical and lumbar spinal cord segments as a result of the brachial and lumbosacral spinal intumescences, respectively. It also known as the location of the lumbar intumescences is located more cranially in German Shepherds than in Dachshunds [9, 10].
In miniature pigs, tapering of the subarachnoid space region to form dural end sac near 5th lumbar spine was identified and this was same in other animals.
In CT examination, compared to 4 months and 12 months of miniature pigs, the diameter of the spinal cord was more thickened in 12 month-old ages.
Compared to SC : VB in each months of miniature pigs, except 2nd, 3rd and 4th lumbar spine, 12 months of miniature pigs of the ratio is more smaller than 4 months (p< 0.01) That means, the vertebral bodies grow more than spinal cord except 2nd, 3rd and 4th lumbar spine.
The height of spinal cord in the cervical spine was significant larger than thoracolumbar spine in radiographic myelography (p< 0.01). The area of the spinal cord
and the SC : VB had a significant difference between cervical and thoracolumbar spine (p< 0.01). That means cervical spinal cord and subarachnoid space were the largest spine where need prolonged contrast injection time when performing a myelography.
Among the cervical spine, through these data of the SC : VB, VC : VB, the narrowest region in 4th cervical spine showed an “hour-glass” constriction pattern.
While the widening level is the 6th cervical spine where the brachial intumescences, which is the part of the spinal cord where the nerve roots form the brachial plexus. Beyond 6th cervical spine, the cord reduced slightly in diameter as it passed into the thoracic spinal canal. In the lumbar spine, the ratios of SC : VB were largest at the level of 4th lumbar spine in 4 months and at the level of 3rd lumbar spine in 12 months miniature pigs. It called lumbar intumescences, where nerve terminals of neurons could be observed close to the motor somata.
The minimum Pavlov’s ratio value is 0.73 in the cervical spine and 0.56 in the lumbar spine. That means if some patients who had neurologic deficits and calculated less than 0.73 of the cervical Pavlov’s ratio, it might be suspected disease of the spinal disorders such as stenosis, respectively. Although the results of the correlation between Pavlov’s ratio and area ratio have somewhat limitations that p-value of the certain spine is high (p> 0.05), two values represent moderate positive correlation, generally. Therefore simple Pavlov’s method might alternate other spinal evaluating ways.
Conclusion
In this study, these data provide general charac- teristics of the spines of miniature pigs using diagnostic imaging methods. Though, further study is needed for the myelographic characteristics of variable ages, sex and many numbers of miniature pigs, it could be used for fundamental information such as minimum Pavlov’s ratio values. And these data could also be use database for evaluation of spines and play a role in the basic experimental animal data in the cervical and lumbar spinal disorders. Furthermore compared these value of normal and experimental disease animal models, it might identify correlation between neurological signs and quantitative analyzed values [16].
Acknowledgments
This work was supported by a grant (2007 0401034006) from BioGreen 21 Program, Rural Development Administration, Korea.
References
1.Burrows EH. The sagittal diameter of the spinal canal in cervical spondylosis. Clin Radiol 1963, 14, 77-86.
2.Fujiwara K, Yonenobu K, Ebara S, Yamashita K, Ono K. The prognosis of surgery for cervical compression myelopathy. An analysis of the factors involved. J Bone Joint Surg Br 1989, 71, 393-398.
3.Hinck VC, Sachdev NS. Developmental stenosis of the cervical spinal canal. Brain 1966, 89, 27-36.
4.Jespersen SM, Hansen ES, Høy K, Christensen KO, Lindblad BE, Ahrensberg J, Bünger C. Two-level spinal stenosis in minipigs. Hemodynamic effects of exercise. Spine (Phila Pa 1976) 1995, 20, 2765-2773.
5.Jones JC, Inzana KD, Rossmeisl JH, Bergman RL, Wells T, Butler K. CT myelography of the thoraco- lumbar spine in 8 dogs with degenerative myelopathy.
J Vet Sci 2005, 6, 341-348.
6.Jones JC, Wright JC, Bartels JE. Computed tomographic morphometry of the lumbosacral spine of dogs. Am J Vet Res 1995, 56, 1125-1132.
7.Kundel HL, Polansky M. Measurement of observer agreement. Radiology 2003, 228, 303-308.
8.Ladd AL, Scranton PE. Congenital cervical stenosis presenting as transient quadriplegia in athletes. Report of two cases. J Bone Joint Surg Am 1986, 68, 1371- 9.1374Morgan JP, Atilola M, Bailey CS. Vertebral canal and spinal cord mensuration: a comparative study of its effect on lumbosacral myelography in the dachshund
and German shepherd dog. J Am Vet Med Assoc 1987, 191, 951-957.
10. Murone I. The importance of the sagittal diameters of the cervical spinal canal in relation to spondylosis and myelopathy. J Bone Joint Surg Br 1974, 56, 30-36.
11. Olmarker K, Holm S, Rosenqvist AL, Rydevik B.
Experimental nerve root compression. A model of acute, graded compression of the porcine cauda equina and an analysis of neural and vascular anatomy. Spine (Phila Pa 1976) 1991, 16, 61-69.
12. Olmarker K, Rydevik B, Holm S. Edema formation in spinal nerve roots induced by experimental, graded compression. An experimental study on the pig cauda equina with special reference to differences in effects between rapid and slow onset of compression. Spine (Phila Pa 1976) 1989, 14, 569-573.
13. Pavlov H, Torg JS, Robie B, Jahre C. Cervical spinal stenosis: determination with vertebral body ratio method. Radiology 1987, 164, 771-775.
14. Payne EE, Spillane JD. The cervical spine; an anatomico-pathological study of 70 specimens (using a special technique) with particular reference to the problem of cervical spondylosis. Brain 1957, 80, 571- 15. 596.Roberts RE, Selcer BA. Myelography and epidurography. Vet Clin North Am Small Anim Pract 1993, 23, 307-329.
16. Song KJ, Choi BW, Kim SJ, Kim GH, Kim YS, Song JH. The relationship between spinal stenosis and neurological outcome in traumatic cervical spine injury:
an analysis using Pavlov's ratio, spinal cord area, and spinal canal area. Clin Orthop Surg 2009, 1, 11-18.
17. Yu YL, du Boulay GH, Stevens JM, Kendall B.
Morphology and measurements of the cervical spinal cord in computer-assisted myelography. Neuroradiology 1985, 27, 399-402.