Three-dimentional finite element analysis of a mandibular premolar with reduced periodontal support under a non-axial load
14
0
0
전체 글
(2) FE analysis in a lower premolar with reduced bone. perienced periodontal bone loss. According to the 10-year. loadings exhibited tensile stresses concentrating at the. longitudinal epidemiologic study for intra-oral pattern of. cervical areas and root surfaces with a trend of stress am-. tooth and periodontal bone loss between the age of 50 and. plification was observed with decreasing bone height [18].. 60 years [9,10], upper 2nd premolars and upper and lower. With the rise of elderly population with retaining teeth, the. molars had a higher mortality rate (7.5% of the aged >50. cumulative increase of the alveolar bone loss due to peri-. years). The lower premolars having bone loss of 2 mm–5. odontal disease and the resulting increased clinical crown. mm (equivalent to 1/4–1/2 bone loss) were still in function. length might be associated with increased prevalence of. with or without molar occlusion.. occlusal trauma and cervical defect in this population.. Generally, the extent of tissue changes from occlusal. However, the biomechanical analysis has been very rare in. trauma in dentine and periodontal tissues could be directly. mandibular premolars with reduced periodontal tissue un-. related to the magnitude and direction of the forces ap-. der non axial loading.. plied to tooth. As for loading direction, a role of occlusal. This study aimed to investigate the stress profile of tooth. forces was demonstrated in upper [11] and lower premolars. and its supporting tissue, especially in the cervical region. [12,13]. The occlusal force leaning against the tooth axis. and root area of a lower 2nd premolar with reduced bone. under the asymmetrical loading causes the tooth to bend,. support under different type of occlusal loading (axial and. and higher tensile stresses occurs on the cervical region at. non-axial).. the side opposite of the loading point, which leads to plastic deformation of the enamel surface. As the tensile yielding strength of enamel is much smaller than the compressive and the shear ones, the enamel surface in the tensile. MATERIALS AND METHODS The three-dimensional solid model generation. state tends to suffer plastic deformation. They reported that the type of occlusal loading has the biggest influence on. The tooth was selected based on its lack of carious le-. cervical stress intensity and exposure to stress would lead. sions, and absence of abnormalities, which could simplify. to its progression. On the clinical aspect, further attention. interpretation of results of a sound tooth model for FE. should be paid to the importance of the occlusal adjust-. analysis. To develop a three-dimensional (3D)-FE model. ment for the treatment of cervical tooth defects, if oblique. based upon actual geometric dimensions, sequential soft-. force loading on teeth contributes the major cause of the. ware processing was performed. The extracted left man-. cervical lesion.. dibular 2nd premolar tooth was scanned using 3D scanner. As for the supporting bone levels, the gingival reces-. (Freedom HD; DOF Inc., Seoul, Korea). Obtained surface. sion and periodontal bone loss increases with aging and. contours and meshes were then imported into SolidWorks. the bending phenomenon of crown portion increases and. 2015 software (Dassault Systemes SolidWorks Corp.,. finally results in different and extensive stress distribution. Waltham, MA, USA), and 3D solid model of the intact lower. in tooth and its periodontal tissue, compared to the tooth. 2nd premolar (with total tooth length of 19.8 mm, crown. with normal bone height. In addition, the action of occlu-. height of 6.7 mm, and root length of 13.1 mm) was gener-. sal forces, especially paraxial loading or lateral premature. ated by using a “SCANto3D” add-in module.. contact could lead to increased stress concentration on the. Interfacial surface between dentin and enamel were. tooth and supporting tissue. However, only a few stud-. made by lofting technique of the computer-aided design. ies reported the stress distribution in tooth with reduced. program according to the anatomy of natural tooth (eHu-. periodontal support for periodontal ligament (PDL) stresses. man 3D Tooth Atlas 7.6; eHuman Inc., Fremont, CA, USA).. following functional or nonfunctional occlusal loading on. Once enamel and dentin 3D volumes were generated,. upper central incisor [14,15] or for the cervical lesions in. Boolean operations were used to ensure congruence be-. upper premolar [16-18]. In the latter recent finite element. tween the related interfacial surfaces. The enamel volume. (FE) study with existing cervical lesions, non-functional. was created by subtracting the dentin volume. Then, the. 314. www.chosunobr.org.
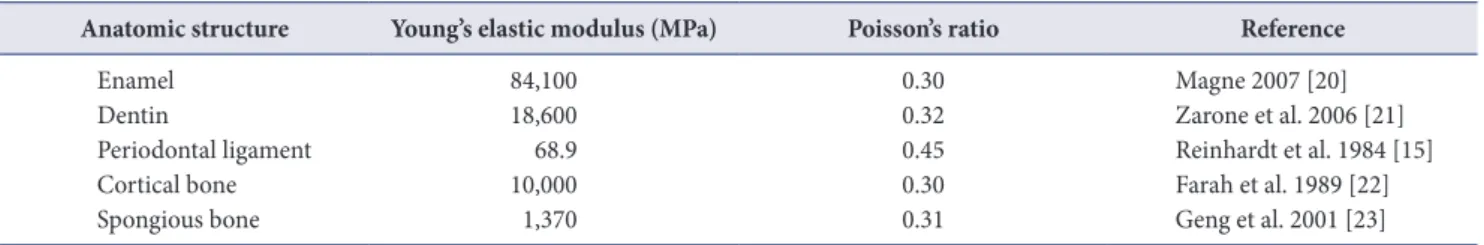
(3) Sun-Mi Yang and Hyun-Ju Chung. enamel and dentin 3D volume was combined to make a. Finite element analysis. final 3D solid model of the intact mandibular second premolar. Additionally, based on the outer geometry of the. Four 3D solid models were meshed with tetrahedral ele-. model, PDL and alveolar bone (cortical and spongious). ments. The number of elements and nodes varied according. were created. The PDL, cortical bone, and spongy bone. to the model (35,822–58,475 elements and 52,352–83,802. were modeled around the tooth root. Thicknesses of the. nodes). All models were assumed to be fixed at the mesio-. PDL, lamina dura, and outer cortical bone were assumed to. distal cross-section of alveolar bone, with no rotation or. be 0.25 mm, 0.4 mm, and 1.1 mm respectively, according. translation allowed in any direction. The mandibular bone. to the average anatomical dimensions obtained from the. sectional edges which restricted the displacement along the. CT data of patients treated at Chonnam National University. Z axis. All nodes on the lower surface of the cortical bone. Dental Hospital in Gwangju, Korea (Fig. 1). The cementum. were constrained in all directions (X, Y and Z), preventing. layer was not considered in this model due to small thick-. rigid body displacement, as the boundary conditions for all. ness and the properties similar to dentin [19] and the pulp. models. The materials from the different structures in the. was also disregarded.. models were assumed to have homogenous, isotropic, lin-. Bone levels were varied to represent different stages of periodontal tissue destruction. The alveolar bone crest was. ear elastic properties, represented by the Young’s modulus of elasticity and the Poisson’s ratio (Table 1) [15,20-23].. placed 0.8 mm–9.1 mm apical from the cemento-enamel. To simulate functional occlusal forces in vertical direc-. junction (CEJ) in models 1, 2, 3, and 4, respectively to sim-. tion, the static axial load (V) with the total load of 90 N was. ulate the tooth with normal periodontal support, 1/3 bone. applied on the tooth at 3 occlusal contact points (buccal. loss, 1/2 bone loss, and 2/3 bone loss (Fig. 2).. cusp tip and its mesial and distal slopes). To simulate lateral forces or nonfunctional paraxial loads on the slope of occlusal surface, the total force of 90 N was applied at 45° buccal or lingual to the long axis on the occlusal slope contact point of a tooth (lingual incline of the buccal functional. Y Z. Y X. Z. Fig. 1. Three-dimensional volumetric models for dental tissues and supporting structures reconstructed from scanned images and computed tomography images; surfaces of the structures: enamel, dentin, and periodontal ligament and supporting bone, and finally assembled model.. X. Fig. 2. Four three-dimensional models in which the bone levels were varied to represent different stages of reduced periodontal support (0, 1/3, 1/2, and 2/3 lost). The alveolar bone crest was placed 0.8, 4.8, 7.0, and 9.1 mm apical to the cemento-enamel junction of the tooth in models 1, 2, 3, and 4, respectively.. Table 1. Material properties Anatomic structure Enamel Dentin Periodontal ligament Cortical bone Spongious bone. Young’s elastic modulus (MPa) 84,100 18,600 68.9 10,000 1,370. Poisson’s ratio 0.30 0.32 0.45 0.30 0.31. Reference Magne 2007 [20] Zarone et al. 2006 [21] Reinhardt et al. 1984 [15] Farah et al. 1989 [22] Geng et al. 2001 [23]. 315.
(4) FE analysis in a lower premolar with reduced bone. cusp (simulating balancing contact on inner incline of buc-. the supporting bone levels, whereas extensive variation in. cal cusp, BB); or buccal incline of the lingual nonfunctional. stress intensity and distribution was seen in root and peri-. cusp (simulating working contact on inner incline of lingual. odontal structure under non-axial loading conditions. The. cusp under non-axial loads, WL), which represented work-. highest VMS stresses were found inside the occlusal enamel. ing or balancing nonfunctional contacts (Fig .3) [24,25].. at the load application area of crown. The enamel and den-. The contact interfaces between teeth, PDL and bone were treated as tie-constraint that was used to deter-. tin in the cervical area are the next parts bearing the highest stress.. mine one surface tied to another without sliding, in order. In the sagittal section image, the peak stress distributed. to simulate the attachment of the teeth to alveolar bone. along the dentino-enamel junction in the model 1 with. through PDL. The processing stage or solution analysis. normal bone level, and this stress distribution shifted api-. was performed with SolidWorks 2015 software, and this. cally along the root surface near to bone crest in model 2,. software also used in the post processing for the visualiza-. 3, and 4 with variable amount of bone loss (Fig. 4B). Un-. tion and evaluation of the analyzed results. The von Mises. der axial loading, similar pattern of stress distribution was. stress (VMS) values were calculated as the stress criteria to. observed on the root dentin adjacent to socket bone in. present the stress distribution in the models in the enamel,. models 1, 2, and, 3, respectively. In the model 4 with only. dentin, PDL, cortical, and cancellous bone.. 1/3 bone support, there was greater and extensive stress distribution along the buccal root surface at the apical 1/3.. RESULTS. Non-axial loading at 45° angle create a bending moment causing fiexure of the tooth resulting in peak VMS on the. The pattern of stress distribution in composite models. buccal or lingual surface of the root dentine depending on the direction, adjacent to the bone crest at which the fulcrum was located (Fig. 4B). Different to normal bone. The VMS profiles in composite 3D finite element analy-. support, the non-axial loadings resulted in prominently. sis (FEA) model are shown in Fig. 4. Under axial loading,. increased peak VMS on the surface of the radicular dentine,. there was only slight variation in the stress distribution and. near to bone crest in bone reduction models 2 and 3. In. intensity in tooth and supporting structures according to. model 4 with apical 1/3 bone support, intense and exten-. V. 30 N each x3 on buccal cusp. Y Z. 316. X. www.chosunobr.org. BB. 90 N on 45 inner incline of buccal cusp. WL. 90 N on 45 inner incline of lingual cusp. Fig. 3. Type of simulated occlusal contacts were in centric occlusion (as vertical axial load, V), balancing laterotrusion (as balancing non-axial lingual load, BB), and working laterotrusion (as working non-axial lingual load, WL), and boundary conditions and fixation of the models. Lower surface of the cortical bone were constrained in all directions. V, under axial load; BB, simulating balancing contact on inner incline of buccal cusp; WL, simulating working contact on inner incline of lingual cusp under non-axial loads..
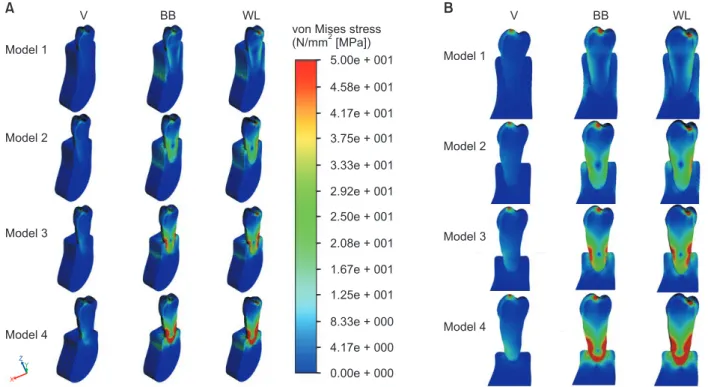
(5) Sun-Mi Yang and Hyun-Ju Chung. A. V. BB. B. WL von Mises stress (N/mm [MPa]) 5.00e + 001. Model 1. V. BB. WL. Model 1. 4.58e + 001 4.17e + 001 Model 2. 3.75e + 001. Model 2. 3.33e + 001 2.92e + 001 2.50e + 001 Model 3. 2.08e + 001. Model 3. 1.67e + 001 1.25e + 001 8.33e + 000 Model 4. Model 4. 4.17e + 000 Z Y. 0.00e + 000. X. Peak VMS (MPa) in enamel component. Fig. 4. von Mises stress profile in 4 composite three-dimensional finite element analysis models of lower 2nd premolars (A) and in the buccolingual sagittal image (B) under axial (V) and 2 non-axial (BB, WL) loading conditions. Under 2 non-axial loadings (BB and WL), the center of rotation apically shifted with the decreasing bone crest level. V, under axial load; BB, simulating balancing contact on inner incline of buccal cusp; WL, simulating working contact on inner incline of lingual cusp under non-axial loads.. Enamel MAX B CEJ L CEJ M CEJ D CEJ. 10,000. 1,000. 100. 10. 1 Vertical. B lateral. WL Vertical B lateral lateral. No bone loss. WL Vertical B lateral lateral. 1/3 bone loss. WL Vertical B lateral lateral. 1/2 bone loss. WL lateral. 2/3 bone loss. Fig. 5. Comparison of peak von Mises stress (VMS) values in cervical enamel region in 4 models under vertical and 2 non-axial (B, WL) loadings. Max., maximum; B, buccal; L, lingual; M, mesial; D, distal; CEJ, cemento-enamel junction in legend; WL, simulating working contact on inner incline of lingual cusp under non-axial loads.. sive stress distribution was observed approaching to the. gardless of the supporting bone levels, whereas there was. root apex.. prominent increase in the stress intensity to non-axial loadings (Fig. 4B, 5). Stresses on cervical region under axial. The stress profile in tooth crown component. loading were highest at the buccal surface (14–17.1 MPa) and minimal at lingual and proximal surfaces with the. Stress distribution profile in CEJ region was similar, re-. range of 2–6 MPa. The peak lingual VMS was approximate-. 317.
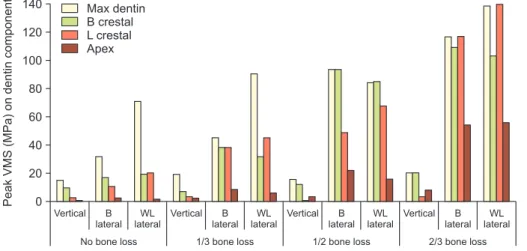
(6) FE analysis in a lower premolar with reduced bone. the bone crest was increased at the lingual surface on WL. ly 1/4 of buccal cervical peak values.. loading in model 2 and 4, whereas BB loading resulted in. Vertical and BB loadings resulted in greater stress con-. greater stress at the buccal surface in model 3.. centration in buccal CEJ than the lingual, and WL loading resulted in greater VMS concentration in lingual CEJ than. In root apex, peak dentinal VMS values was only 1–2 MPa. the buccal. The influence of supporting bone level was. in model 1 under axial load, and increased over 50 MPa in. minimal and the buccal stress increased by 15% in model 3. model 4, under non-axial loadings. With bone reduction,. and 4, under BB and WL loadings both.. the peak VMS magnitude increased on crestal root surface as well as on apical region, showing more dramatic rise of peak stress in root apex than near to bone crest.. The stress profile in dentinal root Under axial loading, peak VMS of 10 MPa was shown. The stress profile in periodontal ligament. along the buccal root surface, especially concentrated on the crest area, in model 1. Similar profile of stress distribu-. VMS profile showed the peak VMS value in internal por-. tion was observed in root dentin near to bone crest under. tion of PDL at the opposing side to the direction of non-. axial loading in bone reduction models 2 and 3, showing. axial loadings in which the stress value increased to 5–6. VMS profile separated between superior and inferior to the. times, compared to axial loading (Fig. 7A, 8).. bone crest level, and extensive stress concentration distrib-. The peak VMS in PDL component at buccal and lingual. uted on the buccal- apical region in the model 4 with 1/3. bone crest under axial loading was 0.08, 7.06, 11.7, and. bone support.. 14.8 MPa in 4 models respectively, and increased with. Under non-axial loading, the peak VMS increased in all. increasing bone loss. Under all loadings, peak VMS stress. models, compared to axial loading. The highest peak VMS. levels increased in PDL, both at bone crest and at root apex. in models 1 and 2 was observed on the lingual cusp incline. both with bone reduction with much lower peak VMS in. of load application under WL load and the relatively lower. apical than crestal PDL. Under non-axial loadings, maxi-. peak VMS at buccal or lingual cervical area under the axial. mum VMS increased approximately 4–9 times in the inter-. and BB loads. However, models 3 and 4 with more than. nal portion of crestal PDL in 4 models respectively, near to. 1/2 bone loss showed increased peak stress along the root. buccal bone crest under BB load and near to lingual bone. surface near to bone crest, at buccal or lingual depending. crest under WL load. In apical PDL portion, peak VMS values was 1.2–2 MPa in. on the loading and the supporting bone levels. In model 4,. models 1 and 2, and 3.2–8.8 MPa in models 3 and 4, showing 3–5 times increased intensity in severe bone reduction. Peak VMS (MPa) on dentin component. intense VMS (5–7 times to model 1 value) concentrated and extended to the apex (Fig. 6). Stresses on root surface at. 140. Max dentin B crestal L crestal Apex. 120 100 80 60 40 20 0 Vertical. B lateral. WL Vertical B lateral lateral. No bone loss. 318. www.chosunobr.org. WL Vertical B lateral lateral. 1/3 bone loss. WL Vertical B lateral lateral. 1/2 bone loss. WL lateral. 2/3 bone loss. Fig. 6. Comparison of peak von Mises stress (VMS) values in root dentin region near bone crest in 4 models under vertical and 2 non-axial (B, WL) loadings. Max., maximum; B, buccal; L, lingual in legend; WL, simulating working contact on inner incline of lingual cusp under non-axial loads..
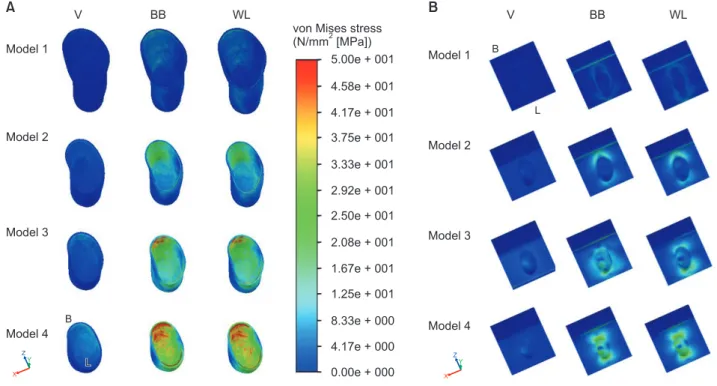
(7) Sun-Mi Yang and Hyun-Ju Chung. A. V. BB. B. WL von Mises stress (N/mm [MPa]) 5.00e + 001. Model 1. V. BB. WL. B. Model 1. 4.58e + 001 L. 4.17e + 001 Model 2. 3.75e + 001. Model 2. 3.33e + 001 2.92e + 001 2.50e + 001 Model 3. 2.08e + 001. Model 3. 1.67e + 001 1.25e + 001 B. 8.33e + 000. Model 4. Model 4. 4.17e + 000. Z Y. L. Z Y. 0.00e + 000. X. X. Peak VMS (MPa) in PDL component. Fig. 7. von Mises stress profile in periodontal ligament (A) and alveolar bone components (B) from the frontal view in 4 models under axial (V) and 2 non-axial (BB, WL) loadings. V, under axial load; BB, simulating balancing contact on inner incline of buccal cusp; WL, simulating working contact on inner incline of lingual cusp under non-axial loads; B, buccal; L, lingual.. 120. Max PDL B crestal L crestal Apex. 100 80 60 40 20 0 Vertical. B lateral. WL Vertical B lateral lateral. No bone loss. WL Vertical B lateral lateral. 1/3 bone loss. WL Vertical B lateral lateral. 1/2 bone loss. models (≥50%) (Fig. 8).. WL lateral. 2/3 bone loss. Fig. 8. Comparison of peak von Mises stress (VMS) values in periodontal ligament component according to the supporting bone levels in 4 models under vertical and 2 non-axial (B, WL) loadings. PDL, periodontal ligament; Max., maximum; B, buccal; L, lingual in legend; WL, simulating working contact on inner incline of lingual cusp under non-axial loads.. loadings, much greater than the peak apical VMS under axial loading. The peak stress values in bone was ranged. The stress profile in alveolar bone component. between 1/10 and 1/2 of the corresponding values on PDL component at crest, whereas around root apex the VMS. The profile of peak VMS distribution in bone was very. values were similar between bone and PDL component.. similar to the profiles in PDL at both crestal and apical area. Non-axial loading resulted in 6–10 times higher peak. (Fig. 7B). Peak VMS concentration was observed in apical. VMS at alveolar bone crest in all models, compared to. bone to axial loading and in crestal bone to the non-axial. axial loading. In the stress profile of alveolar bone crest,. 319.
(8) Peak VMS (MPa) in bone component. FE analysis in a lower premolar with reduced bone. 120. Max bone B crestal L crestal Apex. 100 80 60 40 20 0 Vertical. B lateral. WL Vertical B lateral lateral. No bone loss. WL Vertical B lateral lateral. 1/3 bone loss. WL Vertical B lateral lateral. 1/2 bone loss. WL lateral. 2/3 bone loss. Fig. 9. Comparison of peak von Mises stress (VMS) values in bone component according to the bone levels in 4 models under vertical and 2 non-axial (B, WL) loadings. Max., maximum; B, buccal; L, lingual in legend; WL, simulating working contact on inner incline of lingual cusp under non-axial loads.. peak VMS in model 3 and 4 increased to 3–5 times to axial. According to the FEA result using central incisor model. loading and increased to 2–13 times to non-axial load-. by Reinhardt et al. [15], the mean maximum principal. ings, compared to the model 1. In stress profile of apical. PDL stress at the alveolar crest was approximately 3 times. bone, peak VMS in models 3 and 4 with severe bone loss. greater in model with 60 percent bone loss, suggesting. increased to 1.5–2 times under axial loading and increased. that 1/3 magnitude of the occlusal load could generate the. to 1.2–1.5 times and to 2–5 times respectively under non-. stress necessary to initiate the lesion of secondary occlusal. axial loads, compared to model 1 (Fig. 9).. trauma with 60 percent bone loss, as compared to the lesion of primary occlusal trauma with normal bone height.. DISCUSSION. Other 3D FEA further demonstrated that traumatic occlusal contact generated stress is harmful to the periodontal tis-. Secondary occlusal trauma occurs in a tooth with a re-. sue integrity [19]. PDL as the most formative tissue has its. duced height of the periodontal attachment [26] and the. important role in healing and regeneration of periodontium. force itself may not necessarily be abnormal but excessive. after therapy. Reducing the stresses in the PDL may provide. for the weakened periodontium. As the biologic reactions. a better condition for this tissue component to maintain its. of the PDL, the tooth tends to tilt in the direction of the. regenerative and physiologic functions without trauma.. applied tipping forces, by the orchestrated reactions of the. As for NCCLs, it was shown in simulated FE model that. PDL tissues by the creation of compressive and tensile stress. that stresses were concentrated at the CEJ in all axial and. zones within the cervical and apical parts of the attach-. non-axial loadings, and lateral loading produced maxi-. ment apparatus [27]. The forces caused by occlusal trauma. mum stresses greater than axial loading [11,12,18,25]. The. could decrease perfusion of the PDL resulting in ischemia. oblique loading created a greater bending moment and. and necrosis of the PDL cells when the adaptive capacity of. flexure of the tooth and the resulting bending moment to. the PDL is exceeded [28]. Hence, the stress could affect the. the tooth depends on the direction of the force and the fac-. integrity of periodontal structures and the occlusal trauma. tors, such as the ratio between the extra- and intra-alveolar. might be a catalyst for the destructive processes initiated by. arm (representing the clinical crown length and the bone. bacterial inflammation [29,30]. Clinical evidences support-. level surrounding the root) [12]. Recent systemic review [34]. ing the abnormal occlusal contacts and secondary occlusal. found the majority of studies reported an association be-. trauma, as a risk factor in periodontitis progression and. tween occlusal stress and NCCLs. There are abundant stud-. tooth longevity eventually were found in a series of retro-. ies for mechanism of NCCLs using lower premolar model. spective studies by Harrel and Nunn’s studies [30,31] and. [24,35-39]. However, the profile of stress distribution in. others [32,33].. lower premolars and their periodontium as effector tissue. 320. www.chosunobr.org.
(9) Sun-Mi Yang and Hyun-Ju Chung. of occlusal trauma was rarely reported.. in normal bone height under axial load. Under non-axial. Our concern was to evaluate the effect of secondary oc-. loading, the peak VMS increased to ×2, ×5, and ×2 value. clusal trauma in periodontal tissue as well as the cervical. at buccal cervical, lingual cervical, and apical dentin of the. lesions in tooth, under non-axial loading combined with. stress under axial loading. The highest peak VMS was ob-. reduced bone support. Therefore, this study investigated. served on the lingual cusp incline of load application under. the stress profile in tooth and its periodontium of a lower. WL load (imitating working interference) and the relatively. 2nd premolar under 90 N of axial or non-axial loading. lower peak VMS at buccal or lingual cervical area under. condition according to the variation of bone support.. the axial and BB loads (imitating balancing interference). In. As for the magnitude of applied force, the average maxi-. root apex, peak VMS values was relatively low (1–2 MPa) in. mum biting force of a second premolar was estimated as. normal bone model 1, and increased twice under non-axial. 291 N during bilateral clenching [40]. The intensity of sim-. loadings.. ulated loading force was set to 90 N, considering the aver-. Concerning the stress distribution in tooth with the re-. age chewing force as 36%–40% [41,42] of the maximum. duced periodontal support, the reduction of periodontal. biting force. It was shown that increased loading did not. support shifted the location of highest stress away along. cause changes in the overall pattern of stress distribution,. the root surface apically from the CEJ and was located just. but amplified its intensity [11].. above the bucco-alveolar crest. The peak VMS at the CEJ. For the purpose of presenting the action of functional. was not changed substantially regardless of periodontal. axial loading (V), occlusal contacts were simulated on re-. support and varied according to the loading condition simi-. gions that imitate teeth contacts at the buccal cusp tip in. lar to others [17]. However, the peak VMS on root area in-. central occlusion on lower 2nd premolar. In addition, 2. creased substantially and concentrated on the root surface. paraxial loadings were simulated on the internal inclines. at bone crest level, and the distribution was more extensive. of lingual and buccal cusp, at 45° buccal and lingual to the. with reduced periodontal support, under both axial and. long axis for working (WL) or balancing interference (BB).. non-axial loading conditions, showing variation depending. These loading conditions were based on the results de-. on the loading condition. The influence of reduced peri-. scribed in Palamara et al. [38] and Rees [25]. In the latter. odontal support was prominent by ×2 and ×3 increase of. study, BB loading and WL loading resulted in higher peak. peak dentin stress in models 3 and 4 and this area of stress. maximum principal stress at cervical enamel than on the. concentration increased in size and magnitude and the. buccal incline load for working.. center of peak VMS moved apically on the dentinal root. In our result, peak VMS values in cervical enamel were. periphery with bone reduction. The stress distribution on. 32 and 22.6 MPa at buccal CEJ and 19.2 and 47.9 MPa at. the lingual root dentin also increased in size, magnitude,. lingual CEJ under BB and WL loadings respectively, above. and shifted apically as bone levels decreased, as previous. the known failure stress level for enamel (10–24 MPa [43]). reports in upper central incisor FE model [15] and upper. Our study with normal bone model under non-axial load-. premolar photoelastic models [17].. ings showed VMS level increased 2.5 times (14.4 vs. 32.3. At apical root dentin, the peak VMS level related to model. MPa) in enamel region at the buccal cervical tooth area,. 1 increased dramatically to 6.9 times under axial loading,. compared to the axial load. For the normal bone model,. and increased to 6.7–10 times under 2 non-axial load-. some localization of stress was observed around the CEJ,. ings in model 4. The peak VMS at root dentin near buccal. whereas this stress localization became less evident and the. and lingual bone crest in model 3 and 4 with 50%–67% of. peak VMS intensity did not increase for the periodontally. bone loss increased dramatically, reaching and exceeding. reduced models.. the tensile strength of dentin of 103–105 MPs [43] or lower. In dentin component, peak VMS of 10 MPa was shown. strength of dentin near to pulp (35–62 MPa [44]). Especially. along the buccal root surface, especially concentrated near. in model 4, peak dentinal VMS on was found root dentin. to the crest, and very low values at lingual and apical dentin. near to lingual bone crest, differently to 3 other models. 321.
(10) FE analysis in a lower premolar with reduced bone. with peak VMS near to buccal crest. This suggests that the. the peak VMS was 0.08 and 18.7 MPa in buccal crestal PDL,. progression of lingual cervical lesion near bone crest is pos-. 0.97 and 19.6 MPa in lingual crestal PDL and 1.73 and 1.29. sible in severe bone reduction model (corresponding to 67%. MPa in apical PDL in model 1 under axial and non-axial. bone loss) as well as buccal cervical lesion, independent. loading, respectively. This suggests that PDL could be dam-. to the loading direction. If pre-existing lesions are narrow. aged under non-axial loadings in normal bone with pro-. and angular at the CEJ, and some extend broadly into the. duced stress exceeding the reported tensile strength of PDL. root region or if the process of abfraction were to begin in. (2.4 MPa; [47]). With gradual bone loss, peak VMS under. dentine above the bone crest level, it could quickly spread. axial loading increased to ×88–185 at buccal crest in bone. to involve the adjacent tooth substance, producing the sub-. reduction models and increased 3 times at lingual crest. gingival lesions that are sometimes seen clinically. In addi-. in model 4 only, compared to model 1. Under non-axial. tion, existing cervical- root lesions are more likely to occur. loadings, peak VMS increased to ×3.3, ×5 at buccal crest. in teeth with compromised periodontal tissue. Different. and to ×4.5, ×9 at lingual crest in modes 3 and 4 respec-. distortions in the tooth structure may also occur besides. tively. In apical PDL, the peak VMS increased 3 times and. simple cantilever bending, especially in periodontally com-. 2 times in models 3 and 4 under axial loading respectively,. promised or crowded teeth [39]. The abfractions are less. and increased to 5–7 times in models 3 and 4 both under. likely to occur on a tooth with diminished periodontal sup-. non-axial loadings. Compared to the PDL stress under. port, and if does occur, must be more apically located [45].. axial loading, the intensity rise under non-axial loadings. Our study showed that with decreasing periodontal sup-. increased approximately to ×5, ×35, and ×2 at PDL near. port the location of the highest stress concentration tended. to buccal and lingual crest, and at apex respectively, in all. to shift away from CEJ which is supposed to be susceptible. bone reduction models. Especially the model 3 showed. to abfraction at root (not CEJ), toward the apical dentin. peak VMS concentration was always shown at buccal crest. region. This situation has been frequently found clinically.. under axial and non-axial loads, differently to models 2. The rate of gingival recession and the lack of tooth mobility. and 4 showing the peak VMS on lingual crestal PDL under. could constitute predisposing factors for the progression of. WL loading. Under non-axial loadings the PDL stress values. cervical defect because the exposed root surfaces could be. at buccal and lingual bone crest exceeded the PDL tensile. more susceptible to abrasion and/or erosion, and the non-. strength in all bone reduction models. PDL stress near to. mobile teeth resisting strongly against frictional forces, thus. buccal crest increased with bone reduction and exceeded. abrasive effects, could possibly develop cervical wear [45].. the PDL strength under axial loading, whereas the values. Whether the firmness of the tooth in the socket creates a. at apex were lower in models normal bone and 1/3 bone. fulcrum, which favors stress accumulation causing abfrac-. loss. This finding indicates that PDL undergoes damage. tive effects at the tooth cervix has to be investigated. Any. at buccal and lingual crest under non-axial loading in all. type of stress (tensile, compressive, or shearing), in suffi-. models regardless of bone height, and could be traumatized. cient magnitude, can inflict damage on the tooth structure.. at buccal crest in models with bone reduction even under. Tooth flexure has been described as a lateral or axial bend-. axial loading. In addition, apical PDL could dissipate the. ing under occlusal loading, tooth flexure produces tensile. stress very well with the normal bone model 1 and model 2,. or compressive strains in cervical region, causing a disrup-. although this stress values in models 3 and 4 with 1/2 and. tion of the bonds between hydroxyapatite crystals leading. 3/2 bone loss was still higher than tensile strength of PDL. to crack formation in the enamel, and the eventual loss of. of 2.4 MPa [47] or 6.82 MPa [48]. This finding also seems to. enamel and underlying dentin [46].. be related with the apical shifting of rotation center as seen. The peak VMS in PDL to the root in normal bone model. the similar pattern in dentin stress distribution. Similarly to. could be calculated to be 2/3–1/2 of the stress, which is. our result, a recent FEA demonstrated that with the weak-. likely due to the much lower value of Young’s modulus for. ened periodontal support or more appropriately secondary. the PDL than for dentin or bone [15]. In PDL component,. occlusal trauma, the stresses in tooth and the supporting. 322. www.chosunobr.org.
(11) Sun-Mi Yang and Hyun-Ju Chung. tissue increased dramatically for the models with more than. lower premolar which is known to susceptible to occlusal. 50% bone reduction [49].. trauma, to our best knowledges. FEA can predict the overall. The peak VMS in bone component with normal bone. behavior of the tooth and bone supportive structures under. height was 0.59 MPa in buccal crest, 0.91 MPa in lingual. different loading conditions, improving the understand-. crest and 2.97 MPa in apical region under axial loading, and. ing of biomechanical behavior that cannot be observed. increased 10 times and 7 times in buccal and lingual crest. clinically. However, the results should be interpreted with. under non-axial loading respectively. The peak VMS under. caution due to its limitations as it is unable to precisely. axial loading increased to ×5 at buccal crest and to ×3.5. simulate the dynamic biomechanical phenomena that are. and ×2.5 at lingual crest in models 3 and 4, and increased. associated with teeth and their support structures. More-. to ×5 in buccal crest and to ×9 in lingual crest in model. over, the employed loadings were static, while in a clinical. 4, under non-axial loadings, related to model 1. The peak. condition, the movements are dynamic, cyclic and as-. VMS in apical bone under axial loading increased to ×1.6. sume various positions. Other limitation of this FEA is that. and ×2, and under non-axial loadings increased to ×1.5. the materials from the different structures were assumed. and ×5 in models 3 and 4. Compared to axial loading, the. to have homogenous, isotropic, linear elastic properties,. intensity rise under BB and WL loadings increased approxi-. due to practicability of the analysis, although it was sug-. mately to ×10–16 at buccal and lingual bone crest in bone. gested that the finite element model of prismatic enamel. reduction models. In the alveolar bone under paraxial load,. should be constructed in consideration of the differences in. the highest stress of 49 MPa was registered along the buc-. enamel composition or prism orientation [52,53]. Besides,. cal crest of the tooth socket in the severe bone loss model,. it was demonstrated that each component of dentin, bone. almost 16 times higher than the magnitude under axial load. and PDL also is not homogenous and has different property. whose values equal to 3 MPa. However, the resulting bone. according to the anatomic location [53-56]. More precisely. stress at buccal and lingual bone crest was still lower than. planned experiment is necessary for this issue, considering. the reported yield bone strength of 120–167 MPa [43] that. anisotropic characteristic of enamel on CEJ region and pulp. might cause detrimental effects on human tooth structure. property. Further studies might be useful in clarifying the. or periodontium. If the force of loading doubled, the bone. influence of fatigue loading during repetitive cyclic occlusal. might be damaged. This result clearly presents the mode. loadings on risk of damage to the tooth and periodontal. of transmission eccentric occlusal forces onto surround-. structures during function. Future study is also required to. ing alveolar bone structures, as well as their role in the. find such a maximum tolerable stress to enable these kinds. possible bone resorption, commented in previous reports. of studies to determine the approximate or the exact limit. [24,50]. However, the stresses cannot be ignored, because. of the occurrence of the unwanted events, while under. repetitive fatigue loadings can potentially ‘accumulate’. load.. the stress, causing cracking of tooth substances [25] or re-. This study demonstrated the association between occlu-. sorption or degeneration of the bone [51]. In spite of not. sal stress and NCCL, especially progression of root dentin. having a maximum bearable stress levels for living tissues. lesion, and between eccentric loading and trauma of PDL in. to continue normal biologic activities (maximum tolerable. the presence if reduced bone height. In all models, the axial. stress), stress increases might be so high depending on the. loading (V) resulted in lower peak VMS values and smaller. direction and magnitude of occlusal loadings that they can. extent of stress distribution in tooth and periodontal tissues. be considered out of the range of tolerable stresses in our. regardless of supporting levels.. result.. Under non-axial loading, peak VMS stress values in-. This is the first report to demonstrate the stress profile. creased prominently and the area of stress distribution. and distribution generated by occlusal load as dissipated. became more extensive and shifted apically with the de-. in root dentin and surrounding periodontal tissues, associ-. creasing bone support. Loading direction made significant. ated with reduced bone support in a 3D environment of. difference on the stress distribution pattern and intensity.. 323.
(12) FE analysis in a lower premolar with reduced bone. From a mechanical perspective, for mobile tooth with weakened periodontium, occlusal diagnosis and subsequent re-adjustments of tooth contacts do provide patient comfort and relative stability of dentition and each tooth component.. ACKNOWLEDGEMENTS The authors would like to thank to Dr. Hong-So Yang, professor of School of Dentistry, Chonnam National University, Gwangju, Korea, for his integral role in the fabrication of the finite element models. This study was financially supported by Chonnam National University (Grant Number: 2015-2651).. CONFLICTS OF INTEREST The authors declare that they have no competing interests.. ORCID Sun-Mi Yang https://orcid.org/0000-0002-9802-0282 Hyun-Ju Chung https://orcid.org/0000-0001-8461-5093. REFERENCES 1. Khan F, Young WG, Shahabi S, Daley TJ. Dental cervical lesions associated with occlusal erosion and attrition. Aust Dent J 1999;44:176-186. doi: 10.1111/j.1834-7819.1999. tb00219.x. 2. Piotrowski BT, Gillette WB, Hancock EB. Examining the prevalence and characteristics of abfractionlike cervical lesions in a population of U.S. veterans. J Am Dent Assoc 2001;132:1694-1701; quiz 1726-7. doi: 10.14219/jada. archive.2001.0122. 3. Aw TC, Lepe X, Johnson GH, Mancl L. Characteristics of noncarious cervical lesions: a clinical investigation. J Am Dent Assoc 2002;133:725-733. doi: 10.14219/jada.archive.2002.0268. 4. Borcic J, Anic I, Urek MM, Ferreri S. The prevalence of non-carious cervical lesions in permanent dentition. J Oral Rehabil 2004;31:117-123. doi: 10.1046/j.0305182x.2003.01223.x.. 324. www.chosunobr.org. 5. Jakupovic S, Vukovic A, Korac S, Tahmiscija I, Bajsman A. The prevalence, distribution and expression of noncarious cervical lesions (NCCL) in permanent dentition. Mater Sociomed 2010;22:200-204. 6. Yoshizaki KT, Francisconi-Dos-Rios LF, Sobral MA, Aranha AC, Mendes FM, Scaramucci T. Clinical features and factors associated with non-carious cervical lesions and dentin hypersensitivity. J Oral Rehabil 2017;44:112-118. doi: 10.1111/joor.12469. 7. Que K, Guo B, Jia Z, Chen Z, Yang J, Gao P. A cross-sectional study: non-carious cervical lesions, cervical dentine hypersensitivity and related risk factors. J Oral Rehabil 2013;40:24-32. doi: 10.1111/j.1365-2842.2012.02342.x. 8. Madani AO, Ahmadian-Yazdi A. An investigation into the relationship between noncarious cervical lesions and premature contacts. Cranio 2005;23:10-15. doi: 10.1179/ crn.2005.003. 9. Paulander J, Axelsson P, Lindhe J, Wennström J. Intra-oral pattern of tooth and periodontal bone loss between the age of 50 and 60 years. A longitudinal prospective study. Acta Odontol Scand 2004;62:214-222. 10. Paulander J, Wennström JL, Axelsson P, Lindhe J. Some risk factors for periodontal bone loss in 50-year-old individuals. A 10-year cohort study. J Clin Periodontol 2004;31:489496. doi: 10.1111/j.1600-051X.2004.00514.x. 11. Borcic J, Anic I, Smojver I, Catic A, Miletic I, Ribaric SP. 3D finite element model and cervical lesion formation in normal occlusion and in malocclusion. J Oral Rehabil 2005;32:504-510. 12. Ichim I, Schmidlin PR, Kieser JA, Swain MV. Mechanical evaluation of cervical glass-ionomer restorations: 3D finite element study. J Dent 2007;35:28-35. doi: 10.1016/ j.jdent.2006.04.003. 13. Jakupović S, Anić I, Ajanović M, Korać S, Konjhodžić A, Džanković A, Vuković A. Biomechanics of cervical tooth region and noncarious cervical lesions of different morphology; three-dimensional finite element analysis. Eur J Dent 2016;10:413-418. doi: 10.4103/1305-7456.184166. 14. Reinhardt RA, Krejci RF, Pao YC, Stannard JG. Dentin stresses in post-reconstructed teeth with diminishing bone support. J Dent Res 1983;62:1002-1008. 15. Reinhardt RA, Pao YC, Krejci RF. Periodontal ligament stresses in the initiation of occlusal traumatism. J Periodontal Res 1984;19:238-246. doi: 10.1111/j.1600-0765.1984. tb00815.x. 16. Kuroe T, Caputo AA, Ohata N, Itoh H. Biomechanical effects of cervical lesions and restoration on periodontally compromised teeth. Quintessence Int 2001;32:111-118. 17. Kuroe T, Itoh H, Caputo AA, Nakahara H. Potential for load-induced cervical stress concentration as a function of periodontal support. J Esthet Dent 1999;11:215-222. doi: 10.1111/j.1708-8240.1999.tb00401.x. 18. Guimar ã es JC, Guimar ã es Soella G, Brand ã o Du-.
(13) Sun-Mi Yang and Hyun-Ju Chung rand L, Horn F, Narciso Baratieri L, Monteiro S Jr, Belli R. Stress amplifications in dental non-carious cervical lesions. J Biomech 2014;47:410-416. doi: 10.1016/ j.jbiomech.2013.11.012. 19. Poiate IA, de Vasconcellos AB, de Santana RB, Poiate E. Three-dimensional stress distribution in the human periodontal ligament in masticatory, parafunctional, and trauma loads: finite element analysis. J Periodontol 2009;80:18591867. doi: 10.1902/jop.2009.090220. 20. Magne P. Efficient 3D finite element analysis of dental restorative procedures using micro-CT data. Dent Mater 2007;23:539-548. doi: 10.1016/j.dental.2006.03.013. 21. Zarone F, Sorrentino R, Apicella D, Valentino B, Ferrari M, Aversa R, Apicella A. Evaluation of the biomechanical behavior of maxillary central incisors restored by means of endocrowns compared to a natural tooth: a 3D static linear finite elements analysis. Dent Mater 2006;22:1035-1044. doi: 10.1016/j.dental.2005.11.034. 22. Farah JW, Craig RG, Meroueh KA. Finite element analysis of three- and four-unit bridges. J Oral Rehabil 1989;16:603611. 23. Geng JP, Tan KB, Liu GR. Application of finite element analysis in implant dentistry: a review of the literature. J Prosthet Dent 2001;85:585-598. doi: 10.1067/ mpr.2001.115251. 24. Jakupovic S, Cerjakovic E, Topcic A, Ajanovic M, Prcic AK, Vukovic A. Analysis of the abfraction lesions formation mechanism by the finite element method. Acta Inform Med 2014;22:241-245. doi: 10.5455/aim.2014.22.241-245. 25. Rees JS. The effect of variation in occlusal loading on the development of abfraction lesions: a finite element study. J Oral Rehabil 2002;29:188-193. doi: 10.1046/j.13652842.2002.00836.x. 26. Lindhe J. Ericsson I.Trauma from occlusion: periodontal tissues. In: Lang NP, Lindhe J, editors. Clinical periodontology and implant dentistry. 6th ed. West Sussex: Wiley Blackwell; 2015. p. 313-324. 27. Picton DC. On the part played by the socket in tooth support. Arch Oral Biol 1965;10:945-955. doi: 10.1016/00039969(65)90088-9. 28. Serio FG, Hawley CE. Periodontal trauma and mobility. Diagnosis and treatment planning. Dent Clin North Am 1999;43:37-44. 29. Davies SJ, Gray RJ, Linden GJ, James JA. Occlusal considerations in periodontics. Br Dent J 2001;191:597-604. doi: 10.1038/sj.bdj.4801245. 30. Harrel SK, Nunn ME. The effect of occlusal discrepancies on periodontitis. II. Relationship of occlusal treatment to the progression of periodontal disease. J Periodontol 2001;72:495-505. doi: 10.1902/jop.2001.72.4.495. 31. Harrel SK, Nunn ME. The association of occlusal contacts with the presence of increased periodontal probing depth. J Clin Periodontol 2009;36:1035-1042. doi: 10.1111/. j.1600-051X.2009.01486.x. 32. Bernhardt O, Gesch D, Look JO, Hodges JS, Schwahn C, Mack F, Kocher T. The influence of dynamic occlusal interferences on probing depth and attachment level: results of the Study of Health in Pomerania (SHIP). J Periodontol 2006;77:506-516. doi: 10.1902/jop.2006.050167. 33. Branschofsky M, Beikler T, Schäfer R, Flemming TF, Lang H. Secondary trauma from occlusion and periodontitis. Quintessence Int 2011;42:515-522. 34. Duangthip D, Man A, Poon PH, Lo ECM, Chu CH. Occlusal stress is involved in the formation of non-carious cervical lesions. A systematic review of abfraction. Am J Dent 2017;30:212-220. 35. Spears IR, van Noort R, Crompton RH, Cardew GE, Howard IC. The effects of enamel anisotropy on the distribution of stress in a tooth. J Dent Res 1993;72:1526-1531. 36. Rees JS. The role of cuspal flexure in the development of abfraction lesions: a finite element study. Eur J Oral Sci 1998;106:1028-1032. doi: 10.1046/j.0909-8836.1998. eos106608.x. 37. Rees JS. An investigation into the importance of the periodontal ligament and alveolar bone as supporting structures in finite element studies. J Oral Rehabil 2001;28:425432. doi: 10.1046/j.1365-2842.2001.00686.x. 38. Palamara D, Palamara JE, Tyas MJ, Messer HH. Strain patterns in cervical enamel of teeth subjected to occlusal loading. Dent Mater 2000;16:412-419. doi: 10.1016/s01095641(00)00036-1. 39. Palamara JE, Palamara D, Messer HH, Tyas MJ. Tooth morphology and characteristics of non-carious cervical lesions. J Dent 2006;34:185-194. doi: 10.1016/j.jdent.2005.05.005. 40. Ferrario VF, Sforza C, Serrao G, Dellavia C, Tartaglia GM. Single tooth bite forces in healthy young adults. J Oral Rehabil 2004;31:18-22. doi: 10.1046/j.0305182x.2003.01179.x. 41. Gibbs CH, Mahan PE, Lundeen HC, Brehnan K, Walsh EK, Holbrook WB. Occlusal forces during chewing and swallowing as measured by sound transmission. J Prosthet Dent 1981;46:443-449. doi: 10.1016/0022-3913(81)90455-8. 42. Nakamura T, Imanishi A, Kashima H, Ohyama T, Ishigaki S. Stress analysis of metal-free polymer crowns using the three-dimensional finite element method. Int J Prosthodont 2001;14:401-405. 43. Tanaka M, Naito T, Yokota M, Kohno M. Finite element analysis of the possible mechanism of cervical lesion formation by occlusal force. J Oral Rehabil 2003;30:60-67. doi: 10.1046/j.1365-2842.2003.00959.x. 44. Giannini M, Soares CJ, de Carvalho RM. Ultimate tensile strength of tooth structures. Dent Mater 2004;20:322-339. doi: 10.1016/S0109-5641(03)00110-6. 45. Pikdöken L, Akca E, Gürbüzer B, Aydil B, Taşdelen B. Cervical wear and occlusal wear from a periodontal perspective. J Oral Rehabil 2011;38:95-100. doi: 10.1111/j.1365-. 325.
(14) FE analysis in a lower premolar with reduced bone 2842.2010.02137.x. 46. Reddy K, Reddy S, Rao B, Kshitish D, Mannem S. Cervical stress due to normal occlusal loads is a cause for abfraction? - A finite element model study. J Orofac Sci 2012;4:120-123. doi: 10.4103/0975-8844.106204. 47. Ralph WJ. Tensile behaviour of the periodontal ligament. J Periodontal Res 1982;17:423-426. doi: 10.1111/j.16000765.1982.tb01172.x. 48. Wu B, Fu Y, Shi H, Yan B, Lu R, Ma S, Markert B. Tensile testing of the mechanical behavior of the human periodontal ligament. Biomed Eng Online 2018;17:172. doi: 10.1186/s12938-018-0607-0. 49. Vandana KL, Deepti M, Shaimaa M, Naveen K, Rajendra D. A finite element study to determine the occurrence of abfraction and displacement due to various occlusal forces and with different alveolar bone height. J Indian Soc Periodontol 2016;20:12-16. doi: 10.4103/0972-124X.168484. 50. Geramy A, Sharafoddin F. Abfraction: 3D analysis by means of the finite element method. Quintessence Int 2003;34:526-533. 51. Jepsen KJ, Davy DT. Comparison of damage accumulation. 326. www.chosunobr.org. measures in human cortical bone. J Biomech 1997;30:891894. doi: 10.1016/s0021-9290(97)00036-5. 52. Spears IR. A three-dimensional finite element model of prismatic enamel: a re-appraisal of the data on the Young's modulus of enamel. J Dent Res 1997;76:1690-1697. 53. Xu HH, Smith DT, Jahanmir S, Romberg E, Kelly JR, Thompson VP, Rekow ED. Indentation damage and mechanical properties of human enamel and dentin. J Dent Res 1998;77:472-480. 54. Konishi N, Watanabe LG, Hilton JF, Marshall GW, Marshall SJ, Staninec M. Dentin shear strength: effect of distance from the pulp. Dent Mater 2002;18:516-520. doi: 10.1016/ s0109-5641(01)00077-x. 55. Uhlir R, Mayo V, Lin PH, Chen S, Lee YT, Hershey G, Lin FC, Ko CC. Biomechanical characterization of the periodontal ligament: orthodontic tooth movement. Angle Orthod 2017;87:183-192. doi: 10.2319/092615-651.1. 56. Rho JY, Kuhn-Spearing L, Zioupos P. Mechanical properties and the hierarchical structure of bone. Med Eng Phys 1998;20:92-102. doi: 10.1016/s1350-4533(98)00007-1..
(15)
수치

+2
관련 문서
12 As such, using finite element modeling, the effect of stress distribution around the internal non-submerged type implants on marginal bone resorption
It is possible to control the welding residual stress and deformation through the finite element analysis using jig free in-situ control technique of welding induced out
In this study, we fabricated the three-dimentional (3D) polycaprolactone (PCL) scaffolds via bio-extruder equipment and then treated surface modification of
A A A A Study Study Study Study Analysis Analysis Analysis Analysis of of of of the the the the J. Bach, a representative composer in Baroque period. Composed
In order to simulate a thermo-mechanical behavior in the vicinity of the deposited region by a LENS process, a finite element (FE) model with a moving heat flux is developed
Evaluating parameters of osseointegrated dental implants using finite element analysis-a two- dimentional comparative study examining the effects of implant
The optimized STL files of the 3D tooth models were imported into the finite element analysis software, CosmosWorks (Structural Research & Analysis
Oral Health Educational Diagnosis of Dental Hygienist
