Veterinary Science
http://dx.doi.org/10.4142/jvs.2011.12.4.325
Received: 15 Oct. 2010, Revised: 21 Feb. 2011, Accepted: 11 Apr. 2011
Original Article
*Corresponding author
Tel: +90-362-3121919 (Ext. 3908); Fax: +90-362-4576922 E-mail: [email protected]
Evaluation of IGF-I levels and serum protein profiles of diabetic cats and dogs
Gulay Ciftci*, Gul Fatma Yarim
Department of Biochemistry, Faculty of Veterinary Medicine, University of Ondokuz Mayis, 55139 Samsun, Turkey
In this study, we measured the insulin-like growth factor (IGF)-I levels and evaluated the serum protein profiles of diabetic, insulin-treated, and healthy cats and dogs. The total IGF-I concentrations were 33.74 ± 3.4 ng/mL for normal, 25.8 ± 4.5 ng/mL for diabetic, and 180.4 ± 31.4 ng/mL for insulin-treated cats. IGF-I concentrations were 46.4 ± 6.6 ng/mL for normal, 25.1 ± 4.1 ng/mL for diabetic, and 303.0 ± 61.3 ng/mL for insulin-treated dogs. Total serum protein profiles were analyzed by SDS-PAGE.
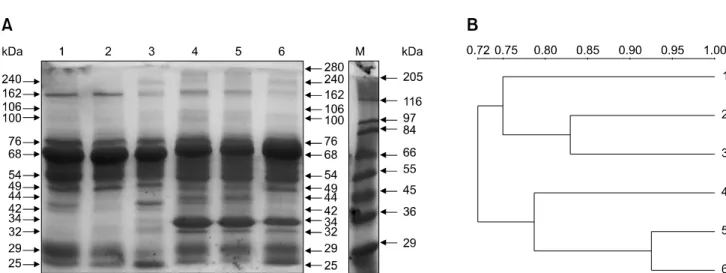
Fourteen bands ranging from 25 to 240 kDa in size were observed for cats, and 17 bands ranging from 25 to 289 kDa were observed for dogs. The densities of the bands differed among control, diabetic, and insulin-treated animals. In conclusion, we found that serum protein profiles and IGF-I concentrations were altered in both diabetic and insulin-treated animals. When judiciously interpreted in the light of other clinical and laboratory data, the techniques used in our study provide a valuable modality for measuring the severity of diabetes mellitus in dogs and cats.
Keywords: cat, diabetes mellitus, dog, IGF-I, serum protein profile
Introduction
Diabetes mellitus is one of the most common metabolic diseases in cats and dogs. This condition is characterized by increased levels of blood glucose (hyperglycemia) resulting from defects in insulin secretion, insulin action, or both [2,16]. It causes disorders in the metabolism of carbohydrates, lipids, and protein [29]. Diabetes mellitus is classified into four types; in humans, the most common are insulin dependent (type 1) and non-insulin dependent (type 2).
Type 1 diabetes is characterized by insulin secretion deficiencies and is treated with insulin injections in both
dogs and humans. In cases of type 2 diabetes, insulin is secreted but glucose metabolism is inhibited due to insulin resistance. In humans and felines, this form of diabetes is characterized by amyloid deposition in Langerhans islands. Among animals, the prevalence of the different forms of diabetes varies with species. While type 1 diabetes is usually seen in dogs, type 2 more frequently develops in cats [30,31,47]. Other types of diabetes account for a smaller ratio of cases in dogs and cats. Insulin was first described by Banting and Best in 1921 [5] as a factor responsible for glucose homeostasis. This hormone facilitates glucose entrance into the cell. Its deficiency leads to increased protein catabolism [41,44] and hyperglycemia. Insulin is an anabolic agent and an important regulator of the growth hormone (GH) and insulin-like growth factors (IGF) [7].
The two major IGF-I and -II were found to be low molecular weight polypeptide hormones [34]. IGF-I is mainly synthesized in the liver, and the secretion of IGF-I was stimulated by growth hormone [38]. This polypeptide shares many structural, functional, and metabolic similarities with insulin and proinsulin [34]. Most circulating IGF-I is bound to specific carrier proteins; only free IGF-I is biologically active. Six IGF-binding proteins (IGFBP) have been identified (IGFBP-1 to IGFBP-6), four of which are important in human serum (IGFBP-1 to IGFBP-4).
IGFBP-3 is the major binding protein for IGF-I that forms a 140 kDa complex in humans, and plays a role in glucose metabolism [23]. The active form of IGF-I binds to the IGF-I receptor, which is highly homologous to the insulin receptor, and activates a cascade of intracellular events that result in the stimulation of glucose utilization [19,27].
The effects of IGF-I have been investigated in several experimental animal studies [10,37]. IGF-I has been reported to have effects similar to those of insulin such as increasing glucose uptake, stimulation of glucose transport, glucose oxidation, and glycogen formation.
IGF-I is also known to have anabolic effects on protein
metabolism, including inhibition of whole-body protein
breakdown and stimulation of protein synthesis [17]. In
humans with untreated cases of type 1 or 2 diabetes, the levels of IGF-I have been reported to decrease [3,19].
IGFBP-3 concentrations have also been found to decrease in hyperglycemic humans [6] and rats [13,18]. The aim of the present study was to compare IGF-I levels between healthy, insulin-treated diabetic, and hyperglycemic cats and dogs. In addition, we evaluated the serum protein profiles of these animals.
Materials and Methods Samples
Seven cats (6 striped and 1 Turkish angora) with diabetes mellitus and seven cats (4 striped, 2 Turkish angora and 1 Scottish fold) with insulin-treated were used for study.
Twenty dogs (13 mongrel, 5 wolfhound, 1 Huskey and 1 Turkish kangal) with diabetes mellitus and seven dogs (4 mongrel and 3 wolfhound) with insulin-treated mellitus were also included in our study. The animals used in the study were selected from the animals which were come to the polyclinics for routine health controls or diabetes treatment. Finally, seven healthy cats (5 striped, 1 Turkish angora and 1 Turkish van) and seven healthy dogs (3 mongrel, 2 wolfhound, and 2 Turkish kangal) served as control groups. The age of all animals ranged from 4 to 16 years (median, 10 years) and average body weights ranged from 2.5 to 9.8 kg (median, 5.5 kg). The diagnosis of diabetes mellitus was determined based on clinical signs such as polyuria, polydipsia, and weight loss, and laboratory findings indicating the presence of hyperglycemia and glucosuria.
Biochemical analysis of serum
The neutral protamine Hagedorn form of insulin (Humulin-N; Eli Lilly, USA) was subcutaneously injected at a concentration of 0.4∼0.7 IU/kg for dogs and 0.25∼
0.5 IU/kg for cats with insulin-treated diabetes. Blood samples were collected 1.5 h after insulin injection from cats and dogs fasted for approximately 8 h. The samples were kept at room temperature for 15 min to allow clotting and were then centrifuged (4
oC, 1,550 × g, 10 min). The sera recovered from the samples were stored at 80
oC until use. The levels of glucose, total protein, albumin, and globulin were determined using a bench-top immunoassay auto-analyzer (Autolab; AMS Srl, The Netherlands).
Detection of insulin-like growth factor (IGF) I in serum
The concentration of IGF-I in the serum samples was analyzed by using a sandwich enzyme-linked immunoassay (ELISA) kit (E90050Ca; Uscn Life Science, China). The ELISA was performed according to manufacturer’s instructions as follows; the wells of precoated kits were determined for diluted standards, blank and samples. Each
of dilutions of standards, blank and samples were added about 100 μL to the wells and incubated for 2 h at 37
oC.
After washing step, 100 μL of Detection Reagent A working solution was added to each well and incubated for 1 h at 37
oC. The wells were washed and 100 μL of Detection Reagent B working solution was added to each well. After incubation for 30 min at 37
oC, the washing process was repeated. TMB Substrate Solution (90 μL to each well) was added and incubated for 15∼25 min at 37
oC. Then, 50 μL of Stop Solution was added to each well and measurement was conducted at 450 nm.
Sodium dodecyl sulphate-polyacrylamide gel electrophoresis (SDS-PAGE) analysis of serum proteins
SDS-PAGE was carried out on 10% polyacrylamide gels under denaturing conditions [20]. Serum samples were diluted (v/v; 1/50) with a sterile physiologic saline solution, mixed with 15.5 mmol/L Tris-HCl, 3% SDS, 10% glycerol and 0.02% bromophenol blue (pH 6.8); and heated at 100
oC for 5 min followed by gentle cooling.
Samples (20 μL) were loaded onto the stacking gel and electrophoresis was performed at a constant voltage (200 V). Following electrophoresis, the gel was stained with Blue Silver [12]. Molecular mass standards (S8445;
Sigma, USA) were run in parallel in order to calculate protein molecular weights using Molecular Imaging Software (Kodak, USA). The SDS-PAGE results were evaluated for variation of band densities as well as similarities in the number and patterns of the bands.
Dendograms (UPGMA) were created based on the Dice similarity coefficient including the genetic relatedness between groups (cats and dogs; control and diabetic cats;
control and diabetic dogs; insulin-treated cats and dogs) using CHEF-DR III and Quantity One Software (Bio-Rad Laboratories, USA).
Statistical analysis
Normal distribution of the data was determined with the Shapiro-Wilk test and while general distribution parameters of data were evaluated with descriptive statistics. To investigate statistical differences among the IGF-I, albumin, globulin, and total protein concentrations between the groups in this study, we initially performed Duncan’s multiple range test. Pearson Correlations Analysis was also used to evaluate the relationships among the traits we examined in the present study. Statistical analyses were performed with SAS, statistical package release 8.1 (SAS, USA).
Results
The concentrations of IGF-I were 25.8 ± 4.50 g/mL and
25.1 ± 4.10 ng/mL in diabetic cats and dogs, respectively.
Table 4. Correlation between serum parameters in dogs
Glucose IGF-I Albumin Total protein Globulin
Glucose 1.000 0.326 0.009 0.123 0.105
IGF-I 0.326 1.000 0.386 0.129 0.068
Albumin 0.009 0.190 1.000 0.236 0.534
Total protein 0.123 0.129 0.236 1.000 0.687
Globulin 0.105 0.068 0.534 0.687 1.000
Table 1. Results of biochemical tests for control, diabetic, and insulin-treated cats
Parameter Control Diabetic Insulin-treated F-value
IGF-I (ng/mL) 33.7 ± 3.4
a25.8 ± 4.5
a180.4 ± 31.4
b22.2
Glucose (mg/dL) 58 ± 18.8
a255 ± 52.5
b102.4 ± 5.5
a10.6
Total protein (g/dL) 6.8 ± 0.1
a6.6 ± 0.1
a6.6 ± 0.1
a0.2
Albumin (g/dL) 3.1 ± 0.09
a2.4 ± 0.1
b3.1 ± 0.1
a8.1
Globulin (g/dL) 3.6 ± 0.07
a4.2 ± 0.1
b3.5 ± 0.1
a5.7
a,bDifferent superscripts in the same row indicate significant differences (p < 0.05). IGF: insulin-like growth factor.
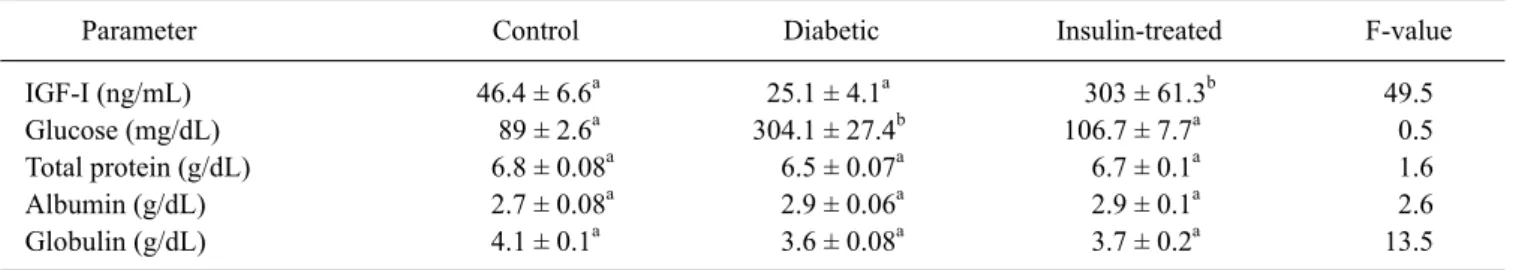
Table 2. Results of biochemical tests for control, diabetic, and insulin-treated dogs
Parameter Control Diabetic Insulin-treated F-value
IGF-I (ng/mL) 46.4 ± 6.6
a25.1 ± 4.1
a303 ± 61.3
b49.5
Glucose (mg/dL) 89 ± 2.6
a304.1 ± 27.4
b106.7 ± 7.7
a0.5
Total protein (g/dL) 6.8 ± 0.08
a6.5 ± 0.07
a6.7 ± 0.1
a1.6
Albumin (g/dL) 2.7 ± 0.08
a2.9 ± 0.06
a2.9 ± 0.1
a2.6
Globulin (g/dL) 4.1 ± 0.1
a3.6 ± 0.08
a3.7 ± 0.2
a13.5
a,bDifferent superscripts in the same row indicate significant differences (p < 0.05).