• 검색 결과가 없습니다.

Historical control data from 13-week repeatedtoxicity studies in Crj:CD (SD) rats

N/A
N/A
Protected

Academic year: 2022

Share "Historical control data from 13-week repeatedtoxicity studies in Crj:CD (SD) rats"

Copied!
7
0
0

로드 중.... (전체 텍스트 보기)

전체 글

(1)

Historical control data from 13-week repeated toxicity studies in Crj:CD (SD) rats

Jung-Min Lee

1

, Min-Ah Lee

1

, Hyeon-Nam Do

1

, Yun-Ik Song

1

, Re-Ji-Na Bae

1

, Hye-Yeong Lee

1

, Sun Hee Park

1

, Jin Seok Kang

2

*, Jong-koo Kang

3

*

1

Department of Pathology, Biotoxtech Co., Ltd, Ochang Scientific Industrial Complex, Cheongwon-gun, Korea

2

Department of Biomedical Laboratory Science, Namseoul University, Cheonan, Korea

3

Laboratory Animal Medicine, College of Veterinary Medicine, Chungbuk National University, Cheongju, Korea

Reference ranges of standard experimental parameters are useful for comparisons in toxicology. The aim of this study was to collect data from 13-week repeated toxicity studies in Crl:CD (SD) rats, a strain widely used for toxicity and efficacy research, for establishing domestic reference values. Data on body weight, food consumption; urinalysis, hematological, and blood biochemical parameters; and organ weights were collected from 11 toxicity studies in 220 Crl:CD (SD) rats (110 males and 110 females). The studies had been performed at a single testing facility over the last 5 years and involved animals sourced from a single breeder. The findings were collated as means, standard deviations, percentages, and ranges.

Urine volume, uterus weight, eosinophil, and basophil counts, and triglyceride, total bilirubin, and gamma-glutamyl transpeptidase levels showed standard deviations of 30% or more. These historical control data would help to interpret the effects of test substances in routine toxicity and efficacy studies.

Key words: Crj:CD (SD) rat, control data, reference range, toxicology

Received 2 March 2012; Revised version received 7 June 2012; Accepted 11 June 2012

The toxicity and efficacy of food additives, pharma- ceuticals, and chemicals have been interpreted on the basis of background data collected from laboratory animals. Although these data are invaluable and essential, they are affected by age, breeding environment, feeding, measurement equipment, and testing method [1,2]. The results of toxicity and efficacy studies have also been interpreted by establishing control groups. Nevertheless, such results are difficult to interpret when the control data are not consistent or when the experimental values are extremes of the control data [3]. In addition, sporadic changes unrelated to the test substance or false-positive results are common. In such cases, the toxicological significance is generally determined by checking for the

presence of a dose response, changes in related parameters, or changes in physiological ranges [4]. Background data are used to determine various physiological ranges.

Understanding such data is important because it is the first step for appropriate interpretation of treatment- related changes [1]. However, the current major animal breeders do not provide background data on standard experimental parameters. Further, the results of many studies have been interpreted on the basis of foreign background data. Reference values in the published domestic literature are scarce, and the available background data present information only of gender differences at the same age [5,6]. In addition, these data do not fully reflect the factors affecting data quality, because of http://dx.doi.org/10.5625/lar.2012.28.2.115

*Corresponding authors: Jin Seok Kang, Department of Biomedical Laboratory Science, Namseoul University, 21 Maeju-ri, Seonghwan-eup, Cheonan, Chungnam 331-707, Korea

Tel: +82-41-580-2721; Fax: +82-41-580-2932; E-mail: [email protected]

Jong-koo Kang, Laboratory Animal Medicine, College of Veterinary Medicine, Chungbuk National University, 52 Naesudong-ro (Gaesin-dong), Cheongju, Chungbuk 361-763, Korea

Tel: +82-43-261-2607; Fax: +82-43-267-2595; E-mail: [email protected]

This is an Open Access article distributed under the terms of the Creative Commons Attribution Non-Commercial License (http://creativecommons.org/licenses/

by-nc/3.0) which permits unrestricted non-commercial use, distribution, and reproduction in any medium, provided the original work is properly cited.

(2)

data from studies in rats is limited in Korea. In this study, we aimed to collect data from 13-week repeated toxicity studies in Crl:CD (SD) rats, a strain widely used for toxicity and efficacy research, for establishing domestic reference values.

Materials and Methods

Data collection

The data were gathered from 13-week repeated toxicity studies in 220 Crl:CD (SD) rats from same breeder, ages (ORIENTBIO INC., Korea). The studies had been performed in the same environment at a single testing facility (Biotoxtech Co. Ltd.) over the last 5 years and involved animals sourced from a single breeder.

Quarantine and acclimation

All animals had been quarantined and acclimated for 6–7 days, and their general health had been observed daily. Their body weights had been recorded on the day of receipt and group assignment by using an electronic balance (CP3202S, Sartorius AG, Goettingen, Germany).

On the final day of quarantine and acclimation, their body weights had been recorded again, and no abnormality in clinical signs and body weight had been noted.

Animal husbandry

The animals had been housed individually in hanging stainless-steel wire mesh cages in an animal room under the following conditions: temperature, 19–25

o

C; relative humidity, 30.0–70.0%; air ventilation, 10–15 times/h;

and illumination, 12 h (0700–1900 h). They had been fed commercial diet (Teklad Certified Irradiated Global 18% Protein Rodent Diet 2918C).

Method of administration

The animals had received injection water (JW Pharmaceutical, Korea) once daily by gastric intubation using 3-mL disposable syringes fitted with intubation tubes during the indicated dosing period.

Urinalysis

The rats had been fasted during urine collection, but drinking water was available ad libitum. Urine volume had been measured with a calibrated cylinder. Urine

Junior II, Roche Diagnostics, Basel, Switzerland).

Hematology

Blood samples had been collected from the abdominal aorta into collection tubes containing EDTA-2K. However, for determining coagulation parameters, blood samples treated with 3.2% sodium citrate water had been used.

The animals had been fasted for approximately 18 h before sampling. The following hematological tests had been performed by using an automated hematology analyzer (ADVIA 120, Siemens Healthcare Diagnostics, Tarrytown, NY, USA): erythrocyte count, hemoglobin level, hematocrit, mean corpuscular volume, mean corpuscular hemoglobin, mean corpuscular hemoglobin concentration, and platelet, leukocyte, neutrophil, lymphocyte, monocyte, eosinophil, basophil, and reticulocyte counts. Prothrombin time, activated partial thromboplastin time, and fibrinogen level had been measured with a coagulation analyzer (ACL 7000, Instrumentation Laboratory, Bedford, USA).

Blood biochemistry

After centrifugation, the following blood biochemical tests had been performed by using an automated blood chemistry analyzer (7080, Hitachi, Tokyo, Japan):

alanine aminotransferase, aspartate aminotransferase, alkaline phosphatase, gamma-glutamyl transpeptidase, blood urea nitrogen, creatinine, total bilirubin, total protein, albumin, total cholesterol, triglyceride, phosphorus, glucose, and calcium. Chloride, sodium, and potassium levels had been measured with an electrolyte analyzer (AVL 9181, Roche Diagnostics, Basel, Switzerland).

Organ weights

All animals had been sacrificed and examined macroscopically, and their organ weighed recorded of receipt and group assignment by using an electronic balance (CP3202S, Sartorius AG, Goettingen, Germany).

Results

Body weight

The male and female rats showed a body weight gain

of 298% and 203%, respectively, from week 1 to week

13 (Figure 1). The standard deviation among individuals

(3)

of the same age was within 10% of the mean body weight. Male rats tended to gain more than 10% body weight from the first to the third experimental week.

However, the body weight reached a plateau from week 4 to week 13. Female rats showed a similar trend.

Food consumption

Male rats consumed the maximum amount of food in the seventh experimental week; thereafter, food consumption reached a plateau until the end of the study. Similarly, female rats showed the maximum food consumption in the fifth week, which then remained constant until the end of the study (Figure 2). Male and Female rats consumed 26.6–33.8 and 20.7–23.9 g/day respectively.

The greatest difference between the minimum and the maximum consumption by male rats occurred in the fourth experimental week (27.1–49.6 g/day). In female rats, the widest range was 12.0–26.5 g/day in the first experimental week.

Urinalysis data

Male rats demonstrated the presence of ketone bodies, protein, and occult blood in urine, and female rats had proteinuria. The proportions of positive results in male and female rats were as follows: protein, 42 and 20%, respectively; ketone bodies, 12 and 2%, respectively;

and occult blood, 4 and 2%, respectively. In addition, the standard deviation of urine volume was over 30% of the mean value in both genders (Table 1).

Hematological data

The standard deviations of erythrocyte count, hemoglobin level, hematocrit, mean corpuscular volume, mean corpuscular hemoglobin, and mean corpuscular hemoglobin concentration were less than 10% of the mean values in both male and female rats (Table 2). For platelet and reticulocyte counts, the standard deviations were more than 10% and less than 20% of the mean values in male and female rats, respectively. Further, the standard

Figure 2. Changes in food consumption of male and female rats

Table1. Urinary parameter of male and female rats

Male Female

N Mean±SD Min Max N Mean±SD Min Max

U. Volume 25 12.9±4.9 4.4 33.5 25 7.1±4.2 1.6 22.4

Male Female

N - ± + +++ ++++ N - ± + +++ ++++

Protein (mg/dL) 50 29(58) 19(38) 2(4) 0 0 45 36(80) 9(20) 0 0 0

Glucose (mg/dL) 50 50(100) 0 0 0 0 45 45(100) 0 0 0 0

Ketone body (mg/dL) 50 44(88) 6(12) 0 0 0 45 44(98) 1(2) 0 0 0

Urobilinogen 40 40(100) 0 0 0 0 35 35(100) 0 0 0 0

Bilirubin (mg/dL) 50 50(100) 0 0 0 0 45 45(100) 0 0 0 0

Occult blood (Ery/µL) 50 48(96) 1(2) 0 1(2) 0 45 44(98) 0 0 1(2) 0

Nitrite (mg/dL) 35 35(100) 0 0 0 0 35 35(100) 0 0 0 0

Parentheses represent incidence

Figure 1. Changes in body weight of male and female rats

(4)

deviation of lymphocyte count was less than 10% of the mean value in female rats and more than 10% but less than 20% of the mean value in male rats. The standard deviations of the other differential counts were more than 30%. The standard deviation of prothrombin time was less than 10% of the mean value in both gender.

Finally, the standard deviations of activated partial thromboplastin time and fibrinogen level in male rats were more than 10% and less than 20% of the mean values.

Blood biochemical data

The alkaline phosphatase and triglyceride levels showed gender differences: alkaline phosphatase, 290.3±52.2 U/

L in male rats and 150.3±41.9 U/L in female rats;

triglyceride, 67±31 mg/dL in male rats and 32±14 mg/

dL in female rats (Table 3). The standard deviations of chloride, sodium, and potassium, calcium, albumin, and total protein levels in male and female rats were less than 10% of the mean values. The standard deviations of A/

G ratio and phosphorus level in male rats and glucose level in female rats were less than 10% of the mean values. Further, the standard deviations of glucose, blood urea nitrogen, and creatinine levels and A/G ratio were more than 10% and less than 20% of the mean values in male and female rats. The standard deviations of total

cholesterol and alanine aminotransferase levels in female rats were more than 10% and less than 20% of the mean values. Moreover, the standard deviations of total cholesterol level in male and female rats, and aspartate aminotransferase, alkaline phosphatase, alanine aminotransferase levels in male rats were more than 20%

and less than 30% of the mean values. Finally, the standard deviations of gamma-glutamyl transpeptidase, total bilirubin, and triglyceride levels in male and female rats, and aspartate aminotransferase, alkaline phosphatase, alanine aminotransferase levels in female rats were more than 30% of the mean values.

Organ weights

The standard deviations of brain, heart, lung, kidney, and testis weights were less than 10% of the mean values (Table 4). Further, the standard deviations of pituitary, liver, spleen, and adrenal weights were more than 10%

and less than 20% of the mean values. The standard deviation of prostate weight was more than 20% and less than 30% of the mean value, and that of uterus weight was more than 30% of the mean value.

Discussion

In this study, we collated means, standard deviations,

RBC (×10 cells/µL) 110 8.85±0.36 8.13 9.57 100 8.12±0.35 7.41 8.82

HGB (g/dL) 110 15.1±0.6 13.8 16.3 110 14.9±0.5 13.8 16.0

HCT (%) 110 45.1±2.0 41.1 49.0 110 43.3±1.5 40.2 46.3

Reti (%) 110 2.3±0.5 01.4 03.2 110 1.9±0.4 1.2 2.7

MCV (f/L) 110 51.0±1.7 47.6 54.3 110 53.0±1.5 50.1 56.0

MCH (pg) 110 17.0±0.7 15.6 18.4 110 18.3±0.5 17.3 19.3

MCHC (g/dL) 110 33.4±1.0 31.5 35.3 110 34.5±0.9 32.7 36.3

PLT (×10

3

cells/µL) 110 1136±122 892 1381 110 1097±117 863 1330

WBC (×10

3

cells/µL) 110 8.90±2.13 4.64 13.15 110 4.33±1.03 2.28 6.38

NEW (%) 110 20.8±5.8 09.3 32.4 110 18.9±6.0 6.8 30.9

LYM (%) 110 74.2±6.0 62.2 86.3 110 75.9±6.4 63.1 88.7

MONO (%) 110 2.6±0.7 01.1 04.1 110 2.4±0.8 0.9 4.0

EOS (%) 110 1.2±0.4 00.5 01.9 110 1.5±0.5 0.5 2.5

BASO (%) 110 0.2±0.1 00.0 00.4 110 0.1±0.1 0.0 0.3

LUC (%) 110 0.9±0.4 00.1 01.7 110 0.9±0.5 0.0 1.9

PT (sec) 099 14.9±0.8 13.3 16.5 090 14.7±0.5 13.7 15.8

APTT (sec) 099 17.2±2.1 13.0 21.3 090 15.8±1.4 13.0 18.7

Fib (mg/dL) 100 354±37 279 429 085 253±34 185 322

RBC, erythrocyte count; HGB, hemoglobin; HCT, hematocrit; Reti, reticulocyte; MCV, mean corpuscular volume; MCH, mean corpuscular hemoglobin; MCHC, mean corpuscular hemoglobin concentration; PLT, platelet; WBC, leukocyte; NEW, neutrophil; LYM, lymphocyte; MONO, monocyte; EOS, eosinophil; BASO, basophil; PT, prothrombin time; APTT, activated partial thromboplastin time;

Fib, fibrinogen

(5)

percentages, and ranges of body weight, food consumption, urinalysis, hematological and blood biochemical parameter, and organ weights of Crl:CD (SD) rats from 11 studies of 13-week repeated toxicity to establish domestic reference values.

Body weight is an important parameter indicating the animal's condition. It is the basis to determine the dose of anesthetics or test substances in toxicity studies [8].

However, this parameter is frequently affected by feeding, measurement time, and measurement sensitivity. In our

study, the standard deviations of body weight at each age were less than 10%; thus, individual differences were small.

Food consumption is a sensitive parameter because reduced food intake by normal-appearing animals suggests loss of appetite induced by the test substance.

However, food consumption is frequently affected by individual differences and measurement time. In the current study, the standard deviations of food consumption at each age were more than 10% and less than 20% of

Table 3. Blood chemistry parameter of male and female rats

Male Female

N Mean±SD -2S.D +2S.D N Mean±SD -2S.D +2S.D

ALT (U/L) 110 31.2±5.8 19.5 42.8 110 29.9±10.3 9.3 50.6

AST (U/L) 110 85.8±18.5 48.9 122.7 110 82.8±23.2 36.5 129.1

ALP (U/L) 110 290.3±52.2 185.9 394.7 110 150.3±41.9 66.5 234.1

GGT (U/L) 070 0.65±0.39 0.00 1.43 070 0.86±0.45 0.00 1.77

Glu (mg/dL) 110 153±20 114 192 110 138±13 113 163

BUN (mg/dL) 110 12.8±1.4 10.1 15.5 110 13.9±1.7 10.4 17.3

Crea (mg/dL) 110 0.49±0.06 0.37 0.61 110 0.52±0.07 0.38 0.65

T-Bili (mg/dL) 110 0.06±0.02 0.02 0.10 110 0.08±0.02 0.04 0.12

T-Chol (mg/dL) 110 89±18 53 125 110 98±19 60 135

TG (mg/dL) 110 67±31 6 128 110 32±14 4 60

TP (g/dL) 110 6.3±0.3 5.7 6.8 110 6.6±0.3 5.9 7.3

Alb (g/dL) 110 2.5±0.1 2.2 2.8 110 3.0±0.2 2.5 3.5

A/G ratio 110 0.65±0.05 0.56 0.75 110 0.82±0.07 0.68 0.95

P (mg/dL) 110 6.17±0.45 5.26 7.07 110 4.62±0.62 3.38 5.86

Ca (mg/dL) 110 10.4±0.4 9.7 11.1 110 10.4±0.4 9.7 11.2

Na (mmol/L) 110 141±1 138 143 110 140±1 138 143

K (mmol/L) 110 4.7±0.2 4.2 5.2 110 4.2±0.3 3.6 4.8

Cl (mmol/L) 110 105±1 102 108 110 106±2 102 110

ALT, alanine aminotransferase; AST, aspartate aminotransferase; ALP, alkaline phosphatase; GGT, gamma-glutamyl transpeptidase;

GLU, glucose; BUN, blood urea nitrogen; Crea, creatinine; T-Bili, total bilirubin; T-Chol, total chloesterol;TG, triglyceride; TP, total protein; Alb, albumin; A/G, albumin/globulin; P, phosphorus, Ca, calcium; Na, sodium; K, potassium; Cl, Chlorde

Table 4. Organ weight of male and female rats

Male Female

N Mean±SD -2S.D +2S.D N Mean±SD -2S.D +2S.D

Body weight (g) 110 550.2 ±57.6 435.1 665.4 110 297.9 ±28.9 240.1 355.6

Brain (g) 110 2.08 ±0.09 1.90 2.25 110 1.90 ±0.09 1.72 2.09

Pituitary (g) 100 0.0128 ±0.0019 0.0090 0.0166 100 0.0155 ±0.0029 0.0097 0.0212

Heart (g) 100 1.52 ±0.14 1.23 1.80 100 0.95 ±0.08 0.78 1.12

Lung (g) 090 1.64 ±0.11 1.42 1.86 090 1.20 ±0.08 1.04 1.36

Liver (g) 110 14.44 ±2.20 10.04 18.84 110 7.37 ±0.87 5.63 9.10

Spleen (g) 100 0.86 ±0.12 0.62 1.09 100 0.52 ±0.07 0.38 0.66

Kidney (g) 110 3.24 ±0.35 2.54 3.95 110 1.86 ±0.20 1.46 2.26

Adrenal (g) 110 0.0614 ±0.0109 0.0395 0.0832 110 0.0660 ±0.0109 0.0443 0.0878

Testis (g) 110 3.42 ±0.30 2.81 4.03 NA NA NA NA NA

Prostate (g) 100 0.64 ±0.16 0.31 0.96 NA NA NA NA NA

Ovary (g) NA NA NA NA NA 110 0.0781 ±0.01305 0.0520 0.1042

Uterus (g) NA NA NA NA NA 90 0.70 ± 0.24 0.23 1.18

NA: Not applicable

(6)

growth and decreased food intake during maturation are associated with changes in metabolism. The tendency observed in our study is similar to other reports [9].

Urinalysis data are indicators of kidney disease.

Urinalysis is a useful tool for accessing a longitudinal effect of a test substance by repetitive sampling [10,11].

Urinalysis data are indicators of kidney disease, but they are frequently affected by stress due to environmental changes such as oliguria or contamination with feces or pellets [12,13]. In our study, male rats tended to show higher positive values than female rats [14,15]. In addition, the standard deviation of over 30% of the average urine volume in both genders suggests great individual differences. Gender differences in urine protein are reportedly caused by differences in sex hormones [16,17].

Blood acts as a carrier of food and oxygen to cells, waste away from cells, and various disease-fighting cells such as leukocytes. It is also a means of “puncture proofing” the body: it clots and seals small holes quickly.

Further, it is important for maintaining a constant body temperature. However, hematological parameters are frequently affected by collection site, storage method, fasting period, anesthetics, anticoagulants, and measurement method [18]. In the current study, the standard deviations of these parameters at each age were more than 30%, indicating great individual differences. The analyzed parameters showed a similar tendency to that previously reported [19].

Blood chemistry provides specific information about bodily functions including metabolism, drug absorption, blood circulation, and fluid balance. However, the analyzed parameters are frequently affected by collection site, storage method, fasting period, and anesthetics [20,21]. In our study, the standard deviations of gamma- glutamyl transpeptidase, total bilirubin, and triglyceride levels in male and female rats, and alanine amino- transferase, aspartate aminotransferase, and alkaline phosphatase levels in female rats were more than 30% of the mean values, again suggesting great individual differences. All blood biochemical parameters tended to show similar changes to those reported previously [3,9].

The variations in liver-associated enzymatic activity could be related to enzymatic variations due to age, gender, and other factors [22,23].

time, and measurement sensitivity. In the current study, the standard deviations of organ weights at each age were more than 30%, implying great individual differences, and similar to previously reported findings [3].

Differences in analytical methods as well as environmental and technique-related variables influence the obtained parametric values. As the data in this study were obtained from a single testing facility by using animals sourced from a single breeder, many of these variables would have been eliminated or minimized.

Therefore, these historical control data would help to interpret the effects of test substances in routine toxicity and efficacy studies.

References

1. Kang BH, Kim IH, Kim YB, Kim YH, Lee HS, Ha CS. Reference Values of Organ Weights in Sprague-Dawley Rats. Korean J Vet Pathol 2001; 5: 39-42.

2. Cho JH, Jeong SH, Ku HO, Kang HG, Park JM, Yun HI, Lee YS.

Improved Novel Method of Blood Sample Collection via Jugular Vein in Unanesthetized Rats. Lab Anim Res 1997; 13: 117-120 3. Kang BH, Kim YB, Lee HS, Kim YH, Im WJ, Ha CS.

Background Data on Hematology, Blood Chemistry and Organ Weights for 2 Weeks and 4 Weeks Repeated-Dose Toxicity Studies Using Sprague-Dawley (SD) Rats. Lab Anim Res 2004;

20: 134-140.

4. Ha CS, Son HY, Kang BY, Cha SW, Park JI, Han SS. A Study of Hematology and Serum Chemistry in Beagle Dogs. Lab Anim Res 1995; 11: 153-158.

5. Song CW, Cho KH, Han HS, Han SS. The Effects of Fasting Time on Haematological and Blood Biochemical Parameters in SD Rats. Lab Anim Res 1994; 10: 73-80.

6. Stockham SL, Scott MA. Fundamentals of Veterinary Clinical Pathology. Wiley-Blackwell. 2002; 32-34.

7. Hirata M, Nomura G, Tanimoto Y. Stability of Serum Components in Monkey, Dog and Rat. Exp Anim 1979; 28: 401-404.

8. Song CW, Hwang HS, Han SS. Studies on the Basic Data of Ktc:SD Rats with Age-Body Weight, Hematology, Serum Chemistry and Urinalysis. Lab Anim Res 1990; 6: 33-43.

9. Kang BH, Son HY, Ha CS, Lee HS, Song SW. Reference Values of Hematology and Serum Chemistry in Ktc:Sprague-Dawley Rats. Lab Anim Res 1995; 11: 141-145.

10. Gwon YI, Kang SC, Kang JS, Gwon JK, Park WD, Shin JH, Won R, Lee JS, Choi WC, Hwang SY. Clinical Pathology of Laboratory Animal. Academya. 2009; 84-85.

11. Yamada H. Evaluation methods for nephrotoxicity. Nihon Yakurigaku Zasshi 2009; 133(3): 154-157.

12. Hayes AW. Principles and Methods of Toxicology, 4th ed. CRC/

Taylor & Francis. 2001; 1032-1033.

13. Meyer DJ, Harvey JW. Veterinary Laboratory Medicine:

Interpretation & Diagnosis, 2nd ed. WB Saunders. 1998; pp223- 224.

14. Verhagen AM, Attia DM, Koomans HA, Joles JA. Male gender increases sensitivity to proteinuria induced by mild NOS inhibition in rats: role of sex hormones. Am J Physiol Renal Physiol 2000; 279(4): F664-670.

15. Swenberg JA. Alpha 2u-globulin nephropathy: review of the

(7)

cellular and molecular mechanisms involved and their implications for human risk assessment. Environ Health Perspect 1993; 101 Suppl 6: 39-44.

16. Gad SC. Animal Models in Toxicology, 2nd ed. CRC/Taylor &

Francis. 2008; pp 814-815.

17. Hamamura M, Hirose A, Kamata E, Katoku K, Kuwasaki E, Oshikata T, Nakahara Y, Ema M, Hasegawa R. Semi-quantitative immunohistochemical analysis of male rat-specific alpha2u- globulin accumulation for chemical toxicity evaluation. J Toxicol Sci 2006; 31(1): 35-47.

18. Kim JS, Hwang SY, Chu SK, Kim IT. The Effects of Time and Temperature Variables on PT and aPTT Test of Stored Plasma and Whole Blood. J Clin Pathol Exam Sci 2000; 32: 40-47.

19. Oh SH, Do SG. Reference Values of Body Weight, Blood Pressure, Hematology and Serum Biochemistry in the Sprague- Dawley (SD) Rats from 24 to 30 Months. Lab Anim Res 2001;

17: 275-282.

20. Emori T, Takahashi M, Nagase S. Comparative studies on lactate dehydrogenase in serum and plasma of rats . Jikken Dobutsu 1978; 27(2): 167-175.

21. Mariko H, Mamoru N, Masayuki Y. Clinical Chemistry of the Animal. Influence Factors to Be Considered on Establishment of the Reference Data of ALT, AST and ALP in Rats. Japanese Journal of Clinical Chemistry 2001; 30: 142-152.

22. Fox JG, Anderson LC, Loew FM, Quimby FW. Laboratory Animal Medicine, 2nd ed. Academic Press. 2002; pp 95-104.

23. Okamura T, Suzuki S, Ogawa T, Kobayashi J, Kusuoka O, Hatayama K, Mochizuki M, Hoshiya T, Okazaki S, Tamura K.

Background Data for General Toxicology Parameters in

RccHan:WIST Rats at 8, 10, 19 and 32 Weeks of Age. J Toxicol

Pathol 2011; 24(4): 195-205.

수치

Figure 2. Changes in food consumption of male and female rats
Table 4. Organ weight of male and female rats

참조

관련 문서

Studies are on-going concerning the potential impact of the control rod material(Ag, In, Cd). In the containment, The equilibrium between iodine adsorption

[표 12] The true model is inverse-gaussian, out-of-control ARL1 and sd for the weighted modeling method and the random data driven

I examined ticks that collected by Flagging and Dragging method in 5 regions of Gwangju suburb and captured rats. nipponensis ) I classified ticks

Difference of microhardness values(M±SD) between control and experimental side in various groups ···

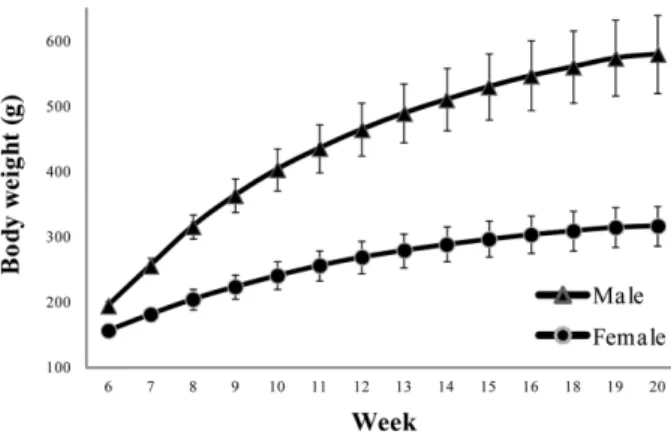
Mortality and clinical signs in SD rats about single oral administration after 3 weeks with callus extract ..... Hematological values in SD rats administered orally

Monthly Energy Statistics presents current data on production, consumption, imports,.. exports, stocks and prices of principal energy

Monthly Energy Statistics presents current data on production, consumption, imports,.. exports, stocks and prices of principal energy

mandibular P-18 inncisor from Nfic-deficient mice (×3,000)... In this study, histological and immunohistochemical studies were carried out to investigate