Ⓒ The Korean Society of Soil Science and Fertilizer. This is an Open Access article distributed under the terms of the Creative Commons Attribution Non- Commercial License (http://creativecommons.org/licenses/by-nc/4.0) which permits unrestricted non-commercial use, distribution, and reproduction in any medium, provided the original work is properly cited.
Korean J ournal of S oil S cience and F ertilizer
Short Communication https://doi.org/10.7745/KJSSF.2019.52.4.369 pISSN : 0367-6315 eISSN : 2288-2162
Evaluation of Changes in Agricultural Stream Water Quality of Small Watershed in Gyeonggi Province
Ahn-Sung Roh, Jung-Su Park, Young-Su Park, Ok-Jung Ju, Min-Woo Shin, Min-Kyeong Kim1, and Soon-Kun Choi2* Gyeonggido Agricultural Research & Extension Services, Hwaseong 18388, Korea
1International Technology Cooperation Center, Rural Development Administration, Jeonju 54875, Korea
2Climate change & Agroecology Division, National Institute of Agricultural Sciences, RDA, Wanju 55365, Korea
*Corresponding author: [email protected]
A B S T R A C T Received: October 28, 2019
Revised: November 20, 2019 Accepted: November 25, 2019
This study aimed to identify the changing trends in the agricultural water quality of the major watersheds in Gyeonggi Province over a 10-year period ranging from 2007 to 2016. The results of water quality analysis of the study sites revealed that the mean chemical oxygen demand was 3.8 mg L-1, with the median values being 3.5 mg L-1. The mean chemical oxygen demand in April, July, and October were 4.7, 3.8, and 3.1 mg L-1, respectively, and chemical oxygen demand values trended to decrease from April to October. The mean and the median electrical conductivity were 0.22 dS m-1. The mean electrical conductivity values were slightly higher in April and lower in October, and there was no yearly fluctuation. The mean and median values of the T-N (Total Nitrogen) content were 3.3 mg L-1 and 3.0 mg L-1, respectively. The mean and median values of the T-P (Total Phosphorous) content were 0.10 mg L-1 and 0.06 mg L-1, respectively, and there was no tendency to increase or decrease during the April, July and October.
Keywords: Agricultural water quality, Stream water, Small watershed, Gyeonggi province
April July October
Changes in annual water quality index in April (left), July (center), and October (right).
370 ∙ Korean Journal of Soil Science and Fertilizer Vol. 52, No. 4, 2019
Introduction
경기도 하천은 한강을 비롯한 16개의 국가하천과 500개의 지방하천으로 구성되어 있으며, 지방하천의 개수가 많 고 총 연장은 3,489 km로 긴 편이다. 주요하천은 한강, 북한강, 안성천 등이며 대부분 한강유역에 포함된다 (White book of Gyeonggi-do, 2012). 또한, 경기도는 남양만, 아산만 등 크고 작은 여러 만 (bay)과 시화호, 남양호, 아산호 등 의 인공호수들이 산재되어 있으며 이들은 한강을 비롯한 소하천으로부터 유입되는 오염원으로 인해 부영양화 문제를 안고 있다 (Lim et al., 2007).
Son et al. (2017)은 경기도 신천 및 유입지천에 대해 산업계, 생활계, 축산계 순으로 BOD (Biochemical Oxygen Demand) 오염부하량이 크다고 보고하였다. 한편, Kim and Na (2007)은 한강 대권역 중 경기도 지역의 BOD, T-N (Total Nitrogen), T-P (Total Phosphorous)의 토지계 발생부하량이 각각 4.9%, 11.5%, 4.7%로 생활계, 축산계에 비 하여 낮은 수준을 보였으나 환경기초시설 처리를 가정하면 각각 29.0%, 24.1%, 15.7%로 높게 나타나 토지계 발생부 하량 제어가 어려운 것으로 평가하고 토지계 부하량를 줄이기 위해 한강 수계 농경지의 비점오염 관리가 중요하다고 보고하였다. Lee et al. (2008)은 한강상류 소유역인 경안천 유역을 대상으로 비점오염원 유출 특성을 고찰한 결과 농 촌유역은 토지이용 등 유역 특성을 고려한 평가가 필요하다고 하였다. 한편, 위와 같은 수질조사는 대부분 대규모 유 역의 하류를 대상으로 수행되거나 소유역을 대상으로 수행되더라도 단일 유역의 단발성 조사에 그치는 등의 한계가 있다. 따라서 농업분야 수질관리 전략을 수립하기 위해서는 농촌 소유역에 대한 장기적인 수질조사 분석자료의 축적 은 물론 지리정보체계 (GIS, Geographic Information Systems)를 활용한 유역특성자료 구축이 선행되어야 한다.
이와 관련하여 농촌진흥청은 각 도농업기술원과 함께 농업용수의 건전성 및 농작물의 안전성 확보를 위해 2007년 부터 농업용수에 대하여 매년 하천수 300 지점 3회, 지하수 200지점 2회 분석을 실시하고 있으며 2017년에는 뺷농업 자원과 농업환경의 실태조사 및 평가 기준뺸 고시를 제정하였다. 본 연구는 경기도 농촌 소유역의 하천을 대상으로 2007년부터 2016년까지 10년간 조사한 수질조사 자료를 바탕으로 GIS를 활용하여 유역의 특성을 파악하고 하천수 의 수질 변동을 평가하고자 실시하였다.
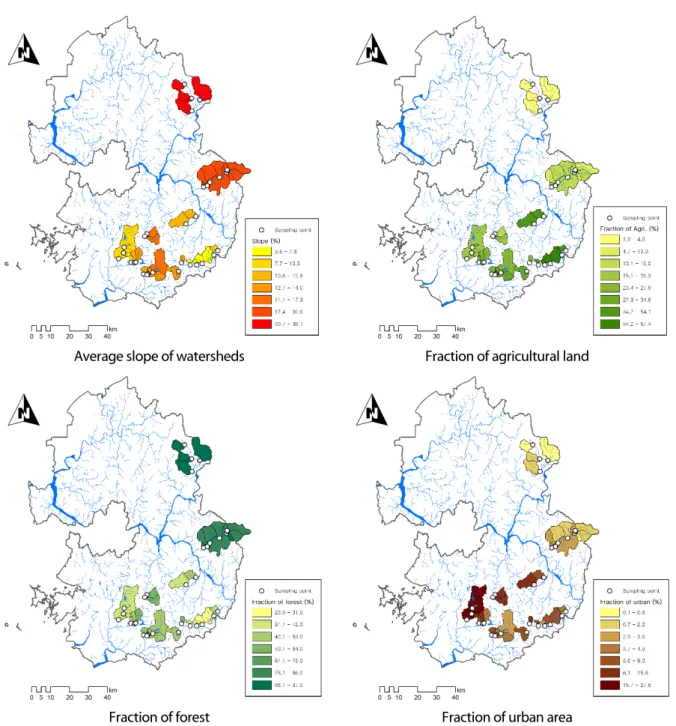
하천수 조사 시기 및 조사지점의 유역 특성 경기지역의 농업용 하천수 수질조사 지점의 위치와 유역의 특성 은 Fig. 1과 같다. 유역은 SRTM (Shuttle Radar Topography Mission) 90 m DEM (Digital Elevation Model) 데이터 (CGIAR, 2000)를 이용하여 추출하였으며 토지이용 정보는 2013 환경부 중분류토지피복지도 (KMOE, 2013)를 사 용하여 추출하였다. 총 조사 지점은 32지점으로 2007년부터 2016년까지 연간 4월, 7월, 10월 3회에 걸쳐 수질조사를 실시하였다. 유역크기는 1.8 - 287.2 km2, 평균 39.6 km2이며 중위값 24.5 km2이다. 농경지 비율은 1.3 - 67.4%, 평균 26.1%이며 중위 값은 24.2%이다.
유역별 강수량은 기상청 종관기상관측자료 (ASOS, Automated Synoptic Observation System)를 사용하여 산정 하였다 (KMA, 2019). 2007 - 2016년의 기간에 걸쳐 강수량 자료를 보유하고 있는 기상대의 강수량 자료를 수집하였 으며 기상대의 위치 자료와 월별 강수량 자료를 IDW (Inverse Distance Weight)를 이용하여 공간보간 하였다. 유역 별 월간 강수량은 ArcGIS의 Zonal statistics를 이용하여 추출하였다.
농업용 하천수 수질 조사 방법 수질시료 채취는 시료채취용 버킷을 이용하여 폴리에틸렌용기에 총 3리터 (1 L + 2 L)를 채수하였으며 아이스박스에 담아 실험실로 운반하였다. 시료의 보관 및 분석은 종합검정실 분석 매뉴얼
Average slope of watersheds Fraction of agricultural land
Fraction of forest Fraction of urban area
Fig. 1. Topography and land use characteristics of the upstream watershed at the water sampling site.
(RDA, 2013)을 따라 수행하였다. 화학적 산소요구량 (CODMn, Chemical Oxygen Demand)은 CODMn산성법을 따 라 분석하였다. pH, EC는 pH/EC전극을 이용하여 분석하였으며 Orion 3 Star Meter (Thermo Scientific, USA)를 사 용하였다. T-N의 경우 자외선흡광광도법으로 분석하였으며 T-P 분석은 아스코르빈산환원법을 사용하였다. 총질소 와 총인 분석을 위한 장비로서 Lambda 650 UV-Vis (Perkinelmer, USA)을 사용하였다.
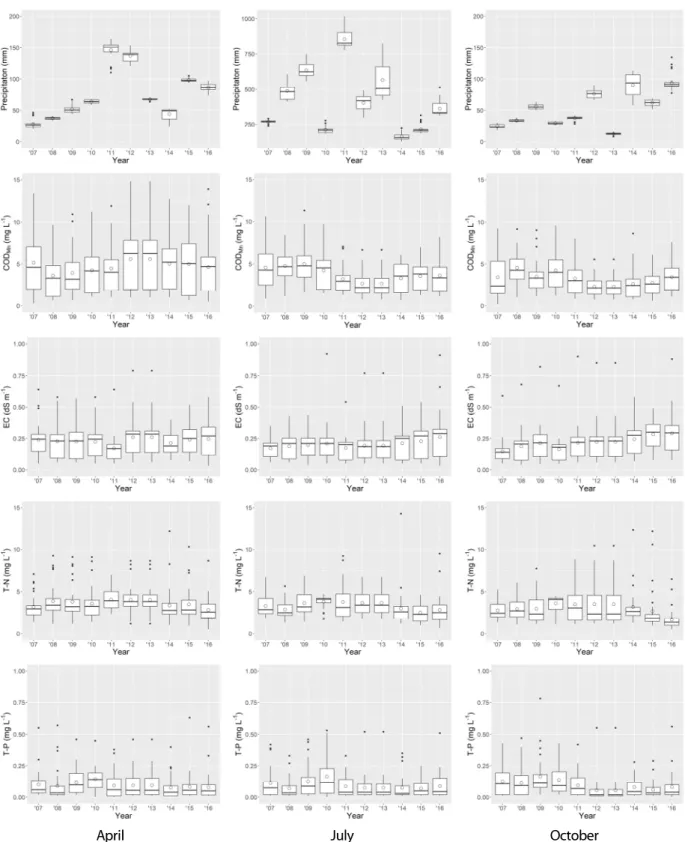
농촌 유역 하천수 수질 변동평가 결과 연구조사 대상지역의 4월 강수량은 2011년까지 증가하는 경향을 나 타냈으며, 2011년과 2012년에는 120 mm 이상인 유역이 관측되었다 (Fig. 2). 특히 2014년에는 7월 강수량이 매우 낮
372 ∙ Korean Journal of Soil Science and Fertilizer Vol. 52, No. 4, 2019
April July October
Fig. 2. Changes in annual water quality index in April (left), July (center), and October (right).
은 반면 10월에 많은 강수량을 나타내 연차간 편차가 큰 것으로 나타났다. CODMn은 평균 3.8 mg L-1, 중위값 3.5 mg L-1로 나타났다. 조사시기별 평균 CODMn은 4월 4.7 mg L-1, 7월 3.8 mg L-1, 10월 3.1 mg L-1로 4월이 높고 10월이 낮 았다. 전기전도도 (EC, Electrical Conductivity)는 평균 0.22 dS m-1, 중위값 0.22 dS m-1로 나타냈으며 연도별 증감
경향이 없이 4월이 높고, 10월이 다소 낮았다. T-N 함량은 평균 3.3 mg L-1, 중위값 3.0 mg L-1로 나타냈으며 2011 - 2013년 7월과 10월에 편차가 크게 나타났다. T-P 함량은 평균 0.10 mg L-1, 중위값 0.06 mg L-1으로 나타났으며 조사 시기별 증감하는 경향 없이 4월, 7월, 10월 같은 평균값을 나타냈다.
하천유역의 농경지 면적이 수질에 미치는 영향을 알아보기 위하여 32개의 연구대상 유역을 농경지 면적비율에 따 라 4분위로 나누어 평가하였다. 1분위 (가평 승안천 등 8지점), 2분위 (양평 용문천 등 8지점), 3분위 (안성 방초천 등 8지점), 4분위(이천 제요천 등 8지점) 농경지 면적비율 평균값은 각각 6.4, 17.0, 28.2, 52.6% 였다. 유역 내 농경지 비 율에 따른 유역말단에서의 농업용수 수질 특성을 살펴보면 농경지 비율이 증가함에 따라 T-N, T-P, CODMn농도가 대 체로 증가는 경향을 나타냈다 (Table 1). 특히 T-P값은 농업활동이 활발한 7월의 경우 농경지 비율 1분위, 2분위, 3분 위, 4분위 각각 0.020, 0.089, 0.099, 0.145 mg L-1로 농경지 비율이 증가함에 따라 농도의 변화가 뚜렷하게 나타났다.
본 연구의 결과는 농업용수 수질 변화의 원인을 평가하고 농촌소유역의 농업용수 수질관리를 위한 기초자료로서 유용하게 활용될 수 있을 것으로 판단된다. 하지만 농경지 농업용수 수질변화의 원인분석과 개선안 도출을 위해서는 유역 내 생활지역, 축산시설 등 점오염원 분포에 관한 조사가 병행되어야 하며, 조사 시점의 선행강우량 등에 관한 조 사가 추가되어야 할 것으로 판단된다.
Table 1. Average value of agricultural water quality by quartile according to the fraction of agricultural land area in the watershed.
Quartile
Number of watershed
Fraction of agricultural
land
April July October
T-N T-P CODMn T-N T-P CODMn T-N T-P CODMn
(%) --- mg L-1 ---
1st 8 6.4 2.82 0.029 1.41 2.33 0.020 1.89 1.90 0.031 1.60
2nd 8 17.0 4.11 0.111 4.17 3.56 0.089 3.49 2.97 0.091 3.20
3rd 8 28.2 3.32 0.119 5.77 3.13 0.099 4.44 2.81 0.106 3.84
4th 8 52.6 4.26 0.125 7.77 4.23 0.145 5.29 4.51 0.135 4.37
Acknowledgement
This study was conducted with the support of the “Cooperative Research Program for Agriculture Science &
Technology Development (Project No. PJ012505)” Rural Development Administration, Republic of Korea.
References
CSI (Consortium for Spatial Information). 2000. http://srtm.csi.cgiar.org/.
Kim, K.S. and Y. Na. 2007. The present state and improvement of water quality of han river. J. Korean Soc. Environ.
Eng. 29(11):1169-1178.
KMA (Korea Meteorological Administration). 2019. https://data.kma.go.kr/.
KME (Korean Ministry of Environment). 2013. https://egis.me.go.kr/.
Lee, B.S., Y.J. Jung, M.J. Park, and K.I. Gil. 2008. A study on the discharge characteristics of non-point pollutant source in
374 ∙ Korean Journal of Soil Science and Fertilizer Vol. 52, No. 4, 2019
the agricultural area of the kyongan watershed. J. Korean Soc. Water Qual. 24(2):169-173.
Lim, D.I., K.C. Rho, P.G. Jang, S.M. Kang, H.S. Jung, R.H. Jung, and W.C. Lee. 2007. Temporal-spatial variations of water quality in gyeonggi bay, west coast of korea, and their controlling factor. Ocean Polar Res. 29(2):135-153.
RDA (Rural Development Administration). 2013. Manual of analysis procedures for comprehensive test lab. Rural Development Administration. 75-93.
Son, Y.G., H.B. Im, K.H. Lee, J.G. Kim, Y.J. Im, J.I. Choi, H.J. Lee, and J.G. Oh. 2017. A study on the evaluation of pollution characteristics on sincheon stream and its tributaries in gyeonggi-do province. Korean Journal of Environmental Health Sciences. 43(5):422-430.
White book of Gyeonggi-do. 2012. https://ebook.gg.go.kr/20131213_155405/.