J F E S
Journal of Forest and Environmental Science
Journal of Forest and Environmental Science Vol. 32, No. 4, pp. 329-343, November, 2016 https://doi.org/10.7747/JFES.2016.32.4.329
Plant Diversity, Tree Regeneration, Biomass Production and Carbon Storage in Different Oak Forests on Ridge Tops of Garhwal Himalaya
Chandra Mohan Sharma*, Om Prakash Tiwari, Yashwant Singh Rana, Ram Krishan and Ashish Kumar Mishra Department of Botany, HNB Garhwal University, Srinagar Garhwal, Uttarakhand 246174, India
Abstract
The present study was conducted on ridge tops of moist temperate Oak forests in Garhwal Himalaya to assess the plant diversity, regeneration, biomass production and carbon assimilation in different Oak forests. For this purpose, three Oak forest types viz., (a) Quercus leucotrichophora or Banj Oak (FT1; between 1,428-2,578 m asl), (b) Quercus floribunda or Moru Oak (FT2; between 2,430-2,697 m asl) and (c) Quercus semecarpifolia or Kharsu Oak (FT3; between 2,418-3,540 m asl) were selected on different ridge tops in Bhagirathi catchment area of Garhwal Himalaya. A total of 91 plant species including 23 trees (8 gymnosperms and 15 angiosperms), 21 shrubs and 47 herbs species belonging to 46 families were recorded from all the ridge top Oak forests. The highest mean tree density (607±33.60 trees ha-1) was observed in Q. floribunda forest with lower mean total basal cover (TBC) value (48.02±3.67 m2ha-1), whereas highest TBC value (80.16±3.30 m2ha-1) was recorded for Q. semecarpifolia forest, with lowest mean stem density (594±23.43 stems ha-1). The total biomass density (TBD) across three Oak forests ranged between 497.32±83.70 (FT1) and 663.16±93.85 t ha-1 (FT3), while the total carbon density (TCD) values ranged between 228.75±22.27 (FT1) and 304.31±18.12 t ha-1 (FT3). Most of the tree species were found with good regeneration (GR) status (average 45%) in all the forest types whereas, few species were found not regenerating (NR) (average 17%) however, few new recruitments were also recorded.
ANOVA (Post-Hoc Tukey’s test at 5% significance level) indicated significant forest-wise differences in TBC, TBD and TCD (in tree layer); family and evenness (in shrub layer only) values, while insignificant differences were noticed in density values of tree, seedling and herb layer.
Key Words: Garhwal Himalaya, moist temperate, ridge top forests, diversity and regeneration, biomass and carbon
Received: November 23, 2015. Revised: September 16, 2016. Accepted: October 3, 2016.
Corresponding author: Chandra Mohan Sharma
Department of Botany, HNB Garhwal University, Srinagar Garhwal, Uttarakhand 246174, India Tel: 91-9412079937, Fax: 91-1376-252128, E-mail: [email protected]
Introduction
The Oaks are the keystone species of Himalayan forest ecosystems, without which the complex web of rural live- lihood cannot be imagined. Oaks are multipurpose tree species, which are closely linked with hill agriculture as an important source of fodder, firewood and making compost by litter. The regeneration of Oak forests in Himalayan re- gion is reported to be steadily deteriorating (Singh and
Singh 1992). The causes of failure of regeneration include lack of production of viable seeds, insect and animal pre- dation, unfavourable micro-sites, overgrazing by domestic animals, habitat change and biological invasions. Thus for proper management of Himalayan Oak forests, the knowl- edge on diversity, population structure, distribution, re- generation, stocking, biomass production and carbon stor- age is necessary to support the conservation and restoration of Oak species.
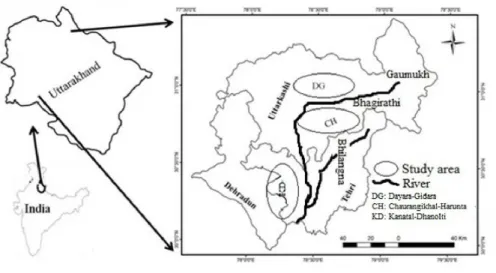
Fig. 1. Map representing the study sites.
In Garhwal Himalaya mainly three Oak species are dominant on different altitudes i.e., (i) Quercus semecarpi- folia Sm. (Kharsu Oak/Brown Oak), which is found in up- per altitudinal zones (between 2,418-3,540 m asl), (ii) Quercus floribunda Lindle. (Moru Oak/Green Oak) in the middle zones (between 2,430-2,697 m asl) and (iii) Qu- ercus leucotrichophora A. Camus. (Banj Oak/White Oak) in the lower altitudinal zones (between 1,428-2,578 m asl).
Understanding the forest structure is a pre-requisite to describe various ecological processes and also to model the functioning and dynamics of forests (Elourad et al. 1997).
The nature of forest communities largely depends on the ecological characteristics of sites, species diversity and re- generation status of species. Micro-environmental factors affect the growth stages i.e., seedling, sapling and young trees of the forest communities that maintain the population structure of any forest. Regeneration of species is critical in a forest, because it decides the desired species composition and stocking in future. Regeneration of any species is con- fined to a peculiar range of habitat conditions and the extent of those conditions is a major determinant of its geogra- phical distribution.
Climate controls the distribution of vegetation (Vetaas 2000) and future changes in climate are projected to cause changes in the vegetation distribution ranges. Several stud- ies have attributed widespread changes in plant growth or mortality to climate change, but these efforts were focused on general trends within a biome rather than identifying spatially coherent distribution pattern (Pauli et al. 2007;
Engler et al. 2009).
The Himalayan ridge top (RT) ecosystems are consid- ered to be more sensitive to global warming as they are characterized by uniform sunlight exposure and low human interferences and hence are perfect places for monitoring and comparing the effects of climate change and predicting the future changes in species composition. Furthermore, it is supposed that in the event of a rise in temperature at low- er elevations the movement/migration of vegetation would be towards upper elevational ridge tops. It is understan- dable, because the recent global warming has resulted in disturbances of ecological relationships, alteration in plant life history and general upward shift in the species dis- tributional ranges (Mc Kone et al. 1998; Klanderud 2005;
Jaurasinski and Kreyling 2007; Pauli et al. 2012).
The carbon storage in forest ecosystems is strongly af- fected by climate, forest type, stand age, disturbance re- gimes and edaphic conditions (Pregitzer and Euskirchen 2004). Climate change can modify the tree species compo- sition and migration patterns (Bu et al. 2008), which can further influence the forest composition. Thus the forest carbon is a useful measure for the assessment of changes in forest structure and composition. Biomass production and carbon stock will reveal the carbon sequestration potential by Oaks at high mountains. In this study the specific ques- tions, we tried to answer were (i) the structure, composition, diversity and regeneration status of different Oak forests on ridge tops, and (ii) biomass and carbon storage potential of Oak species on ridge tops at various altitudes.
Materials and Methods
Study area
This study was conducted in the moist temperate forests of Bhagirathi Catchment area in Garhwal Himalaya. A re- connaissance survey of the study area was done from June to February in the years 2014 and 2015. The study area lies in two different districts (Uttarkashi and Tehri) of Uttara- khand state. We have selected 30 ridge tops of Oak domi- nated forests, in which Quercus leucotrichophora forest (FT1) was situated at 30o07'50.8''N latitude and 078o 17'10.5''E longitude; Quercus floribunda forest (FT2) at 30o24'0.6"N latitude and 078o28'39.1''E longitude; and Quercus semecarpifolia forest (FT3) at 30o39'12.9''N lat- itude and 078o39'45.2''E longitude. The climate of the en- tire study area was moist temperate type with mean mini- mum monthly temperature ranging from 7.12oC (Jan) to 23.20oC (Jul) and mean maximum monthly temperature from 17.56oC (Jan) to 33.35oC (Jul) (Suyal et al. 2010), however, mean annual rainfall was amounted as 2000 mm.
There were three main distinct seasons in a year i.e., cool and relatively dry winter (December to March); the warm and dry summer (mid-April to June); and a warm and wet period (July to mid-September) called as the monsoon or rainy season. These regions contain varying topographical features ranging from snow free valleys to the high peaks with perpetual snow and glaciers (Fig. 1).
Vegetation analysis
For quantitative analysis of forest vegetation and re- generation pattern on ridge tops of different Oak forest types, ten sample plots of 0.1 ha, each were randomly laid out on surveyed ridge tops in each forest type to analyse the tree species (10 sample plots×03 forest types=30 sample plots). Within each 0.1 ha sample plot, 5 m×5 m sized quadrats were laid out randomly to analyse the tree saplings and shrubs. However, 1 m×1 m sized quadrats were used for the analysis of tree seedlings and herbs (Curtis and McIntosh 1950; Phillips 1959). Circumference at breast height (cbh at 1.37 m from the ground) was taken for the determination of tree basal cover. The quantitative parame- ters of the community, i.e., frequency, density, total basal cover and IVI were calculated following Cottam and Curtis (1956). On the basis of data so obtained the Shan-
non-Wiener diversity Index (Shannon and Weaver 1963), Simpson dominance Index (Simpson 1949), evenness (Pielou 1966) and -diversity (Whittaker 1972) were also computed. However, the Index of similarity (IS) between forest types was calculated following Muller-Dombois and Ellenberg (1974) as: Similarity index=A+B2C ×100, Where C is the number of common species shared between com- pared forest types and A and B are the number of species in each forest respectively.
Population structure and regeneration pattern To determine the population structure and regeneration pattern in each forest type the dbh classes were established on the basis of range of available data. The tree (0.1 ha), sapling (5 m×5 m) and seedling (1 m×1 m) densities were calculated and extrapolated on per hectare basis. Different regeneration categories (Good, Fair, Poor, Not and New re- generation) were created to express the regeneration status in the forest. Regeneration of woody plant species was de- termined based on population size of seedlings, saplings and adults and categorized as per Khumbongmayum et al.
(2006).
Biomass and carbon
The biomass for tree components was estimated using the linear regression equation framed out by Rawat and Singh (1988) and Adhikari et al. (1998) as: ln Y=a+b ln X; Where ln=natural log, Y=dry weight of component (kg), X=CBH (cm), a=the y-intercept and b=slope of regression. The carbon % for different forest types was cal- culated as per Sharma et al. (2010). We used the inter- species regression equation (Rawat and Singh 1988) for those species which are not independently mentioned.
The identification of plants was done with the help of ex- isting taxonomic literature, described in Flora of Gangotri National Park (Pusalkar and Singh 2012), Flora of the dis- trict Garhwal North West Himalaya (Gaur 1999) and Herbarium of H.N.B. Garhwal University Srinagar (GUH).
Statistical analysis
ANOVA (Post-Hoc tukey’s test) for different ecological attributes was performed by using SPSS (version-22).
Table 1. Ecological indices of trees, shrubs, herbs and statistical results (ANOVA) in different ridge Oak forests of high mountain StagesFTsSRGenusFamilyCdH̅eDenTBCTBDTCDSimilarity%-diversity TreesFT10807050.390.580.2860369.94497.32228.75 FT21210070.450.550.2260748.02576.71265.1544.641.64 FT31412080.430.620.2359480.16663.16304.31 F value0.3180.3580.6200.0640.0961.1000.04612.765 5.9905.990 p value0.7300.7020.5450.9380.9090.3470.955 0.000 0.0070.007 SaplingsFT10706050.290.670.341,874 1.11-- FT21110070.220.820.342,787 0.37--27.732.63 FT31009060.200.830.362,133 0.69-- F value0.5070.6001.3150.8660.5611.2164.535 3.045 p value0.6080.5550.2840.4320.5770.3120.020 0.064 SeedlingsFT10706050.290.690.3530,571--- FT20907060.250.750.3438,667---49.581.17 FT30807060.240.750.3646,167--- F value0.3090.2920.5800.9870.5910.8693.033 p value0.7360.7440.5660.3850.5610.4300.064 ShrubsFT11414110.111.060.403,303--- FT21212100.091.070.433,000---53.051.05 FT31010080.120.960.423,867--- F value1.6621.6624.2530.7280.8459.1653.499 p value0.2080.2080.0240.4920.4400.0010.044 HerbsFT12323150.051.320.42142,571--- FT22323160.061.30.42145,833---32.642.24 FT31919130.071.230.42140,833--- F value0.2100.2100.4130.2430.0371.3600.067 p value0.8110.8110.6660.7860.9640.2730.935 FTs, forest types; FT1, forest type1; FT2, forest type2; FT3, forest type3; SR, species richness; Cd, Simpson index; , Shannon Index; e, Pielou evenness index; Density (ind ha-1 ); TBC (m2 ha-1 ); TBD (Mg ha-1 ); TCD (t C ha-1 ).
Results and Discussion
Forest structure and species composition
After systematic survey of Oak forests on the ridge tops of Bhagirathi catchment area, total 91 plant species belong- ing to 81 genera and 46 families were recorded. In Q. leu- cotrichophora forest, 45 species (08 trees, 14 shrubs and 23 herbs); in Q. floribunda forest, 47 species (12 trees, 12 shrubs and 23 herbs); and in Q. semecarpifolia forest, 43 species (14 trees, 10 shrubs and 19 herbs) were recorded.
No significant variation was found in species richness, ge- nus and families (except understorey shrub layer) in se- lected oak forest types (Table 1).
Tree species like Abies pindrow, A. spectabilis, Lyonia ovalifolia, Rhododendron arboreum Ilex dipyrena etc. were dominant/co-dominant species which formed the estab- lished association with oak forests on high mountain ridge tops of Western Himalaya. Consequently, in this study Rhododendron arboreum and Lyonia ovalifolia were found widely distributed in all Quercus forest types as co-domi- nant species. Whereas, Abies pindrow, Ilex dipyrena and Symplocos paniculata were co-dominants in Q. floribunda and Q. semecarpifolia forests only. In FT1, the Q. leuco- trichophora (430 trees ha-1), R. arboreum (66 tree ha-1) and Q. floribunda (47 tree ha-1) together constituted 90% of the total forest density, which was greater than the previous re- corded density by Singh and Rawat (2012) for Banj Oak forest. Similarly in FT2, the Q. floribunda (453 trees ha-1), R. arboreum (99 trees ha-1) and L. ovalifolia (13 tree ha-1) together constituted 93% of the total forest density. In FT3, the Q. semecarpifolia (430 trees ha-1) and R. arboreum (57 trees ha-1) together contributed 81% of the total forest density. These values were similar to the values reported by Singh and Rawat (2012). The mean tree density in these forests ranged from 594±23.43 (FT3) to 607±33.60 in- dividuals ha-1 (FT2), whereas mean Total Basal Cover val- ues oscillated from 48.02±3.67 (FT2) to 80.16±3.30 m2 ha-1 (FT3). The earlier reported values of density and TBC in Q. leucotrichophora forest were 790-1,260 individual ha-1 and 13.60-71.25 m2 ha-1 (Kusumlata and Bisht 1991), 554 trees ha-1 and 39.20 m2 ha-1 (Thadani and Ashton 1995), 100-860 trees ha-1 and 8.42-59.71 m2 ha-1 (Sharma et al. 2001), 730 ind ha-1 and 43.96 m2 ha-1 (Srivastava et al.
2005), 990 trees ha-1 and 35.08 m2 ha-1 (Gairola et al.
2011), 433 trees ha-1 and 88.06 m2 ha-1 (Singh and Rawat 2012), 400-933 trees ha-1 and 14.22-40.16 m2 ha-1 (Rawal et al. 2012). In Q. floribunda forest the reported values of density and TBC were 220-640 individuals ha-1 and 23.53 to 43.24 m2 ha-1 (Sharma et al. 2001), 493 individuals ha-1 and 72.51 m2 ha-1 (Gairola et al. 2012), 433 trees ha-1 and 110.47 m2 ha-1 (Singh and Rawat 2012), 423-793 trees ha-1 and 11.20-34.01 m2 ha-1 (Rawal et al. 2012), 620 trees ha-1 and 103.98 m2 ha-1 (Bisht et al. 2013). Similarly in Q. se- mecarpifolia forest the density and TBC values were found ranging between 340-810 trees ha-1 and 30.1-62.2 m2 ha-1 (Rai et al. 2012), 600 trees ha-1 and 58.25 m2 ha-1 (Gairola et al. 2012), 337 trees ha-1 and 90.16 m2 ha-1 (Singh and Rawat 2012), 407-723 trees ha-1 and 54.84-69.75 m2 ha-1 (Rawal et al. 2012), 340 trees ha-1 and 48.51 m2 ha-1 (Bisht et al. 2013). Joshi and Yadava (2015) have also reported high range of tree density (765-1000 tree ha-1) and TBC (56.96-88.88 m2 ha-1) for various Oak forests of Kumaun Himalayan region.
The TBC values were greater in Q. semecarpifolia forest at higher altitudes (2,418-3,540 m asl) because these were the mature/less disturbed forests and consequently shown higher productivity. However, lower altitudinal Q. leuco- trichophora forests (1,428-2,578 m asl) have reflected moderate density and TBC values, because they were situ- ated close to human settlement. There was no significant variation (F=0.046, p=0.955) between overall tree density values in different Oak forests, whereas highly significant difference (F=12.764, p=0.0001) was observed between TBC values in all the three oak forest types. The other stat- istical values (ANOVA) of overstorey and understorey veg- etation for various ecological variables/parameters are given in Table 1. The tree seedling density in this study was re- corded in the range of 30571 (FT1) to 46167 seedlings ha-1 (FT3). Rawal et al. (2012) have reported 5,800-13,200 seedlings ha-1 (Q. leucotrichophora forest), 10,133-21,867 seedlings ha-1 (Q. floribunda forest), and 267-933 seed- lings ha-1 (Q. semecarpifolia forest) in various Oak forests.
Greater tree density (607 trees ha-1) and sapling density (2,787 saplings ha-1) in FT2 (between 2,430-2,697 m asl) have indicated good regeneration and growth of species in moderate environmental conditions. Mild disturbance has also been reported to provide greater opportunities for spe- cies turnover, established colonization and persistence of
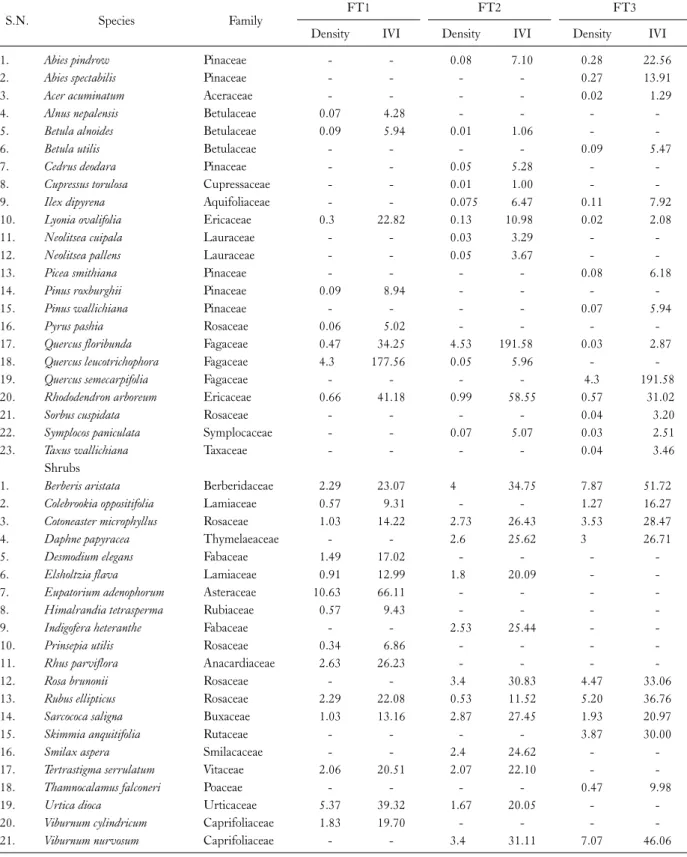
Table 2. Density (plant/100 m2) and importance value index (IVI) of important species in different oak forests
S.N. Species Family FT1 FT2 FT3
Density IVI Density IVI Density IVI
1. Abies pindrow Pinaceae - - 0.08 7.10 0.28 22.56
2. Abies spectabilis Pinaceae - - - - 0.27 13.91
3. Acer acuminatum Aceraceae - - - - 0.02 1.29
4. Alnus nepalensis Betulaceae 0.07 4.28 - - - -
5. Betula alnoides Betulaceae 0.09 5.94 0.01 1.06 - -
6. Betula utilis Betulaceae - - - - 0.09 5.47
7. Cedrus deodara Pinaceae - - 0.05 5.28 - -
8. Cupressus torulosa Cupressaceae - - 0.01 1.00 - -
9. Ilex dipyrena Aquifoliaceae - - 0.075 6.47 0.11 7.92
10. Lyonia ovalifolia Ericaceae 0.3 22.82 0.13 10.98 0.02 2.08
11. Neolitsea cuipala Lauraceae - - 0.03 3.29 - -
12. Neolitsea pallens Lauraceae - - 0.05 3.67 - -
13. Picea smithiana Pinaceae - - - - 0.08 6.18
14. Pinus roxburghii Pinaceae 0.09 8.94 - - - -
15. Pinus wallichiana Pinaceae - - - - 0.07 5.94
16. Pyrus pashia Rosaceae 0.06 5.02 - - - -
17. Quercus floribunda Fagaceae 0.47 34.25 4.53 191.58 0.03 2.87
18. Quercus leucotrichophora Fagaceae 4.3 177.56 0.05 5.96 - -
19. Quercus semecarpifolia Fagaceae - - - - 4.3 191.58
20. Rhododendron arboreum Ericaceae 0.66 41.18 0.99 58.55 0.57 31.02
21. Sorbus cuspidata Rosaceae - - - - 0.04 3.20
22. Symplocos paniculata Symplocaceae - - 0.07 5.07 0.03 2.51
23. Taxus wallichiana Taxaceae - - - - 0.04 3.46
Shrubs
1. Berberis aristata Berberidaceae 2.29 23.07 4 34.75 7.87 51.72
2. Colebrookia oppositifolia Lamiaceae 0.57 9.31 - - 1.27 16.27
3. Cotoneaster microphyllus Rosaceae 1.03 14.22 2.73 26.43 3.53 28.47
4. Daphne papyracea Thymelaeaceae - - 2.6 25.62 3 26.71
5. Desmodium elegans Fabaceae 1.49 17.02 - - - -
6. Elsholtzia flava Lamiaceae 0.91 12.99 1.8 20.09 - -
7. Eupatorium adenophorum Asteraceae 10.63 66.11 - - - -
8. Himalrandia tetrasperma Rubiaceae 0.57 9.43 - - - -
9. Indigofera heteranthe Fabaceae - - 2.53 25.44 - -
10. Prinsepia utilis Rosaceae 0.34 6.86 - - - -
11. Rhus parviflora Anacardiaceae 2.63 26.23 - - - -
12. Rosa brunonii Rosaceae - - 3.4 30.83 4.47 33.06
13. Rubus ellipticus Rosaceae 2.29 22.08 0.53 11.52 5.20 36.76
14. Sarcococa saligna Buxaceae 1.03 13.16 2.87 27.45 1.93 20.97
15. Skimmia anquitifolia Rutaceae - - - - 3.87 30.00
16. Smilax aspera Smilacaceae - - 2.4 24.62 - -
17. Tertrastigma serrulatum Vitaceae 2.06 20.51 2.07 22.10 - -
18. Thamnocalamus falconeri Poaceae - - - - 0.47 9.98
19. Urtica dioca Urticaceae 5.37 39.32 1.67 20.05 - -
20. Viburnum cylindricum Caprifoliaceae 1.83 19.70 - - - -
21. Viburnum nurvosum Caprifoliaceae - - 3.4 31.11 7.07 46.06
Table 2. Continued
S.N. Species Family FT1 FT2 FT3
Density IVI Density IVI Density IVI
Herbs
1. Achyranthes aspera Amaranthaceae 82.86 16.11 - - - -
2. Agrimonia pilosa Rosaceae - - - - 56.67 13.58
3. Anaphalis tripilinervis Asteraceae - - 105 19.04 - -
4. Arisaema conicinum Araceae - - - - 68.33 15.34
5. Artemisia roxburghiana Asteraceae 17.14 8.23 - - - -
6. Aster penducularis Asteraceae - - - - 23.33 7.83
7. Bergenia ciliata Saxifragacea 40 10.03 - - - -
8. Bidens pilosa Asteraceae 82.86 16.15 - - - -
9. Bistorta amplexicaulis Polygonaceae - - 10 4.59 - -
10. Boerhavia diffusa Nyctaginaceae 22.86 6.95 - - - -
11. Calanthe plantaginea Orchidaceae 34.29 9.12 - - - -
12. Carpesium nepalenese Asteraceae 5.71 3.32 - - - -
13. Cirsium wallichii Asteraceae 62.86 13.72 - - - -
14. Duchesnea indica Rosaceae 57.14 13.46 - - - -
15. Erigeron multiradiatus Asteraceae - - 91.67 16.74 95 19.062
16. Euphorbia pilosa Euphorbiaceae - - 83.33 15.96 - -
17. Fragaria nubicola Rosaceae 100 18.54 208.33 31.09 241.67 37.23
18. Galium asperifolium Rubiaceae 22.86 6.95 - - - -
19. Gentiana pedicellata Gentianaceae - - 98.33 17.66 - -
20. Geranium nepalensis Geraniaceae 8.57 4.55 - - 23.33 9.13
21. Goodyera fusca Orchidaceae - - 48.33 11.00 - -
22. Hedychium spicatum Zingiberaceae - - 6.67 4.82 33.33 9.66
23. Hemiphragma heterophyllum Scrophulariaceae - - 81.67 15.36 145.00 25.71
24. Impatiens sulcata Balsaminaceae - - 183.33 31.19 18.33 9.30
25. Micromaria biflora Lamiaceae 28.57 8.03 - - - -
26. Ophiopogon intermidius Asparagaceae - - 10 6.98 - -
27. Origanum vulgare Lamiaceae 42.86 10.33 30 8.41 - -
28. Plantago depressa Plantaginaceae - - - - 46.67 11.95
29. Plantago himalaica Plantaginaceae - - 75 14.62 - -
30. Plectranthus japonicus Lamiaceae - - 28.33 8.06 - -
31. Potentilla fulgens Rosaceae - - 25 7.12 115 21.71
32. Primula denticulata Primulaceae - - - - 30 9.08
33. Prunella vulgaris Lamiaceae - - 60 12.60 - -
34. Pteracanthes alatus Acanthaceae - - - - 165 29.88
35. Ranunaculus arvensis Ranunculaceae 154.29 24.70 - - - -
36. Reinwardtia indica Liliaceae 162.86 25.75 - - - -
37. Rubia manjith Rubiaceae 97.14 18.13 - - - -
38. Rumex nepalensis Polygonaceae 88.57 17.14 61.67 12.83 - -
39. Senecio nudicaulis Asteraceae 82.86 17.48 - - 40 10.86
40. Sonchus brachyotus Asteraceae - - 50 11.27 55 13.33
41. Stellaria semivestita Caryophyllaceae - - 8.33 5.90 - -
42. Swertia paniculata Gentianaceae 25.71 7.49 - - - -
43. Taraxacum officinale Asteraceae - - 70 13.88 43.33 11.45
44. Thalictrum foliolosum Ranunculaceae 97.14 19.00 10 6.98 71.67 15.78
45. Trifolium rapens Fabaceae - - 28.33 8.06 15 6.43
46. Valeriana jatamansii Valerianaceae 77.14 15.24 - - - -
47. Viola pilosa Violaceae 31.43 9.59 85 15.82 121.67 22.68
FT1, forest type 1; FT2, forest type 2; FT3, forest type 3.
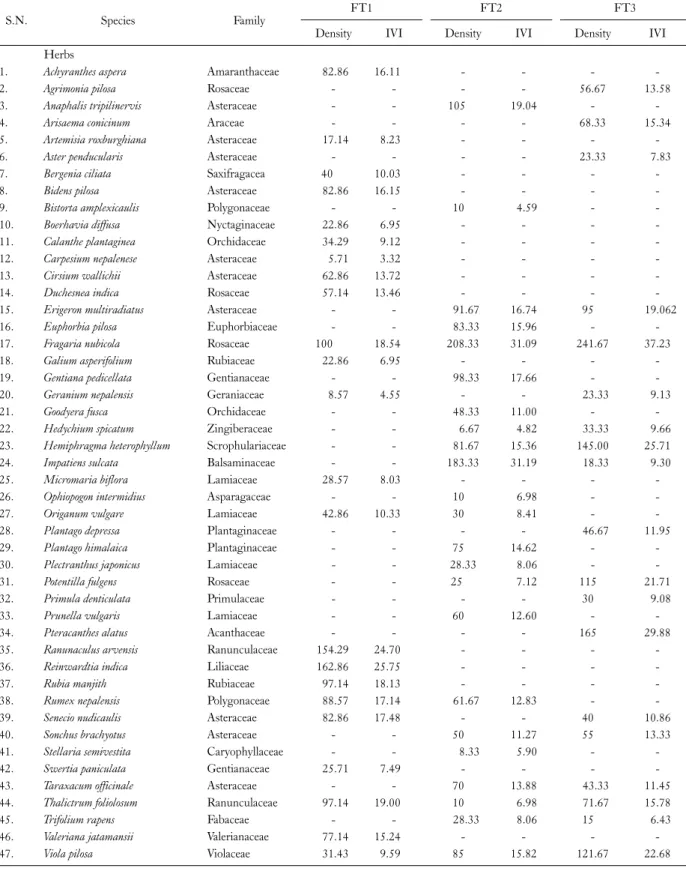
Fig. 2. (a) DBH class based distribution of density (trees ha-1) and TBC (m2 ha-1) in Q. leucotrichophora forest. (b) DBH class based distribution of density (trees ha-1) and TBC (m2 ha-1) in Q. floribunda forest. (c) DBH class based distribution of density (trees ha-1) and TBC (m2 ha-1) in Q. semecarpifolia forest.
high species richness (Rawal et al. 2012).
A total of 21 shrub species were observed in all the three Oak forest types, amongst which Eupatorium ad- enophorum (1,063 ind ha-1) was dominant in Q. leuco- trichophora forest, while Berberis aristata was dominant in Q. floribunda (400 ind ha-1) and Q. semecarpifolia (787 ind ha-1) forest types. The overall shrub density in Oak for- est types ranged between 3,000 to 3,867 shrubs ha-1. Gairola et al. (2012) reported 3,100 shrubs ha-1 in Q. seme- carpifolia forest from Garhwal Himalaya. The lowest total herb density (140,833 herbs ha-1) was recorded in FT3.
Reinwardtia indica (16,286 ind ha-1) was the dominant herb, followed by Ranunaculus arvensis (15,428 ind ha-1) and Fragaria nubicola (10,000 ind ha-1) in Q. leucotrich- ophora forest, Fragaria nubicola was dominant in Q. flo- ribunda forest (20,833 ind ha-1), followed by Impatiens sul- cata (18,333 ind ha-1), whereas Fragaria nubicola (24,167 ind ha-1) and Pteracanthes alatus (16,500 ind ha-1) were the dominant herbs in Q. semecarpifolia forest (Table 2).
Plant diversity
The understanding of forest structure and composition is a prerequisite to describe various ecological processes and also to model the functioning and dynamics of forests (Elourard et al. 1997). The nature of forest communities largely depends on the ecological characteristics of sites, species diversity and regeneration status of tree species. The species richness and diversity of trees are fundamental to to- tal forest biodiversity, because trees provide resources and habitat for almost all the species. Species richness is a sim- ple and easily interpretable indicator of biological diversity.
Diversity is usually considered as a function of the relative distribution of individuals among species, which is regu-
lated by long-term factors such as important forest covers in Himalayan region as they provide sustainable goods and services to village communities and sustain rich biodiversity.
In this study the higher Shannon diversity index value (0.62) was recorded for Q. semecarpifolia (FT3) forest, whereas lower (0.55) for Q. floribunda (FT2) forest. The recorded diversity index values were lesser to the earlier re- ported values i.e., 2.66 for Q. leucotrichophora; 2.53 for Q.
floribunda and 1.41 for Q. semecarpifolia forests (Singh and Rawat 2012), 1.2 to 2.7 for Q. floribunda forest (Kumar and Ram 2005), 0.76 to 1.50 for Q. floribunda for- est (Lodhiyal et al. 2013). However, Gairola et al. (2011) have reported the diversity index values as; 0.46 for Q. se- mecarpifolia forest and 0.49 for Q. floribunda forest, which were closer to our values. The herb diversity was more than trees and shrubs in all the Oak forests (Table 1). The even- ness in tree layer was found highest (0.28) for Q. leuco- trichophora forest (Table 1).
In shrub layer highest value (1.07) of species diversity was recorded in FT2 and lowest (0.96) in FT3 whereas, the highest value of Simpson’s Index (0.12) was achieved for FT3 and lowest 0.09 for FT2. Malik and Bhatt (2015) also reported higher shrub diversity (3.53-3.34) at mid altitudes (between 2,250-2,600 m asl) for mixed Oak forests. High species richness with generally overlapping niches may be due to higher diversity which always oozes higher stability (Kharkwal 2009). Higher diversity in shrub layer in FT2 and FT1 may be a consequence of moderate disturbance which gave birth to a variety of micro-site. In herb layer highest species diversity (1.32) was recorded in FT1 and lowest (1.23) in FT3 which clearly indicated that the high mountain ridge top forests of Q. semecarpifolia (occurring between 2,418-3,540 m asl) were unable to support the
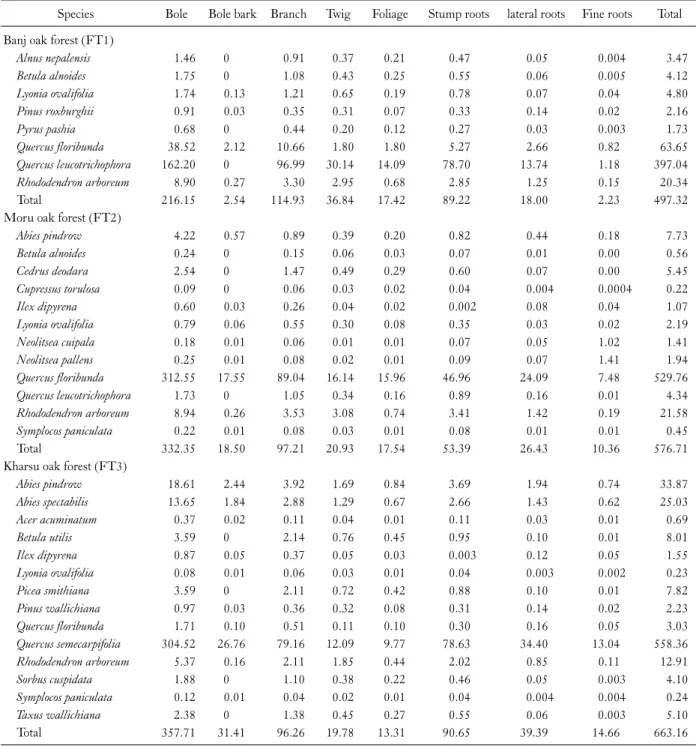
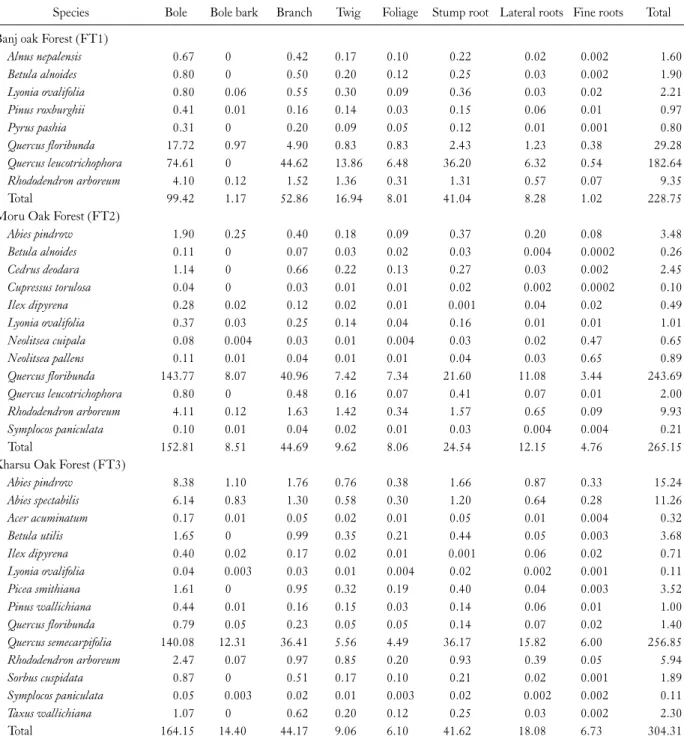
Table 3. Component-wise biomass (t ha-1) of tree layer in oak dominated ridge forests of high mountain of Garhwal Himalaya
Species Bole Bole bark Branch Twig Foliage Stump roots lateral roots Fine roots Total Banj oak forest (FT1)
Alnus nepalensis 1.46 0 0.91 0.37 0.21 0.47 0.05 0.004 3.47
Betula alnoides 1.75 0 1.08 0.43 0.25 0.55 0.06 0.005 4.12
Lyonia ovalifolia 1.74 0.13 1.21 0.65 0.19 0.78 0.07 0.04 4.80
Pinus roxburghii 0.91 0.03 0.35 0.31 0.07 0.33 0.14 0.02 2.16
Pyrus pashia 0.68 0 0.44 0.20 0.12 0.27 0.03 0.003 1.73
Quercus floribunda 38.52 2.12 10.66 1.80 1.80 5.27 2.66 0.82 63.65
Quercus leucotrichophora 162.20 0 96.99 30.14 14.09 78.70 13.74 1.18 397.04
Rhododendron arboreum 8.90 0.27 3.30 2.95 0.68 2.85 1.25 0.15 20.34
Total 216.15 2.54 114.93 36.84 17.42 89.22 18.00 2.23 497.32
Moru oak forest (FT2)
Abies pindrow 4.22 0.57 0.89 0.39 0.20 0.82 0.44 0.18 7.73
Betula alnoides 0.24 0 0.15 0.06 0.03 0.07 0.01 0.00 0.56
Cedrus deodara 2.54 0 1.47 0.49 0.29 0.60 0.07 0.00 5.45
Cupressus torulosa 0.09 0 0.06 0.03 0.02 0.04 0.004 0.0004 0.22
Ilex dipyrena 0.60 0.03 0.26 0.04 0.02 0.002 0.08 0.04 1.07
Lyonia ovalifolia 0.79 0.06 0.55 0.30 0.08 0.35 0.03 0.02 2.19
Neolitsea cuipala 0.18 0.01 0.06 0.01 0.01 0.07 0.05 1.02 1.41
Neolitsea pallens 0.25 0.01 0.08 0.02 0.01 0.09 0.07 1.41 1.94
Quercus floribunda 312.55 17.55 89.04 16.14 15.96 46.96 24.09 7.48 529.76
Quercus leucotrichophora 1.73 0 1.05 0.34 0.16 0.89 0.16 0.01 4.34
Rhododendron arboreum 8.94 0.26 3.53 3.08 0.74 3.41 1.42 0.19 21.58
Symplocos paniculata 0.22 0.01 0.08 0.03 0.01 0.08 0.01 0.01 0.45
Total 332.35 18.50 97.21 20.93 17.54 53.39 26.43 10.36 576.71
Kharsu oak forest (FT3)
Abies pindrow 18.61 2.44 3.92 1.69 0.84 3.69 1.94 0.74 33.87
Abies spectabilis 13.65 1.84 2.88 1.29 0.67 2.66 1.43 0.62 25.03
Acer acuminatum 0.37 0.02 0.11 0.04 0.01 0.11 0.03 0.01 0.69
Betula utilis 3.59 0 2.14 0.76 0.45 0.95 0.10 0.01 8.01
Ilex dipyrena 0.87 0.05 0.37 0.05 0.03 0.003 0.12 0.05 1.55
Lyonia ovalifolia 0.08 0.01 0.06 0.03 0.01 0.04 0.003 0.002 0.23
Picea smithiana 3.59 0 2.11 0.72 0.42 0.88 0.10 0.01 7.82
Pinus wallichiana 0.97 0.03 0.36 0.32 0.08 0.31 0.14 0.02 2.23
Quercus floribunda 1.71 0.10 0.51 0.11 0.10 0.30 0.16 0.05 3.03
Quercus semecarpifolia 304.52 26.76 79.16 12.09 9.77 78.63 34.40 13.04 558.36
Rhododendron arboreum 5.37 0.16 2.11 1.85 0.44 2.02 0.85 0.11 12.91
Sorbus cuspidata 1.88 0 1.10 0.38 0.22 0.46 0.05 0.003 4.10
Symplocos paniculata 0.12 0.01 0.04 0.02 0.01 0.04 0.004 0.004 0.24
Taxus wallichiana 2.38 0 1.38 0.45 0.27 0.55 0.06 0.003 5.10
Total 357.71 31.41 96.26 19.78 13.31 90.65 39.39 14.66 663.16
herbs as well as shrubs growth. Restricted shrub growth (lower diversity) in FT3 at higher altitudes may also be due to harsh climatic conditions. The Similarity Index value was highest (53.05%) with least value of -diversity (1.05) for the shrub layer, however, minimum value of Similarity Index (27.73%) was recorded for sapling layer, where the
highest -diversity (2.63) persisted, which has revealed that the species were more similar in shrub strata than in other studied vegetation layers (Table 1).
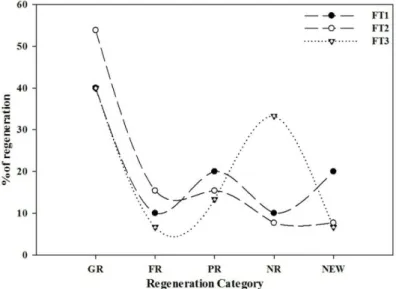
Population structure and regeneration status In all the oak forest types, maximum number of in-
Fig. 3. Graphical representation of regeneration percentage in differ- ent Oak forest.
dividuals were recorded in 21-40 cm dbh class i.e., in FT1 (67.8%); FT2 (71.7%) and FT3 (48.7%), followed by 13.3% and 34.2% in dbh class 41-60 cm in FT1 and FT3 respectively, whereas in FT2, 16.8% individuals were ob- served in <20 cm dbh class, which may be considered as immature regenerating forest (Fig. 2). Dimri et al. (2014) also reported higher altitudinal Q. semecarpifolia forests as old growth forests (Individuals found above 100cm dbh class), and Q. leucotrichophora and Q. floribunda forests as young regenerating forests (higher number of in- dividuals in lower dbh classes).
In Quercus leucotrichophora forest (FT1) most of the tree species (40%) exhibited good regeneration, followed by poor regeneration and new recruitment (20%) and fair and not regenerating (10%) (Fig. 3). Q. leucotrichophora, L.
ovalifolia, R. arboreum and P. pashia indicated good regen- eration on the ridge tops situated between 1,428-2,578 m asl. In FT1 Ilex dipyrena and Neolitsea cuipala were repre- sented by seedlings only and therefore observed to be new on lower altitudinal ridge tops. Betula alnoides (9 ind ha-1) on the other hand was represented in tree stage only in FT1 as well as in FT2 and its seedlings and saplings were absent completely, which means it was not reproducing. Benton and Werner (1976) suggested that such type of population could become extinct if the tendency continues. Alnus nep- alensis and Pinus roxburghii showed poor regeneration due to weak adaptation on ridge tops of FT1.
In Quercus floribunda forest (FT2), 54% of the tree species indicated good regeneration, 15% as poor and 8%
were not regenerating. Lindera pulcherrima (7 ind ha-1) was the only new recruitment in this forest type between the altitudes 2,430-2,697 m asl. Therefore compositional changes are expected in this forest type in near future.
In Quercus semecarpifolia (FT3), 40% tree species showed good regeneration, whereas Acer acuminatum, Lyonia ova- lifolia, Quercus floribunda, Sorbus cuspidata and Taxus wallichiana together constituted the not regenerating cat- egory, including 33% tree species (which is highest amon- gst all the three forest types). This is a cause of concern be- cause climatic conditions were not suitable for these species on high mountain ridges and therefore they were not re- producing (their population may become extinct in near fu- ture). Prunus cornuta was the new recruitment in high alti- tudinal Oak forests, because it was observed in seedling and sapling stages only (it may establish itself in Q. semecarpi- folia forest in due course of time to become canopy or sub-canopy species). It was clear from the regeneration pat- tern of studied ridge Oak forests that only mid altitudinal transects exhibited good regeneration potential and sub- sequently it decreased with increasing altitudes.
Biomass and carbon storage
The quantification of biomass in forest ecosystems is a primary inventory data required for efficient forest manage-
ment (Hall et al. 2006) to understand carbon pool changes and productivity of forests. Biomass assessment is also nec- essary because forest is affected by various factors such as deforestation, fire, harvesting, pests, silviculture and cli- mate change (Schroeder et al. 1997), which cause changes in the forest ecosystem. Stem wood proved to be the most massive component among trees than stem bark, coarse root, branches and foliage. Biomass is a function of diame- ter at breast height (DBH), height (ht) and wood density in a given location. However, the contribution of these varia- bles to the above ground biomass (AGB) differs from site to site, succession stage of the forest, distribution level, spe- cies composition etc. (Whitmore 1984). Live tree biomass estimates are essential for carbon accounting, bio-energy feasibility studies and other analyses.
The biomass production in all the Quercus forests oscil- lated from 497.32±83.70 t ha-1 (Q. leucotrichophora for- est) to 663.16±93.85 t ha-1 (Q. semecarpifolia forest). The above-ground biomass contributed 78% to 84% of the total tree biomass in these forests. Our values are best fitted with the previously reported values for biomass production i.e., 387.3 Mg ha-1 for Q. leucotrichophora forest at 1,950 m asl by Rawat and Singh (1988); 782 Mg ha-1 for Q. floribunda forest at 2,200 m asl by Rana et al. (1989); and 590.2 Mg ha-1 for Q. semecarpifolia forest at 2,650 m asl by Adhikari et al. (1995). On the other hand somewhat lesser values i.e., 215.5 Mg ha-1 for mixed Q. leucotrichophora forest at 1,500-1,650 m asl; 429.7 Mg ha-1 for mainly Q. floribunda forest at 2,550-2,650 m asl; and 389.5 Mg ha-1 for mainly Q. semecarpifolia forest at 2,650-2,850 m asl were also re- ported by Gairola et al. (2011) for Oak mixed forests.
However, the biomass production of 272.5 Mg ha-1 for Q.
leucotrichophora forest; 511.2 Mg ha-1 for Q. floribunda forest, and 507.8 Mg ha-1 for Q. semecarpifolia forest was observed by Dimri et al. (2016). Singh et al. (1994) have reported a high range of biomass (500-600 Mg ha-1) in Oak forests from Kumaun Himalaya. The bole biomass contributed maximum in Q. leucotrichophora forest (43.46%) and Q. semecarpifolia forest (57.63%). The maximum branch biomass (23.11%) was recorded in FT1 whereas, minimum (14.51%) in FT3. Fine roots contributed the minimum (0.45 to 2.21%) of total biomass in all the forest types (Table 3). In FT1, the Q. leucotrichophora con- tributed maximum (79.84%) to the total forest biomass, fol-
lowed by Q. floribunda (12.80%) and R. arboreum (4.09%).
Percent contribution of bole, branches, twigs and foliage of Q. leucotrichophora to the total forest AGBD was 41.82%, 25.01%, 7.77% and 3.65% respectively and the to- tal AGBD of Q. leucotrichophora was 61.01% of the total forest biomass density. In FT2 bole, bole bark, branches, twigs and foliage of Q. floribunda contributed 64.24%, 3.61%, 18.30%, 3.32% and 9.65% to the total AGBD re- spectively, however 78.24% was contributed by AGBD of Q. floribunda to the total forest biomass density. In FT3, bole, bole bark, branches, twigs and foliage of Q. seme- carpifolia accounted 58.74%, 5.16%, 15.27%, 2.33% and 1.88% respectively to the total AGBD of the forest. The AGBD of Q. semecarpifolia contributed 65.19% to total forest biomass density (Table 3).
The bole biomass of Q. leucotrichophora contributed 41.82% to the total above ground biomass of all the species in FT1. The recorded values were best fitted with the re- ported values of bole biomass (36.6 to 60.7% by Negi et al.
1983). In FT2 the Q. floribunda contributed significantly (91.86%) to the total forest biomass, followed by R. arbor- eum (3.74%). The percent contribution of bole and branch biomass of Q. floribunda to the total above ground biomass density was 64.24% and 18.30% respectively (Table 3).
Negi et al. (1983) reported 34.2% to 60.2% contribution of bole and 21.3% to 35.6% of branch biomass for the temper- ate forest of Kumaun Himalaya. In FT3 the contribution of Q. semecarpifolia to the total biomass density was 84.20%.
The percent contribution of bole biomass of Q. semecarpi- folia to the total forest biomass was 58.74% (Table 3). Thus the biomass production of different components im each forest type followed the following order:
FT1: Bole>branch>stump roots>twig>lateral roots
>foliage>bole bark>fine roots.
FT2: Bole>branch>stump roots>lateral roots>twig
>bole bark>foliage>fine roots and
FT3: Bole>branch>stump roots>lateral roots>bole bark>twig>fine roots>foliage.
In this study we have observed that the composition of conifers species increased with increasing altitude. Therefore, in the higher altitudinal Q. semecarpifolia forests more con- iferous species (05) were encountered, which had lesser twig/ crown expanse. The Q. floribunda forests had three coniferous species whereas in Q. leucotrichophora forest