Ultrasonography in the Diagnosis of
Appendicitis: Evaluation by Meta-analysis
Objective: We wanted to review the usefulness of ultrasonography (US) for the diagnosis of appendicitis and to evaluate the diagnostic accuracy of US accord- ing to patients’ and researchers’ characteristics.
Materials and Methods: The relevant Korean articles published between 1985 and 2003 were included in this study if the patients had clinical symptoms of acute appendicitis. The histopathologic findings were the reference standard and the data were presented for 2 2 tables. Articles were excluded if patients had no sonographic signs of appendicitis according to graded-compression US. Two reviewers independently extracted the data on study characteristics. The Hasselblad method was used to obtain the combined estimates of sensitivity and specificity for the performance of US.
Results: Twenty-two articles (2,643 patients) fulfilled all inclusion criteria. The estimate of calculated by combining the sensitivity and specificity was 2.0054 (95% confidence interval [CI]: 1.8553, 2.1554) by a random effects model. The overall sensitivity and specificity (95% CI) were 86.7% (85.4 to 88.0), and 90.0%
(88.9 to 91.2), respectively. According to the subgroup meta-analysis by patients’
characteristics, the estimate (95% CI) of dominantly younger age, male, and highly clinical suggestive group for US was 2.2388 (1.8758 to 2.6019), 2.7131 (2.2493 to 3.1770), and 2.4582 (1.7387 to 3.1777), respectively. Also, according to subgroup meta-analysis by researchers’ characteristics, the value (95% CI) for US done by diagnostic radiologists and gray-scale was 2.0195 (1.7942 to 2.2447) and 2.2630 (1.8444 to 2.6815).
Conclusion: This evidence suggests that US may be useful for the diagnosis of acute appendicitis, especially when patients are younger age, male, and highly clinical suggestive.
ver since inflamed appendix was initially demonstrated by ultrasonography (US) in 1981 (1), graded-compression ultrasonography by Puylaert (2) has been widely used for the past two decades as an aid to clinically diagnose acute appendicitis. The use of US for evaluating the patient clinically suspected of having appendicitis has been extensively reported on in the literature (3 24). However, there has been deal of great variability in the reported performance of US for the diagnosis of appendicitis. While the range of reported accuracy (82% 96%) for US in children has been acceptable (3, 5, 9, 11, 19), the sensitivity (44% to 100%) and the specificity (47%
to 99%) have varied considerably (4, 6 8, 10, 13 15, 18, 21 22). Also, the visualiza- tion rates vary widely in the published literature, from a low of 22% to a high of 98%
(13, 15). Various factors might be considered as the causes of these variations. Because US is highly user-dependent, operator skill may be an important factor in the diagnostic Seung-Hum Yu, MD1,3
Chun-Bae Kim, MD4,6 Joong Wha Park, MD5 Myoung Soo Kim, MD2 David M. Radosevich, PhD6,7
Index terms : Abdomen, US Appendicitis Ultrasound (US) Meta-analysis
Korean J Radiol 2005 ; 6 : 267-277 Received April 15, 2005; accepted after revision June 1, 2005.
Departments of 1Preventive Medicine &
Public Health and 2Surgery, Yonsei University College of Medicine, 3Institute for Health Services Research, Yonsei University; Departments of 4Preventive Medicine and 5Diagnostic Radiology, Yonsei University Wonju College of Medicine; 6Clinical Outcomes Research Center, University of Minnesota School of Public Health; 7Transplant Information Services, University of Minnesota
Address reprint requests to : Chun-Bae Kim, MD, PhD, Department of Preventive Medicine, Yonsei University Wonju College of Medicine, 162 IIsan- dong, Wonju, Kangwon-do, 220-701, Korea.
Tel. (8233) 741-0344 Fax. (8233) 747-0409
e-mail: [email protected]
E
accuracy of appendicitis (14, 21, 25). Also, patient age or sex-based differences in the diagnosis of appendicitis with using some clinical presentations alone may be observed in the elder or female patients because of the broad overlap of the symptoms for acute abdominal conditions (including gynecologic abnormalities) (26 27). Especially because of the inability to compress the right lower quadrant (RLQ), particularly in obese patients, or because of a retrocecal location of the appendix, US could not appropriately visual- ize the appendix. Thus, most of the false-negative diagnoses with using US result from non-visualization of the appendix or from inflammation limited to the appendiceal tip (7, 28 30).
Meta-analysis is the critical review and statistical combina- tion and evaluation of the results of previous research, and this is potentially useful for assessing diagnostic accuracy (31 32). Some meta-analyses related to the diagnostic methods used for appendicitis have been conducted (33 37). Among these, 3 studies have addressed the clinical outcomes of US for the diagnosis of appendicitis (33, 35, 37). In a landmark 1995 article by Orr et al. (33), an overall sensitivity of 84.7% and a specificity of 92.1% were reported for US by using meta-analysis of the previous pediatric and adult studies (17 studies, 3,358 patients), that were published between 1986 and 1994. In that meta- analysis, the accuracy and usefulness of US were related to the likelihood of appendicitis. However, no systematic quantitative overview about the diagnostic accuracy of US, according to the researchers’ and patients’ factors, has been undertaken to date. Therefore, the objective of this study was to determine the usefulness of US for evaluating abdominal pain patients in Korea who had possible acute appendicitis, and to evaluate the diagnostic performance of US according to the patients’ and researchers’ characteristics with using meta-analysis method.
MATERIALS AND METHODS
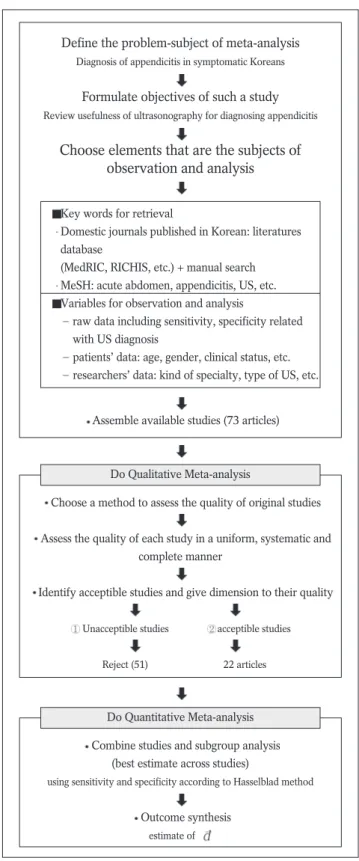
The flow chart of the meta-analysis in this study is shown in Fig. 1. This process consisted of the retrieval of the relevant literature according to the goals that were set, and
then performing qualitative1and quantitative2meta- analysis (38 40).
Gathering of Data
The first search step was to examine not only the journal database sites such as the Medical Research Information
1 The extent to which the primary research met methodological standards (or quality) is important not only per se for assessing the strength of any conclusions that are reached, but also for possibly explaining the differences in results.
2 It means synthesis of results from individual studies (quantita- tive systemic review or meta-analysis) and exploration of the variation in the results from study to study (homogeneity test) and the generation of the most useful combination of tests. It is especially important to evaluate the statistical heterogeneity of the treatment effect that exists among the different sets of data before combining any data.
Define the problem-subject of meta-analysis
Diagnosis of appendicitis in symptomatic Koreans
Formulate objectives of such a study
Review usefulness of ultrasonography for diagnosing appendicitis
Choose elements that are the subjects of observation and analysis
Assemble available studies (73 articles)
Choose a method to assess the quality of original studies
Assess the quality of each study in a uniform, systematic and complete manner
Identify acceptible studies and give dimension to their quality Unacceptible studies acceptible studies
Reject (51) 22 articles
Combine studies and subgroup analysis (best estimate across studies)
using sensitivity and specificity according to Hasselblad method
Outcome synthesis estimate of Key words for retrieval
Domestic journals published in Korean: literatures database
(MedRIC, RICHIS, etc.) + manual search MeSH: acute abdomen, appendicitis, US, etc.
Variables for observation and analysis
raw data including sensitivity, specificity related with US diagnosis
patients’ data: age, gender, clinical status, etc.
researchers’ data: kind of specialty, type of US, etc.
Do Qualitative Meta-analysis
Do Quantitative Meta-analysis
Fig. 1. Flow chart of meta-analysis in this study.
Center (http://www.medric.or.kr/) and the Research Information Center for Health (http://www.richis.org), but also the journal search window of homepages such as the Korean Radiological Society (http://www.radiology.or.kr/), the Korean Society of Medical Ultrasound
(http://www.ultrasound.or.kr/), and the Korean Surgical Society (http://www.surgery.or.kr/) from 1985 to 2003.
The second step involved a manual search of the contents and the bibliographies cited in each of the retrieved study.
The medical subject headings used for this search were acute abdomen, appendix, appendicitis, diagnosis and ultrasound or ultrasonography (or US).
Qualitative Meta-analysis
A total of 73 Korean articles that contained information on ultrasonography for the diagnosis of acute appendicitis were selected. A diagnostic radiologist and a meta-analyst independently extracted the outcome variables of the individual articles onto a data sheet; disagreements were resolved by discussion or by cross-checking with the other co-workers. A systemic review team consisted of a diagnostic radiologist (for data extraction and clinical interpretation of the study results), a surgeon (for study selection and the clinical interpretation of the study results), a biostatistician (for data synthesis and analysis), and two meta-analysts (for the study design, the assess- ment of study quality and the statistical interpretation of the study results). A systematic literature review was conducted based on the previously suggested meta-analysis evaluation guidelines (40). The criteria for quality evalua- tion were as follows. 1) Only original articles were included. 2) Patients must have the predominant clinical findings for acute appendicitis. These clinical findings were mainly RLQ abdominal pain and RLQ tenderness or RLQ rebound tenderness. 3) The disease positive group within the studies must certainly include the histopathologic findings as a reference standard to confirm appendicitis, but the disease negative group could be confirmed by the surgical results or the clinical follow-up. The inflamed appendix was assessed by high-resolution, real time US according to the graded-compression method (2). The US criteria (41 42) for the diagnosis of appendicitis were an appendiceal diameter greater than 6 mm, a lack of
compressibility, inflammation, echogenic periappendiceal fat, appendicolith, adjacent fluid collections (and
hyperemia on color Doppler imaging). This study included the articles that presented over three of the US criteria in the materials and methods section of each study. Also, sufficient or available numeric information such as a 2 2 contingency table for data or the patient outcome data (sensitivity and/or specificity with the absolute numbers of positive and negative findings or the standard errors) of the US testing were contained in our inclusion criteria. Of the 33 articles evaluated at the final stage, 22 studies that had extensively used US for the diagnosis of acute appendicitis met these inclusion criteria; thus, all these were selected for the quantitative meta-analysis.
Quantitative Meta-analysis
The Hasselblad method with the SAS program was utilized for analyzing the contingency tables in this quanti- tative meta-analysis (43 44). The estimate of and the 95% confidence intervals (CIs) were estimated using the sensitivity and specificity for each of the study’s outcome data. The measure used in this study is analogous to the effect-size measure described for continuous-outcome measures as a more simple calculation. Homogeneity testing was done to test whether the effect size parameters were reasonably constant across the studies (43). Because there was evidence of heterogeneity (Q = 111.913, p-value
0.001), a random effects model was used instead of a fixed effects model.
Subgroup analyses (39, 45) were performed to provide further insight into the heterogeneity. Additionally we calculated the likelihood ratio for a positive US result3(46).
According to the literature review (18, 25, 26, 33, 35, 37, 47 50) and the results of the qualitative meta-analysis about the factors related to US accuracy for the diagnosis of appendicitis, we classified the subgroup criteria as the characteristics of the patients or the researcher. The patient characteristics included age, gender and the clinical status.
Among these, the age and gender groups were classified as three age groups (young, adult and older) and two gender (male and female) dominant groups according to the weight (the percentage points). This was done by consen- sus of the systemic review team because of secondary aggregating data and the insufficient information concern- ing these variables in each study. The researcher character- istics included the sonographic examiner, the type of US and the diagnostic method. On the basis of the clinical presentations before the imaging test, we categorized the diagnostic method into two groups: the clinical examina- tion (by the initial physical examination, the diagnostic scoring system4or leukocytosis) and the US examination.
3 Likelihood ratio for a positive US result = Sensitivity / (1 - Specificity)
4 The modified diagnostic score was based the 1994 recommenda- tions of the European Society of Surgery (age 50 years; 1.5, steady pain in the right low quadrant; 2, pain relocation to the RLQ; 2, tenderness in the RLQ; 2.5, rebound tenderness; 2.5, rigidity; 1, Rovsing sign; 2, Rosenstein sign; 2, and leukocyte 10,000/mm3; 1.5) (66)
RESULTS
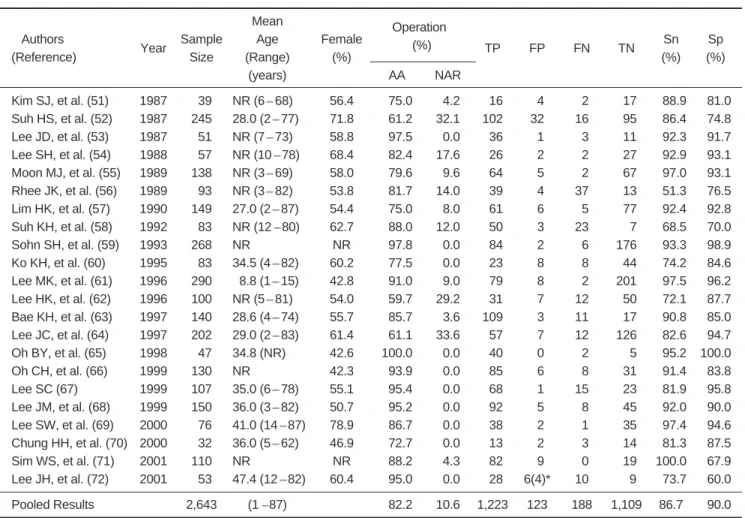
The general characteristics of the 22 studies (51 72) used for this meta-analysis are summarized in Table 1. A total of 2,643 patients with right lower quadrant abdomi- nal pain underwent graded-compression US for the diagno- sis of acute appendicitis. Of the 2,643 patients, 1,717 (65.0%) were treated by operational appendectomy (OA), and clinical follow-up without any surgical intervention was performed on 926 patients (35.0%). Among the OA patients, 1,411 patients (82.2%) with a wide range (59.7% 100.0%), according to the individual study had been pathologically diagnosed as having acute appendicitis with/without periappendiceal abscess or perforated appendicitis. One hundred eighty-three patients (10.6%) with a limited range (0.0% 33.6%), had a normal appendix (negative appendectomy rate). The other patients (7.2%) had right ovarian cyst, endosalpingosis,
ectopic pregnancy, ascending colon cancer and acute peritonitis, etc. The age range of patients was 1-87 years.
One study (61) was conducted upon children only, and the other studies involved all age groups. The proportion of females ranged from 42.3% to 78.9%. Most of the first authors (among the coauthors) were diagnostic radiologists (in 12 studies), 7 studies were conducted by surgeons and the other studies (n = 3) were conducted by pediatricians or emergency physicians. Among those, 8 studies (51 53, 56, 59 61, 68) also had diagnostic radiologists, surgeons and pediatricians or internal physicians involved in them.
Also, the sonographic examiners5were clearly described in 12 studies (58 59, 62 65, 67 72). It should be noted that diagnostic radiologists were not coauthors, but the sonographic examiners were in 4 studies (58, 62 63, 72).
The sensitivity and specificity of the graded-compression US tests that were used for the diagnosis of acute
appendicitis in each of the 22 studies are listed in Table 1.
When the US appendiceal (a diameter enlarged to 6 mm or
Table 1. General Characteristics and Outcomes of Graded-compression Ultrasonography (US) for the Diagnosis of Acute Appendicitis by Study (n = 22)
Unit: Patient Mean
Authors
Year Sample Age Female Operation
TP FP FN TN Sn Sp
(Reference) Size (Range) (%) (%)
(%) (%)
(years) AA NAR
Kim SJ, et al. (51) 1987 039 NR (6 68) 56.4 075.0 04.2 016 04 02 017 088.9 081.0 Suh HS, et al. (52) 1987 245 28.0 (2 77) 71.8 061.2 32.1 102 32 16 095 086.4 074.8 Lee JD, et al. (53) 1987 051 NR (7 73) 58.8 097.5 00.0 036 01 03 011 092.3 091.7 Lee SH, et al. (54) 1988 057 NR (10 78) 68.4 082.4 17.6 026 02 02 027 092.9 093.1 Moon MJ, et al. (55) 1989 138 NR (3 69) 58.0 079.6 09.6 064 05 02 067 097.0 093.1 Rhee JK, et al. (56) 1989 093 NR (3 82) 53.8 081.7 14.0 039 04 37 013 051.3 076.5 Lim HK, et al. (57) 1990 149 27.0 (2 87) 54.4 075.0 08.0 061 06 05 077 092.4 092.8 Suh KH, et al. (58) 1992 083 NR (12 80) 62.7 088.0 12.0 050 03 23 007 068.5 070.0
Sohn SH, et al. (59) 1993 268 NR NR 097.8 00.0 084 02 06 176 093.3 098.9
Ko KH, et al. (60) 1995 083 34.5 (4 82) 60.2 077.5 00.0 023 08 08 044 074.2 084.6 Lee MK, et al. (61) 1996 290 08.8 (1 15) 42.8 091.0 09.0 079 08 02 201 097.5 096.2 Lee HK, et al. (62) 1996 100 NR (5 81) 54.0 059.7 29.2 031 07 12 050 072.1 087.7 Bae KH, et al. (63) 1997 140 28.6 (4 74) 55.7 085.7 03.6 109 03 11 017 090.8 085.0 Lee JC, et al. (64) 1997 202 29.0 (2 83) 61.4 061.1 33.6 057 07 12 126 082.6 094.7 Oh BY, et al. (65) 1998 047 34.8 (NR) 42.6 100.0 00.0 040 00 02 005 095.2 100.0
Oh CH, et al. (66) 1999 130 NR 42.3 093.9 00.0 085 06 08 031 091.4 083.8
Lee SC (67) 1999 107 35.0 (6 78) 55.1 095.4 00.0 068 01 15 023 081.9 095.8
Lee JM, et al. (68) 1999 150 36.0 (3 82) 50.7 095.2 00.0 092 05 08 045 092.0 090.0 Lee SW, et al. (69) 2000 076 41.0 (14 87) 78.9 086.7 00.0 038 02 01 035 097.4 094.6 Chung HH, et al. (70) 2000 032 36.0 (5 62) 46.9 072.7 00.0 013 02 03 014 081.3 087.5
Sim WS, et al. (71) 2001 110 NR NR 088.2 04.3 082 09 00 019 100.0 067.9
Lee JH, et al. (72) 2001 053 47.4 (12 82) 60.4 095.0 00.0 028 6(4)* 10 0v9 073.7 060.0
Pooled Results 2,643 (1 87) 082.2 10.6 1,223 123 188 1,109 86.7 090.0
Note. AA = acute appendicitis, NAR = negative appendectomy rate, TP = true positive, FP = false positive, FN = false negative, TN = true negative, Sn = sensitivity, Sp = specificity, NR = not reported
* Among 6 cases, 4 cases were finally diagnosed by clinical follow-up and computed tomography.
greater, intraluminal fluid and lack of compressibility) and periappendiceal (periileal inflammatory changes, cecal wall thickening, periileal lymph nodes and peritoneal fluid) evaluations were included as diagnostic criteria, the overall sensitivity was 86.7% (95% CI: 85.4, 88.0) with a range from 51.3% to 100.0%. Also, the overall specificity was 90.0% (95% CI: 88.9, 91.2) with a range from 60.0% to 100.0%, and each parameter was widely scattered. Thus, on a quantitative meta-analysis using the Hasselblad method (43), the estimate of 6for the US was 2.0054 (95% CI: 1.8553, 2.1554), so using the graded-compres- sion US for the diagnosis of acute appendicitis was judged to be effective (Tables 2, 3).
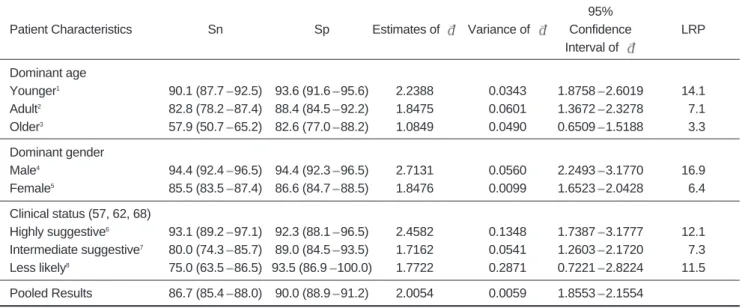
The results of the subgroup meta-analysis by the patients characteristics are shown in Table 2. For the studies of the younger-age dominant group, the overall sensitivity and specificity (95% CI) of graded-compression
US were 90.1% (87.7 to 92.5) and 93.6% (91.6 to 95.6), respectively. The likelihood ratio (LR) for a positive US result in younger-age dominant groups was 14.1 and it was higher than those (7.1 or 3.3) in adult or older-age
dominant groups. For the studies of the male dominant group, the overall sensitivity and specificity (95% CI) of graded-compression US were 94.4% (92.4 to 96.5) and 94.4% (92.3 to 96.5), respectively. The LR for a positive US result in the male dominant groups was 16.9 and it was higher than that (6.4) in the female dominant groups. Also, when the studies included the highly clinical suggestive groups (57, 62, 68), the overall sensitivity and specificity (95% CI) of the graded-compression US were 93.1% (89.2 to 97.1) and 92.3% (88.1 to 96.5), respectively. The LR for a positive US result in the highly clinical suggestive group was 12.1. These estimates of the younger age, male and high-clinical status dominant groups for the graded- compression US were 2.2388 (95% CI: 1.8758, 2.6019), 2.7131 (95% CI: 2.2493, 3.1770), and 2.4582 (95% CI:
1.7387, 3.1777), respectively. Thus, the graded-compres- sion US effectively influences the diagnosis of acute appendicitis when the above-mentioned factors are present in the patients characteristics.
According to the results of the subgroup meta-analysis
Table 2. Subgroup Meta-analysis Results of Graded-compression US for the Diagnosis of Acute Appendicitis by the Patients’
Characteristics of Study
95%
Patient Characteristics Sn Sp Estimates of Variance of Confidence LRP
Interval of Dominant age
Younger1 90.1 (87.7 92.5) 93.6 (91.6 95.6) 2.2388 0.0343 1.8758 2.6019 14.1
Adult2 82.8 (78.2 87.4) 88.4 (84.5 92.2) 1.8475 0.0601 1.3672 2.3278 07.1
Older3 57.9 (50.7 65.2) 82.6 (77.0 88.2) 1.0849 0.0490 0.6509 1.5188 03.3
Dominant gender
Male4 94.4 (92.4 96.5) 94.4 (92.3 96.5) 2.7131 0.0560 2.2493 3.1770 16.9
Female5 85.5 (83.5 87.4) 86.6 (84.7 88.5) 1.8476 0.0099 1.6523 2.0428 06.4 Clinical status (57, 62, 68)
Highly suggestive6 93.1 (89.2 97.1) 92.3 (88.1 96.5) 2.4582 0.1348 1.7387 3.1777 12.1 Intermediate suggestive7 80.0 (74.3 85.7) 89.0 (84.5 93.5) 1.7162 0.0541 1.2603 2.1720 07.3 Less likely8 75.0 (63.5 86.5) 93.5 (86.9 100.0) 1.7722 0.2871 0.7221 2.8224 11.5 Pooled Results 86.7 (85.4 88.0) 90.0 (88.9 91.2) 2.0054 0.0059 1.8553 2.1554
Note. Numbers in parentheses are 95% CIs. Sn = sensitivity, Sp = specificity, LRP = likelihood ratio for a positive test result by the characteristics of study
1Study that the age distribution of below 19 years is over 32% (53, 61-63).
2Study that the age distribution of 20-49 years is over 60% (51, 55, 58).
3Study that the age distribution of over 50 years is over 25% (56, 60).
4Study that the male percentage is over 55% (61, 65-66).
5Study that the female percentage is over 55% (51-55, 58, 60, 63-64, 67, 69, 72).
6Highly suggestive group: Group of patients with classic clinical findings of appendicitis necessitating urgent surgery (75% over highly probability).
7Suggestive or atypical appendicitis group: Group of patients with intermediate symptoms necessitating serial observation (25%~75% intermediate probability).
8Less-likely group: Group of patients with low probability for appendicitis (25% under lower probability).
5 We directly extracted the information related to the US examiner in the method section of each article despite of the specialty of coauthor.
6 Hasselblad et al. (43) suggested that a test with an estimated of 1.0 is not especially effective for discriminating between the two populations, whereas a test with a value of 3.0 is highly effective.
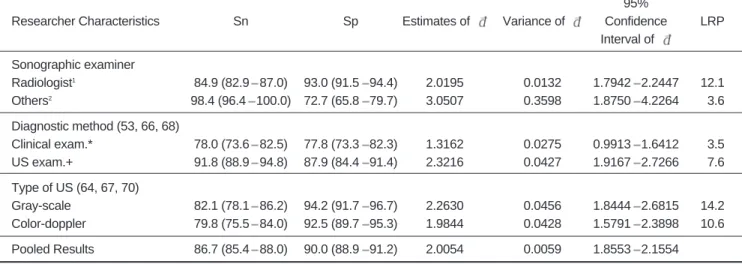
by the study researchers characteristics, if sonographic examiners were the only diagnostic radiologists groups (10 studies), the overall sensitivity and specificity (95% CI) of graded-compression US were 84.9% (82.9 to 87.0) and 93.0% (91.5 to 94.4), respectively. When there are other groups (including surgeons or emergency physicians) in the 2 studies, the overall sensitivity and specificity (95% CI) of graded-compression US were 98.4% (96.4 to 100.0) and 72.7% (65.8 to 79.7), respectively. Therefore the LR for a positive US result for the diagnostic radiologist groups was higher (12.1) than that (3.6) for the other groups. On the other hand, when the usefulness of the diagnostic method was simultaneously compared within only 3 studies (53, 66, 68), the overall sensitivity and specificity (95% CI) of the ultrasonographic method were 91.8% (88.9 to 94.8) and 87.9% (84.4 to 91.4), respectively. The LR for a positive result for the US examination groups was 7.6 and it was higher than that (3.5) for the clinical examination groups. If the type of US was the gray-scale group (64, 67, 70), the overall sensitivity and specificity (95% CI) of US were 82.1% (78.1 to 86.2) and 94.2% (91.7 to 96.7), respectively. The LR for a positive result for the gray-scale US groups was 14.2 and it was higher than that (10.6) for the color-doppler US. The estimates of by the diagnostic radiologists, the US examination groups and the gray-scale group for US were 2.0195 (95% CI: 1.7942, 2.2447), 2.3216 (95% CI: 1.9167, 2.7266), and 2.2630 (95% CI:
1.8444, 2.6815), respectively. So, some factors in the researchers characteristics were judged to be effective in
the diagnosis of acute appendicitis with using US (Table 3).
DISCUSSION
As a diagnostic tool of acute appendicitis, US has been popularly used in Korea since the mid-1980s (73). In this meta-analysis study, estimates of the diagnostic accuracy of graded-compression US were conducted with the method of pooling sensitivity and specificity measurments. We defined the pooled estimate for sensitivity (86.7%) and specificity (90.0%) of graded-compression US in this study.
Because the estimated values of were moderately large (> 2.0) and the estimates of specificity was higher than that (86.0%) for a given level of sensitivity (86.0%) and (2.0), we concluded that using graded-compression US for the diagnosis of acute appendicitis in symptomatic Koreans was effective. That is, an estimated of over 2.0 would suggest good discrimination by the diagnostic tool for the detection of patients with suspected disease (43).
Our result that covered 22 studies concurs with the result of meta-analysis study covering 17 studies by Orr and colleagues in the USA (33), but our study has a little bit higher value than that obtained with a quantitatively systemic review by other systemic review teams (35, 37).
Obermaier et al. in Germany (35) performed a systemic literature research with using 69 articles, and the results of single-center studies (sensitivity 81.6%, specificity 89.8%) or the results of studies that had less than 10 investigators (sensitivity 84.3%, specificity 86.8%) showed better
Table 3. Subgroup Meta-analysis Results of Graded-compression US for the Diagnosis of Acute Appendicitis by the Researchers’ Characteristics of Study
95%
Researcher Characteristics Sn Sp Estimates of Variance of Confidence LRP
Interval of Sonographic examiner
Radiologist1 84.9 (82.9 87.0) 93.0 (91.5 94.4) 2.0195 0.0132 1.7942 2.2447 12.1
Others2 98.4 (96.4 100.0) 72.7 (65.8 79.7) 3.0507 0.3598 1.8750 4.2264 03.6
Diagnostic method (53, 66, 68)
Clinical exam.* 78.0 (73.6 82.5) 77.8 (73.3 82.3) 1.3162 0.0275 0.9913 1.6412 03.5
US exam.+ 91.8 (88.9 94.8) 87.9 (84.4 91.4) 2.3216 0.0427 1.9167 2.7266 07.6
Type of US (64, 67, 70)
Gray-scale 82.1 (78.1 86.2) 94.2 (91.7 96.7) 2.2630 0.0456 1.8444 2.6815 14.2 Color-doppler 79.8 (75.5 84.0) 92.5 (89.7 95.3) 1.9844 0.0428 1.5791 2.3898 10.6 Pooled Results 86.7 (85.4 88.0) 90.0 (88.9 91.2) 2.0054 0.0059 1.8553 2.1554
Note. Numbers in parentheses are 95% CIs. Sn = sensitivity, Sp = specificity, LRP = likelihood ratio for a positive test result by the characteristics of the study, exam = examination
* Diagnosis by the clinical information of initial physical examination, diagnostic score (> 10), or leukocytosis, etc.
+ Diagnosis by graded-compression ultrasonography
1Study that the sonographic examiner was only diagnostic radiologist despite the kind of specialty of the coauthor in that article (58-59, 62-64, 67-70, 72).
2Study that the sonographic examiner was only others (surgeons or emergency physicians) (65, 71).
diagnostic values of appendicitis than those of the multi- center studies or the studies with 10 or more investigators.
Also, Terasawa et al. (37) reported that US had an overall sensitivity of 86%, a specificity of 81%, a positive likeli- hood ratio of 5.8, and a negative likelihood ratio of 0.19.
According to the recent study by Kessler et al. (74), the most accurate appendiceal finding for appendicitis was the presence of a 6 mm or larger diameter appendix. Using these diagnostic criteria, US showed 98% for the sensitiv- ity, specificity, positive predictive value, and negative predictive value. Thus, US is more useful for those patients who have an indeterminate probability of appendicitis after the initial evaluation.
If the US finding is positive, patients should have an operation, otherwise, they should be observed without performing an operation. Such a strategy reduces the unnecessary appendectomy rate. In our results, the negative appendectomy rate when using graded-compression US was 10.6%. In approximately 10% 20% of all the cases in several studies (26, 27, 75 79), a misdiagnosis was made and patients underwent operations without them having acute appendicitis at all. Therefore, the clinician s goals are to minimize the negative appendectomy rate and to approach 100% sensitivity for the diagnosis. Achieving these goals requires various diagnostic technologies such as taking a comprehensive clinical history and complete physical examination, a scoring system computer analysis technique, measuring the inflammatory markers (C-reactive protein and the leucocyte count), laparoscopy, computer tomography scan (CT), magnetic resonance imaging (MRI), scintigraphy, US and etc. (40, 80). According to the result of an analysis that used United States Census Bureau data by Flum et al. (78), the population-based incidence (15.5%) of unnecessary appendectomies did not change significantly over time (1987 1998) and it increased yearly for women of productive age or for patients older than 65 years even with the introduction of computed tomography, US and laparoscopy.
The choice of statistical method for pooling the results of different studies depends on the summary statistics, the source of heterogeneity and notably variation in diagnostic thresholds. First of all, in this study, the sensitivity and specificity were combined directly. Diagnostic odds ratios and summary receiver operating characteristic curves with using more complex formulas may also be synthesized (43, 81). We have also carefully looked into several major outcomes and subgroup meta-analyses for combining specific subgroup data across the different studies through the stratification of the study variables by the patients or researchers characteristics (Tables 2, 3). Thus, these important results were essentially the same as those seen in
the analyses from a total of 22 articles. When a patient predominately belonged to younger age, male or clinically highly suggestive group, the graded-compression US method could diagnose appendicitis more accurately. The overall sensitivity and specificity of graded-compression US for the younger age dominant group (in which the age distribution below 19 years was over 32%) were 90.1%
and 93.6%, respectively; those for US in the male
dominant group (the male percentage was over 55%) were 94.4%, and those for US in the clinically highly suggestive group (probability > 75%) were 93.1% and 92.3%, respectively. Also, the likelihood ratio (LR) for a positive US result for the younger age group, the male dominant group and highly suggestive group was 14.1, 16.9 and 12.1, respectively. This result means that the US results of these sorts are about 14 times, 17 times, and 12 times as likely to come from patients with acute appendicitis as from patients without acute appendicitis, according to each group. Our result in the clinically highly suggestive group is similar to those results of Rettenbacher et al. (18) and Orr et al. (33). However, the use of graded-compression US is known to be restricted for pediatric patients with unclear clinical findings or for female patients of childbearing age and/or with gynecologic diseases, or for obese adolescents (23, 30, 75 77).
Ultrasonography has recently been performed in emergency rooms by surgeons or emergency physicians with appropriate instrumentation and training (47, 48).
When the sonographic examiners (despite of their specialty or there was no description by the study author) were diagnostic radiologists, they differentiated appendicitis from other acute abdominal conditions more accurately.
The overall sensitivity and specificity for US for the diagnostic radiologist group were 84.9% and 93.0%, respectively; those for US for the others group were 98.4% and 72.7%, respectively. The LR for a positive US result for diagnostic radiologist group (12.1) was higher than that for the others group (3.6). Such discrepancies might be influenced by the number of studies (10 versus 2 studies). However, Obermaier et al. (35) reported there were no distinct differences between the investigating departments (the overall sensitivity, specificity, and accuracy for radiologists were 83.1%, 88.1% and 83.5%;
for surgeons they were 78.9%, 88.9% and 86.0%, respec- tively). So clinicians have to thoroughly apply the utiliza- tion guide of US for the diagnosis of appendicitis consider- ing the technologic advances of the US facilities or in-depth radiologic experience in their training (25, 74). Also, appendicitis was identified more accurately by US than by only clinical examination (the initial physical examination, the diagnostic score or the presence of leukocytosis, etc.).
The overall sensitivity and specificity for US testing groups were 91.8% and 87.9%, respectively. This result also concurs with the result of Kessler et al. (74). Therefore, US was superior to a clinical (or laboratory) examination solely for affirming or excluding appendicitis.
Some limitations of our study must be considered. First, because the outcome data used in this study were based on retrospective observational studies, there was considerable variation in the results of US as the primary imaging modality by the study. Particularly, there was considered disparities between each study (including diversity of the sonographic examiners, the inter-examiner skill, the US facilities and study periods). It was indirectly proven that 22 studies were heterogeneous with a statistical signifi- cance (Q = 111.913, p-value < 0.001) for the graded- compression US criteria. This variation may be caused by chance alone (small sample sizes), but it can also reflect true heterogeneity.
Second, verification bias may have occurred when the reference standard was assessed on patients sampled differ- entially in the categories of test results (32, 82). To
eliminate these variations in study quality on the meta- analysis for diagnostic tests, the Cochrane Methods Working Group on Screening and Diagnostic Tests have suggested the comprehensive validity checklist for the primary studies include the target population, method of patient selection (selection bias), method of verification (differential reference standard bias), method of interpreta- tion of tests, and method to avoid residual confounding (40, 83, 84). This meta-analysis used only the studies that met the inclusion criteria for quality evaluation. Thus we excluded the studies with the lack of biopsy results as a reference standard or without the evidence of utilization of graded-compression US or without the evidence on sonographic signs of appendicitis (85 94).
Third, because we were restricted to Korean-language studies for the study selection, so there may be consider- able language bias as a kind of publication bias (95).
However, this result could directly or indirectly compare the results of meta-analyses using non-Korean-language literature (33, 35, 37).
Four, because of the insufficient information extracted in each study, the classification criteria of the subgroups (like dominant age or gender groups) may be arbitrary. Thus, we may consider the spectrum effect, which reflects the inherent variation in test performance among population subgroups (96). So then, our results for subgroup analyses should be interpreted with caution.
In this analysis, the medical cost of US utilization was not considered. Thus, future investigations should analyze the cost-effectiveness of the US method. Also, future
studies are needed to compare the usefulness of this methodology by the type of US facility (67) as well as comparing it with computed tomography, when consider- ing the breakthroughs of imaging technique (37).
Currently, according to the study protocol of Bachmann et al. (40), systemic reviews of diagnostic literature (including MEDLINE, EMBASE, DARE, Cochrane Database of Systemic Reviews, conference proceedings, MEDION, SCISEARCH, BIOSIS) for prediction of acute appendicitis will allow us to assess the quality of the available evidence and to identify the value of the specific diagnostic tests (including the history, physical examination and ultrasonography tests, etc.). Although this meta-analysis provides a statistically robust outcome despite of some limitation of study method, randomized clinical trials or well-designed prospective studies for adopting a new diagnostic modality will be continuously required in clinical outcome research. To our knowledge, this study is a cornerstone of the estimate formula of for assessing the accuracy of a new diagnostic test and it provides an evidence-based clinical outcome for medical education and health insurance policy.
In conclusion, US may be suggested as a useful diagnos- tic method for acute appendicitis, especially when the symptomatic patients are younger age, male and have clear clinical suggestions of disease. This procedure is evidently user-dependent and it has to be performed by a well- trained physician prior to the decision-making regarding an appendectomy.
Appendix
For each estimate of and d, the variance of d, combin- ing the estimates of effectiveness ( ), and the 95% CI of estimated were produced as follows (43).
The log odds ratio is frequently used as a summary measure of effect in contingency tables. Thus this log odds ratio (sum of the logits of sensitivity and specificity) is just a constant multiplied by the standardized difference between mean.
The index of effect size would be
= 3[loge(Sn/(1 Sn)) + loge(Sp/(1 Sp)) ] / . (Sn; Sensitivity, Sp; Specificity)
Once data have been obtained, we can estimate the sensitivity and specificity from the observed data. An estimate (d) of can be calculated directly from the counts in the 2 2 table as
d = 3[ loge(A+1/2)+loge(D+1/2) loge(B+1/2) loge (C+1/2) ] / ,
(A; true positive, B; false positive, C; false negative, D;
true negative in a 2 2 contingency table)
and a relatively simple estimate of the variance of d is
given as:
Var (d) 3[1/(A+1/2) + 1/(B+1/2) + 1/(C+1/2) + 1/(D+1/2)] / 2.
Assuming that there are m studies, the combined estimates of effectiveness ( ) are usually given by the weighted mean,
= ( jdj) / ( j), (j = 1, 2, 3, , m) where j= 1 / var (dj). The variance of the combined estimate is
Var ( ) = 1 / ( j).
The weighted mean and its variance can be used to obtain confidence intervals for the effect size. A 95% CI for the average effect size is given by 1.96 Var ( ).
Acknowledgements
This work was supported by a grant from the 2001 Health Policy Project, Ministry of Health & Welfare, Republic of Korea. We are grateful to Juhee Hong, MS (in Department of Preventive Medicine, Ewha Women University College of Medicine), for assistance with data collection; and Robert L. Kane, MD (in Clinical Outcomes Research Center, University of Minnesota School of Public Health), for recommendation and expert advice. We also would like to thank other reviewers (including Maynard W. Dorow, DD) for their thoughtful comments on the review process of this study.
References
1. Deutsch A, Leopold GR. Ultrasonic demonstration of the inflamed appendix: Case report. Radiology 1981;140;163-164 2. Puylaert JBCM. Acute appendicitis: US evaluation using graded
compression. Radiology 1986;158:355-360
3. Jeffrey RB Jr, Laing FC, Lewis FR. Acute appendicitis: High- resolution real-time US findings. Radiology 1987;163:11-14 4. Puylaert JB, Rutgers PH, Lalisang RI, de Vries BC, van der
Werf SD, Dorr JP, et al. A prospective study of ultrasonography in the diagnosis of appendicitis. N Engl J Med 1987;317:666- 669
5. Jeffrey RB Jr, Laing FC, Townsend RR. Acute appendicitis:
Sonographic criteria based on 250 cases. Radiology 1988;167:327-329
6. Vignault F, Filiatrault D, Brandt ML, Garel L, Grignon A, Ouimet A. Acute appendicitis in children: Evaluation with US.
Radiology 1990;176:501-504
7. Sivit CJ, Newman KD, Boenning DA, Nussbaum-Blask AR, Bulas DI, Bond SJ, et al. Appendicitis: Usefulness of US in diagnosis in a pediatric population. Radiology 1992;185:549- 552
8. Crady SK, Jones JS, Wyn T, Luttenton CR. Clinical validity of ultrasound in children with suspected appendicitis. Ann Emerg Med 1993;22:1125-1129
9. Balthazar EJ, Birnbaum BA, Yee J, Megibow AJ, Roshkow J, Gray C. Acute appendicitis: CT and US correlation in 100 patients. Radiology 1994;190:31-35
10. Ramachandran P, Sivit CJ, Newman KD, Schwartz MZ.
Ultrasonography as an adjunct in the diagnosis of acute
appendicitis: A 4-year experience. J Pediatr Surg 1996;31:164- 169
11. Puylaert JBCM, van der Zant FM, Rijke AM. Sonography and the acute abdomen: Practical considerations. AJR Am J Roentgenol 1997;168:179-186
12. Birnbaum BA, Jeffrey RB Jr. CT and sonographic evaluation of acute right lower quadrant abdominal pain. AJR Am J Roentgenol 1998;170:361-371
13. Garcia Pena BM, Mandl KD, Kraus SJ, Fischer AC, Fleisher GR, Lund DP, et al. Ultrasonography and limited computed tomography in the diagnosis and management of appendicitis in children. JAMA 1999;282:1041-1046
14. Birnbaum BA, Wilson SR. Appendicitis at the millennium.
Radiology 2000;215:337-348
15. Baldisserotto M, Marchiori E. Accuracy of noncompressive sonography of children with appendicitis according to the potential positions of the appendix. AJR Am J Roentgenol 2000;175:1387-1392
16. Jones PF. Suspected acute appendicitis: Trends in management over 30 years. Br J Surg 2001;88:1570-1577
17. Pena BM, Taylor GA, Fishman SJ, Mandl KD. Effect of an imaging protocol on clinical outcomes among pediatric patients with appendicitis. Pediatrics 2002;110:1088-1093
18. Rettenbacher T, Hollerweger A, Gritzmann N, Gotwald T, Schwamberger K, Ulmer H, et al. Appendicitis: Should diagnos- tic imaging be performed if the clinical presentation is highly suggestive of the disease? Gastroenterology 2002;123:992-998 19. Blebea JS, Meilstrup JW, Wise SW. Appendiceal imaging:
Which test is best? Semin Ultrasound CT MR 2003;24:91-95 20. Lee SL, Ho HS. Ultrasonography and computed tomography in
suspected acute appendicitis. Semin Ultrasound CT MR 2003;24:69-73
21. Sivit CJ. Imaging the child with right lower quadrant pain and suspected appendicitis: Current concepts. Pediatr Radiol 2004;34:447-453
22. Taylor GA. Suspected appendicitis in children: In search of the single best diagnostic test. Radiology 2004;231:293-295 23. Ziegler MM. The diagnosis of appendicitis: An evolving
paradigm. Pediatrics 2004;113:130-132
24. Hernandez JA, Swischuk LE, Angel CA, Chung D, Chandler R, Lee S. Imaging of acute appendicitis: US as the primary imaging modality. Pediatr Radiol 2005;35:392-395
25. Wade DS, Marrow SE, Balsara ZN, Burkhard TK, Goff WB.
Accuracy of ultrasound in the diagnosis of acute appendicitis compared with the surgeon’s clinical impression. Arch Surg 1993;128:1039-1046
26. Bendeck SE, Nino-Murcia M, Berry GJ, Jeffrey RB Jr. Imaging for suspected appendicitis: Negative appendectomy and perfora- tion rates. Radiology 2002;225:131-136
27. McCallion J, Canning JP, Knight PV, McCallion JS. Acute appendicitis in the elderly: A 5-year retrospective study. Age Ageing 1987;16:256-260
28. Sivit CJ. Diagnosis of acute appendicitis in children: spectrum of sonographic findings. AJR Am J Roentgenol 1993;161:147-152 29. Lim HK, Lee WJ, Lee SJ, Namgung S, Lim JH. Focal appendici-
tis confined to the tip: Diagnosis at US. Radiology 1996;200:799-801
30. Hormann M, Scharitzer M, Stadler A, Pokieser P, Puig S, Helbich T. Ultrasound of the appendix in children: Is the child too obese? Eur Radiol 2003;13:1428-1431
31. Guyatt GH, Tugwell PX, Feeny DH, Haynes RB, Drummond M.
A framework for clinical evaluation of diagnostic technologies.
CMAJ 1986;134:587-594
32. Irwig L, Tosteson AN, Gatsonis C, Lau J, Colditz G, Chalmers TC, et al. Guidelines for meta-analyses evaluating diagnostic tests. Ann Intern Med 1994;120:667-676
33. Orr RK, Porter D, Hartman D. Ultrasonography to evaluate adults for appendicitis: decision making based on meta-analysis and probabilistic reasoning. Acad Emerg Med 1995;2:644-650 34. Hallan S, Asberg A. The accuracy of C-reactive protein in
diagnosing acute appendicitis-a meta-analysis-. Scand J Clin Lab Invest 1997;57:373-380
35. Obermaier R, Benz S, Asgharnia M, Kirchner R, Hopt UT.
Value of ultrasound in the diagnosis of acute appendicitis:
Interesting aspects. Eur J Med Res 2003;8:451-456 36. Andersson REB. Meta-analysis of the clinical and laboratory
diagnosis of appendicitis. Br J Surg 2004;91:28-37
37. Terasawa T, Blackmore CC, Bent S, Kohlwes RJ. Systematic review: Computed tomography and ultrasonography to detect acute appendicitis in adults and adolescents. Ann Intern Med 2004;141:537-546
38. Jenicek M, Feinstein AR. Epidemiology: The logic of modern medicine (IX. Meta-analysis in Medicine: Putting experiences together), 1st ed. Montreal EPIMED, 1995:269-295 39. Lau J, Ioannidis JP, Schmid CH. Quantitative synthesis in
systematic reviews. Ann Intern Med 1997;127:820-826 40. Bachmann LM, Bischof DB, Bischofberger SA, Bonani MG,
Osann FM, Steurer J. Systematic quantitative overviews of the literature to determine the value of diagnostic tests for predict- ing acute appendicitis: Study protocol. BMC Surgery 2002;2:2 41. Middleton WD, Kurtz AB, Hertzberg BS. Ultrasound: The
Requisites, 2nd ed. Mosby (An Affiliate of Elsevier Inc.), 2004:224-225
42. Quillin SP, Siegel MJ. Appendicitis in children: Color Doppler sonography. Radiology 1992;184:745-747
43. Hasselblad V, Hedges L. Meta-analysis of diagnostic and screen- ing tests. Psychol Bull 1995;117:167-177
44. Song HH. Meta-analysis. 1st ed. Seoul: Chungmoonkak Press, 1998: 55-57, 83-87
45. Oxman AD, Guyatt GH. A consumer’s guide to subgroup analyses. Ann Intern Med 1992;116:78-84
46. Sackett DL, Haynes RB, Guyatt GH, Tugwell P. Clinical Epidemiology: A Basic Science for Clinical Medicine. 2nd ed.
Boston/Toronto/London: Little, Brown and Company, 1991:119-139
47. Zielke A, Hasse C, Sitter H, Kisker O, Rothmund M. “Surgical”
ultrasound in suspected acute appendicitis. Surg Endosc 1997;11:362-365
48. Allemann F, Cassina P, Rothlin M, Largiader F. Ultrasound scans done by surgeons for patients with acute abdominal pain:
A prospective study. Eur J Surg 1999;165:966-970
49. Chen SC, Wang HP, Hsu HY, Huang PM, Lin FY. Accuracy of ED sonography in the diagnosis of acute appendicitis. Am J Emerg Med 2000;18:449-452
50. Emil S, Mikhail P, Laberge JM, Flageole H, Nguyen LT, Shaw KS, et al. Clinical versus sonographic evaluation of acute appendicitis in children: a comparison of patient characteristics and outcomes. J Pediatr Surg 2001;36:780-783
51. Kim SJ, Park CK, Yu SK, Park SH, Kim CY, Bahk YW, et al.
Diagnosis of acute appendicitis using ultrasonograpy. J Korean Radiol Soc 1987;23:608-613
52. Suh HS, Chung MH, Kim KT. Ultrasonography for the acute
appendicitis. J Korean Radiol Soc 1987;23:998-1007
53. Lee JD, Lee JT, Cho JW, Yang JY. Diagnosis of acute appendici- tis by ultrasonography. J Korean Soc Med Ultrasound
1987;6:158-167
54. Lee SH, Chang YD, Kim DH, Lee HK, Kwon KH, Kim KJ.
Ultrasonographic diagnosis of acute appendicitis. J Korean Radiol Soc 1988;24:306-311
55. Moon MJ, Lee HR, Oh EO. Ultrasonographic findings of acute appendicitis. J Korean Radiol Soc 1989;25:273-280
56. Rhee JK, Park JC, Lim CY, Chae KM, Kim CG. Diagnostic significance of ultrasonography in appendicitis. J Korean Surg Soc 1989;37:93-96
57. Lim HK, Lee KW, Choo IW, Bae SH. A prospective study of ultrasonographic diagnosis of acute appendicitis. J Korean Soc Med Ultrasound 1990;9:31-36
58. Suh KH, Jung ID. Diagnostic significance of ultrasonography in acute appendicitis. J Pusan Surg Soc 1992;8:58-65
59. Sohn SH, Jung KS, Kim JS, Woo SK, Chung KY, Kim HJ. Value of ultrasonography in the diagnosis of acute appendicitis. J Korean Radiol Soc 1993;29:249-254
60. Ko KH, Hwang JY, Song CH. Diagnosis of acute appendicitis using ultrasonography. J Korean Surg Soc 1995; 49:398-401 61. Lee MK, Im CS, Ann SM, Kim CH, Lee DJ, Kwon JH.
Ultrasonography for diagnosis of acute appendicitis in children.
J Korean Pediatr Soc 1996;39:497-502
62. Lee HK, Ahn SI, Yang DH. The diagnostic value of ultrasono- graphic evaluation in acute appendicitis. J Korean Surg Soc 1996;50:574-582
63. Bae KH, Choi SY, Kim CS, Han HY, Song BJ, Park SH.
Diagnostic accuracy and value of a preoperative ultrasono- graphic evaluation in acute appendicitis. J Korean Surg Soc 1997;53:1023-1030
64. Lee JC, Kim HS, Song KY, Yi JG, Park JH, Lee YJ, et al. Value of color doppler sonography in the diagnosis of acute appendici- tis. J Korean Soc Med Ultrasound 1997;16:141-146
65. Oh BY, Lim KS, Lee YJ, Kim W, Choi OK. Early diagnosis of acute appendicitis by use of ultrasonography in emergency department. J Korean Soc Emerg Med 1998;9:586-594 66. Oh CH, Sung CK, Kim KH. Diagnostic efficacy of diagnostic
scoring system and ultrasonographic examination in acute appendicitis: Retrospective and prospective study. J Korean Surg Soc 1999;57:72-80
67. Lee SC. Diagnosis of acute appendicitis: Comparison between gray scale, color doppler and power doppler US. Med J Red Cross Hospital 1999;26:255-261
68. Lee JM, Lee MS, Han HY, Yoon YG, Ym SH. Diagnosis of acute appendicitis in the community hospital: Validity and usefulness of sonography. J Korean Radiol Soc 1999;40:275-280 69. Lee SW, Lee JK, Baek SY, Kang BC, Lee SW. The diagnostic
role of US in patients with right lower quadrant abdominal pain.
J Korean Radiol Soc 2000;43:729-733
70. Chung HH, Kim YH, Kim HW, Park SC, Lee EJ, Chung KB, et al. Sonographic study about differential diagnosis between acute appendicitis and non-appendicitis in appendices of borderline diameter. J Korean Soc Med Ultrasound 2000;19:257-263 71. Sim WS, Sim MS. Abdominal sonography of suspected
appendicitis. J Korean Soc Coloproctology 2001;17:59-63 72. Lee JH, Choi PC, Shim MS, Song KJ, Jeong YK. Comparison of
computer tomography and sonography in patients suspected of having appendicitis. J Korean Soc Emerg Med 2001;12:290-297 73. Kim SH. Realtime ultrasonography of acute appendicitis. J