Vol. 47, No. 5, pp. 729 - 736, 2006
We report here the use of human inflammation arrays to study the inflammatory gene expression profile of TNF- -α treated human SGBS adipocytes. Human preadipocytes (SGBS) were induced to differentiate in primary culture, and adipocyte differentiation was confirmed, using Oil Red O staining. We treated the differentiated adipocytes with TNF- ,α and RNA from differentiated adipocytes with or without TNF- treatment was hybridized to MWG human inflammation α
arrays to compare expression profiles. Eleven genes were up- or down-regulated in TNF- -treated adipocytes. As revealedα by array analysis, among 6 up-regulated genes, only eotaxin-1, monocyte chemoattractant protein-1 (MCP-1), and vascular cell adhesion molecule 1 isoform a precursor (VCAM1) were confirmed by real-time polymerase chain reaction (PCR).
Similarly, among 5 down-regulated genes, only IL-1 family member 5 (IL1F5), a disintegrin and metalloprotease with thrombospondin motifs-1 preproprotein (ADAMTS1), fibronectin 1 isoform 1 preprotein (FN1), and matrix metalloproteinase 15 preprotein (MMP15) were confirmed by real-time PCR. There was a substantial increase (50-fold) in eotaxin-1 in response to TNF- . Taken together, we have identified several inflamα - matory molecules expressed in SGBS adipocytes and dis- covered molecular factors explaining the relationship between obesity and atherosclerosis, focusing on inflammatory cyto- kines expressed in the TNF- -treated SGBS cells. Furtherα investigation into the role of these up- or down-regulated
cytokine genes during the pathological processes leading to the development of atherosclerosis is warranted.
Key Words: Adipose tissue, cytokine, DNA microarray, inflammation, SGBS, TNF-α
INTRODUCTION
Adipose tissue is a storage organ for excess energy in the form of triglycerides. Since the dis- covery of leptin, numerous reports have been published, describing adipose tissue as a multi- functional organ that produces and secretes many factors, acting in a paracrine and endocrine manner.1 Adipocytes secrete many protein signals and factors, collectively known as adipocytokines or adipokines. These adipokines include inflam- matory molecules, such as leptin, resistin, adiponectin, tumor necrosis factor-α (TNF- ),α adipsin, interleukins (IL-1 , IL-6, IL-8, IL-10),β plasminogen activator inhibitor-1 (PAI-1), hapto- globin, C-reactive protein (CRP), and MCP-1.2,3
The current view is that certain adipokines and other factors produced and released by white adipose tissue are responsible for the chronic in- flammatory state of obesity, particularly the visceral form. Reduction of fat mass correlates with decreases in the serum levels of many of these adipokines,4 implying that approaches designed to promote fat loss should be useful in attenuating the proinflammatory milieu associated with obesity. The concomitance of inflammation,
Inflammatory Gene Expression Patterns Revealed by DNA Microarray Analysis in TNF- -treated SGBS Humanα
Adipocytes
Myoung-Sool Do,1 Hun-Soon Jeong,1 Bong-Hyuk Choi,1 Leif Hunter,2 Stuart Langley,3 Laszlo Pazmany,3 and Paul Trayhurn2
1School of Life and Food Sciences, Handong Global University, Pohang, Kyungbuk, Korea;
2Obesity Biology Unit, School of Clinical Sciences, University of Liverpool, University Clinical Departments, Liverpool L69 3GA, UK;
3University Hospital, Aintree, Clinical Sciences Centre, Longmoor Lane, Liverpool L7 9AL UK.
Received December 2, 2005 Accepted May 22, 2006
This work was supported by the Korea Research Foundation Grant (KRF-2003-013-C00089).
Reprint address: requests to Dr. Myoung-Sool Do, School of Life and Food Sciences, Handong Global University Pohang, Korea. Tel: 82-54-260-1301, Fax: 82-54-261-1306, E-mail: msdo@
handong.edu
hypertension, and dyslipidemia increases the likelihood of type II diabetes and cardiovascular disease.5
TNF- regulates key components of fat metaboα - lism, with a net effect of preventing fat deposition through inhibition of lipogenesis, increased lipolysis, and facilitation of adipocyte death by apoptosis.6TNF- has been suggested as a mediaα - tor of insulin resistance in obesity,13 although controversy surrounds the exact nature of this proposed role. The effects of TNF- and otherα proinflammatory cytokines on feeding, energy balance, and neuroendocrine and immune func- tion during infection and inflammation are well- recognized.7
It is likely that more inflammatory adipokines will be discovered. Most studies on adipocyte- secreted molecules have been conducted, using 3T3-L1 cells originating from mice, but recently Simpson-Golabi-Behmel Syndrome (SGBS) human preadipocytes have been introduced. These cells can be induced to differentiate into adipocytes in primary culture, enabling human adipocyte- secreted molecules to be studied.8
In this study, we describe the utilization of MWG human inflammatory microarrays to study the inflammatory gene expression profile of human SGBS adipocytes. We also studied the inflammatory gene expression profile of SGBS cells following TNF- treatment.α
MATERIALS AND METHODS SGBS cell culture
Cells were obtained from Dr. M. Wabitsch (Univ. of Ulm, Ulm, Germany),8 and these cells were derived from the stromal cell fraction of subcutaneous adipose tissue of an infant with SGBS. The cells were grown in serum-containing DMEM/F12 medium (Invitrogen, Paisley, UK), supplemented with 33 mM biotin, 17 mM pantothenate, and antibiotics. To induce adipocyte differentiation, cells were washed with phosphate buffered saline (PBS) buffer and cultured in serum-free medium (DMEM/F12), supplemented with 10 g/mL of transferrin, 10μ nM insulin, 200 pM triiodothyronine, 1 M cortisol, 2μ μM BRL
49653, 500 M 1-methyl-3-isobutylxanthineμ (IBMX), and 0.25 M dexamethasone for four days. After four days, the medium was replaced with serum- free medium (DMEM/F12), supplemented with 10
g/mL of transferrin, 10
μ nM insulin, 200 pM
triiodothyronine, and 1 M cortisol, and thenμ changed twice per week. One day before sample treatment, the medium was changed to serum-free medium, supplemented with only transferrin, pantothenate, and biotin, and, the next day, cells were treated with 50 ng of TNF- for 24α h. All materials except DMEM/F12 were from Sigma (Poole, UK).
Oil Red O staining
Cells were fixed with 10% fresh formaldehyde (Sigma, Poole, UK). They were rinsed in PBS (Biowhittaker Molecular Application, Walkerville, MD, USA), incubated with filtered Oil Red O stock solution for at least 1 h, gently washed twice with water, stained with 1 mL of Harris' Haematoxylin (Brainwood lab., E. Sussex, UK), and finally washed with warm distilled water.
cRNA preparation and probe preparation RNA extraction and cDNA synthesis
Total RNA was extracted, using a standard Trizol RNA isolation protocol (Life Technologies, Grand Island, NY, USA) and quantified specto- photometrically. To each 2 g total RNA sample,μ 1 L of 10μ μM oligo-dT(24) was added, and the mixture was denatured at 70 for 2 min, then immediately placed on ice. The reverse transcrip- tion mastermix (2 L of 5X first strand buffer, 1μ μL of 20 mM DTT, 1 L of 10μ mM dNTP, and 1 L ofμ Powerscript reverse transcriptase {Clontech, BD Biosciences, Oxford, UK}) was then added and incubated for 1 h at 42 . Enzymic activity was stopped by heating to 72 for 10 min.
cRNA amplification and labelling
Total RNA was extracted and reverse tran- scribed as described above, except that the CDS oligo-dT was replaced with a modified oligo-dT with the T7 promotor sequence incorporated. The first strand cDNA product was subjected to two rounds of PCR amplification, using the SMART
protocol (Clontech, BD Biosciences, Oxford, UK).
The resulting dsDNA product was used in a reaction with ribonucleotides and T7 RNA polymerase and then incubated at 37 for 18 h.
Amplified cRNA was labeled with either Cy3 or Cy5 dye, using a Micromax kit (PerkinElmer, London, UK).
Hybridization and image processing
10 g labeled cRNA was dried in a Speedvacμ and resuspended in 40 L hybridization bufferμ (MWG Biotech AG, London, UK). The cRNA was denatured at 95 for 3 min, vortexed, and briefly spun-down to collect the contents. The cRNA was chilled on ice for 30 sec and pipetted onto the MWG human inflammatory array (MWG Biotech AG). A coverslip was carefully placed on the microarray, which was then sealed in the hybridi- zation chamber and placed into an incubator at 42 overnight. Microarrays were subjected to 5 min washes in 2X SSC, 0.1% SDS followed by 1X SSC, and, finally, 0.1X SSC. The microarrays were scanned at a resolution of 10 m, using anμ Affymetrix 428 confocal laser scanner. The microarray images were analyzed using Imagene (Biodiscovery, CA, USA). Signal and background means for both Cy3 and Cy5 channels were calculated for each individual spot. These results were then imported into Genesight (Biodiscovery, CA, USA). The microarrays were corrected by local background correction, which involves sub- tracting each spot's background from the signal value of the same spot. All of the genes in our dataset were used to calculate normalization parameters. Using all genes assumes that the majority of the genes measured are not differ- entially regulated. Therefore, when taken as a whole, the population accurately represents the channel bias.
Data analysis
Biodiscovery Genesights 4 (Biodiscovery, CA, USA) was used for the analysis of the data. The data for each of four signals (mean, four signals) were combined and analyzed. All of the data was corrected for background intensity, using local background correction, and multiple spots with
flags were omitted. Normalization was performed, using Lowess normalization, with a smoothing parameter of 0.2 and one degree of fitness. Genes that were two-fold up- or down-regulated were partitioned with 95% confidence intervals.
Real-time polymerase chain reaction (PCR) analysis
In a LightCycler (Roche Applied Science. India- napolis, IN, USA), 1 L from 5μ μL of each reverse- transcribed reaction was amplified in a 20 L PCRμ mix, containing 4 mM MgCl2, 10 pM each primer, and 1x LightCycler DNA Master SYBR Green 1 mix (Roche Applied Science. Indianapolis, IN, USA).
Samples were incubated for an initial denaturation at 94 for 30 s, followed by 40 PCR cycles. Each cycle consisted of 95 for 10 s, each annealing temperature for 5 s, and 72 for 12 s. For the analysis of up- and down-regulated genes, PCR primers, scanning exon-intron boundaries were designed using Primer Premier 5 software (Biosoft International, Palo Alto, CA, USA) and were manu- factured by Bioneer (Bioneer, Daejeon, Korea). The oligonucleotide primers for the experiment are listed in Table 1. To confirm the amplification of specific transcripts, melting curve profiles (cooling the sample to 65 for 15 s and heating slowly to 95 with continuous measurement of fluores- cence) were produced at the end of each PCR.
RESULTS
Inflammatory gene expression profile of TNF- -α treated SGBS cells using inflammatory human array
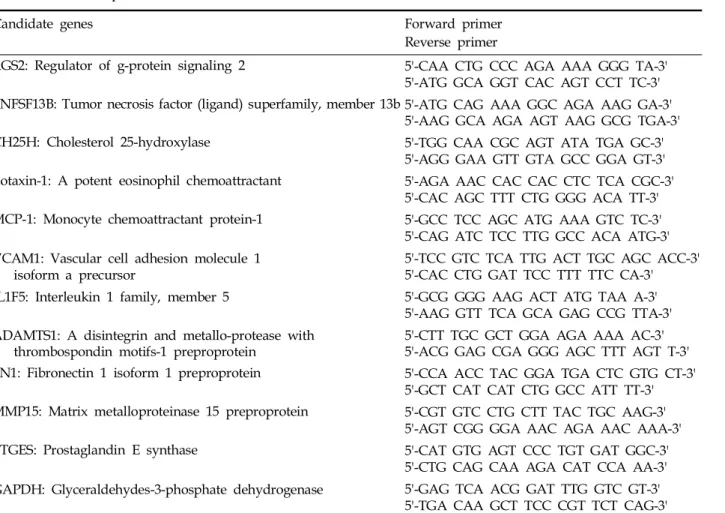
Differentiated SGBS cells were stained with Oil Red O staining 0, 4, 10, and 20 days after the induction of differentiation. Most of the cells were differentiated as adipocytes and filled with lipid droplets at Day 20 after the induction of differen- tiation (Fig. 1).
In order to study the effect of a pro-inflam- matory cytokine on the gene expression profile of human SGBS cells, we treated differentiated SGBS adipocytes with TNF- , which has a well-characα - terized effect in adipocytes. In this study, we
replaced the medium of adipocytes on Day 18 with cortisol-free medium and incubated the culture with TNF- for 24 h on Day 19. The cellsα were harvested on Day 20, and the gene expres- sion profiles were analyzed using the inflam- matory human arrays. From the 136 inflamma- tory genes present on the arrays, a total of 42 genes were expressed at either day 20 or day 20/
TNF- (Fig. 2). Of these, 11 genes were two- foldα up- or down-regulated. In TNF- -treated SGBSα adipocytes, 6 genes were up-regulated, and 5 genes were down-regulated (Table 2). The up- regulated genes were: regulator of g-protein sig- naling 2 (RGS2), Tumor necrosis factor (ligand) superfamily, member 13b (TNFSF13B), cholesterol 25-hydroxylase (CH25H), eotaxin-1, MCP-1, and vascular cell adhesion molecule 1 isoform a pre- cursor (VCAM1). The down-regulated genes were:
IL-1 family member 5 (IL1F5), a disintegrin and metalloprotease with thrombospondin motifs-1
preproprotein (ADAMTS1), fibronectin 1 isoform 1 preprotein (FN1), matrix metalloproteinase 15 preprotein (MMP15), and prostaglandin e syn- thase (PTGES).
Real-time PCR analysis of up- and down- regulated genes of TNF- -treated SGBS cellsα
The expression profiles found in the microarray experiments of TNF- -treated SGBS cells were reα - examined by real-time PCR with custom designed primers for candidate genes (Table 1). Of the 6 genes shown through array analysis to be up-regu- lated, only 3 genes, MCP-1, eotaxin-1, and VCAM1, were also shown by real-time PCR to be up-regu- lated. Of the 5 genes revealed by array analysis to be down-regulated, 4 genes, IL1F5, MMP15, FN1, and ADAMTS1, were found also by real-time PCR to be down-regulated. PTGES was not down-regu- lated according to either method (Table 3).
Table 1. Primer Sequences for Real-Time PCR
Candidate genes Forward primer
Reverse primer
RGS2: Regulator of g-protein signaling 2 5'-CAA CTG CCC AGA AAA GGG TA-3' 5'-ATG GCA GGT CAC AGT CCT TC-3' TNFSF13B: Tumor necrosis factor (ligand) superfamily, member 13b 5'-ATG CAG AAA GGC AGA AAG GA-3'
5'-AAG GCA AGA AGT AAG GCG TGA-3' CH25H: Cholesterol 25-hydroxylase 5'-TGG CAA CGC AGT ATA TGA GC-3'
5'-AGG GAA GTT GTA GCC GGA GT-3' Eotaxin-1: A potent eosinophil chemoattractant 5'-AGA AAC CAC CAC CTC TCA CGC-3'
5'-CAC AGC TTT CTG GGG ACA TT-3' MCP-1: Monocyte chemoattractant protein-1 5'-GCC TCC AGC ATG AAA GTC TC-3'
5'-CAG ATC TCC TTG GCC ACA ATG-3' VCAM1: Vascular cell adhesion molecule 1
isoform a precursor 5'-TCC GTC TCA TTG ACT TGC AGC ACC-3'
5'-CAC CTG GAT TCC TTT TTC CA-3' IL1F5: Interleukin 1 family, member 5 5'-GCG GGG AAG ACT ATG TAA A-3'
5'-AAG GTT TCA GCA GAG CCG TTA-3' ADAMTS1: A disintegrin and metallo-protease with
thrombospondin motifs-1 preproprotein 5'-CTT TGC GCT GGA AGA AAA AC-3' 5'-ACG GAG CGA GGG AGC TTT AGT T-3' FN1: Fibronectin 1 isoform 1 preproprotein 5'-CCA ACC TAC GGA TGA CTC GTG CT-3'
5'-GCT CAT CAT CTG GCC ATT TT-3' MMP15: Matrix metalloproteinase 15 preproprotein 5'-CGT GTC CTG CTT TAC TGC AAG-3'
5'-AGT CGG GGA AAC AGA AAC AAA-3'
PTGES: Prostaglandin E synthase 5'-CAT GTG AGT CCC TGT GAT GGC-3'
5'-CTG CAG CAA AGA CAT CCA AA-3' GAPDH: Glyceraldehydes-3-phosphate dehydrogenase 5'-GAG TCA ACG GAT TTG GTC GT-3'
5'-TGA CAA GCT TCC CGT TCT CAG-3'
DISCUSSION
The present study shows that treatment of dif- ferentiated SGBS cells with the pleiotropic pro- inflammatory cytokine, TNF- , increased expresα -
sion of six, and decreased the expression of five, inflammation-related genes. Real-time PCR an- alysis did not always confirm the results from array analysis, and reason for this discrepancy may be the cross-hybridization of oligonucleotides
Fig. 1. Oil Red O staining of SGBS cells at (A) Day 0 and at (B) Day 4, (C) Day 10, and (D) Day 20 after differentiation. The stained lipid droplets are shown in red.
B
A B
D C
A
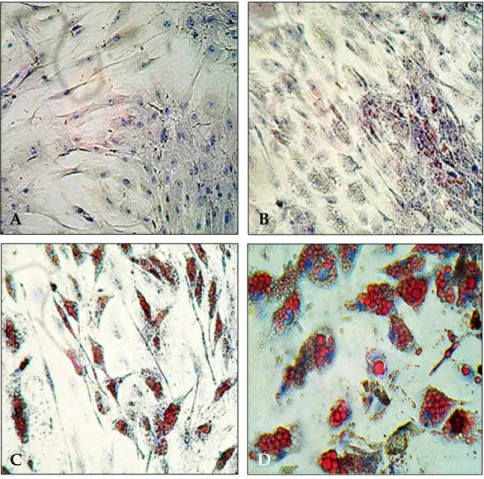
Fig. 2.Scanned image data of a MWG human inflammatory array, hybrid- ized with cRNA prepared from dif- ferentiated SGBS (Day 20) and TNF- -α treated differentiated SGBS cells (Day 20/TNF- ). (A) Day 20 cells are Cy3-α labeled and Day 20/TNF- cells areα Cy5-labeled. (B) Day 20 cells are Cy5- labeled and Day 20/TNF- cells areα Cy3-labeled.
in the array with other RNA. It is known that cross-hybridization can give a false high signal for some highly homologous gene sequences.
MCP-1 is a member of the chemokine family. In vitro studies suggest that MCP-1 may contribute to the development of insulin resistance and in- duce adipocyte dedifferentiation.9 In other studies, MCP-1 mRNA expression has increased in obese mice, leading to elevated levels of plasma MCP-1 protein. The higher levels of MCP-1 protein in plasma were found to increase the CD11b-positive monocyte/macrophage population among pe- ripheral blood cells, suggesting a role for elevated MCP-1 in the vascular inflammatory process during atherosclerosis.10 Eotaxin-1 is a potent eosinophil chemoattractant that is abundant in atheromatous plaques.11 The major receptor for eotaxin-1 is CCR3, which is found on leukocytes and on some non-leukocytic cells. The expression of eotaxin-1 in human adipocytes has not yet been reported. Inflammatory cytokines induce endothe- lial VCAM1 expression, a response known to be augmented by either TRL or saturated FA.12Con- sistent with these reports, it is demonstrated that VLDL and palmitic FA (16:0) both significantly increased VCAM1 mRNA in EC in the presence of TNF- .α
Atherosclerosis involves pathological processes that include athermanous plaque formation, foam
cell differentiation, inflammatory reactions, and cell proliferation. Endothelial cell activation by various inflammatory stimuli, including TNF- ,α increases the adherence of monocytes, a crucial step in the development of vascular diseases. The expression of endothelial adhesion molecules, in- cluding vascular cell adhesion molecule-1, endo- thelial-leukocyte adhesion molecule-1, and intra- cellular adhesion molecule-1, plays a pivotal role in monocyte adhesion to the arterial endothe- lium.13 The expression of MCP-1, eotaxin-1, and VCAM1 in TNF- -treated SGBS cells demonα - strates that adipocytes secrete the molecules involved in atherosclerosis upon proinflammatory cytokine treatment, implying that the proinflam- matory cytokine production of overweight sub- jects might be involved in the development of atherosclerosis.
Among these down-regulated genes in this study, ADAMTS1 and MMP15 are metallopro- teinases that degrade extracellular matrix macro- molecules and play important roles in tissue remodeling under many physiological and pathological conditions.14 Fibronectin (FN) is a major component of the extracellular matrix, where it is assembled from insoluble polymers and present in the blood as a soluble dimer.15 It has been reported that ADAMTS1 has ag- grecanase activity and that its activity is enhanced Table 2. Up- or Down-Regulated Genes of Day 20/TNF- -treated SGBS Cellsα
Regulation Gene name Description
UP RGS2 Regulator of g-protein signaling 2
TNFSF13B Tumor necrosis factor (ligand) superfamily, member 13b CH25H Cholesterol 25-hydroxylase
Eotaxin-1 A potent eosinophil chemoattractant MCP-1 Monocyte chemoattractant protein-1
VCAM1 Vascular cell adhesion molecule 1 isoform a precursor DOWN IL1F5 Interleukin 1 family, member 5
ADAMTS1 A disintegrin and metallo-protease with thrombospondin motifs-1 preproprotein
FN1 Fibronectin 1 isoform 1 preproprotein MMP15 Matrix metalloproteinase 15 preproprotein PTGES Prostaglandin E synthase
in cartilage treated with TNF- , retinoic acid, andα 45 kDa fibronectin fragments.16,17 It has also been reported that the expression of several MMPs is elevated in cartilage and synovial tissues of
patients with rheumatoid arthritis and osteoar- thritis.18,19 There have been a few reports that ADAMTS1 and fibronectin are expressed in adipocytes, but their function in adipocytes is not Table 3. Real-Time PCR Analysis of Up- and Down-Regulated Genes of TNF- -treated, Differentiated SGBS Cellsα A) Up-regulated genes
Name Average CT CT CT 2-ΔΔCT
D20 VCAM 29.35 2.90 0 1
MCP-1 31.70 5.25 0 1
Eotaxin-1 32.65 6.20 0 1
CH25 29.00 2.55 0 1
TNFSF13B 30.45 4.00 0 1
RGS2 32.25 5.80 0 1
GAPDH 26.45 - - -
D20//TNF-α VCAM1 27.45 1.10 -1.80 3.48
MCP-1 26.00 -0.35 -5.60 48.50
Eotaxin-1 30.10 3.75 -2.45 5.46
CH25 30.95 4.60 2.05 0.24
TNFSF13B 32.45 6.10 2.10 0.23
RGS2 32.90 6.55 0.75 0.59
GAPDH 26.35 - - -
B) Down-regulated genes
Name Average CT CT CT 2-ΔΔCT
D20 IL1F5 30.80 8.05 0 1
ADAMTS 30.20 7.45 0 1
FN1 22.10 -0.65 0 1
MMP15 26.40 3.65 0 1
PTGES 26.45 3.70 0 1
GAPDH 22.75 - - -
D20/TNF-α IL1F5 33.25 11.55 3.50 0.089
ADAMTS 30.00 8.30 0.85 0.550
FN1 21.95 0.25 0.90 0.500
MMP15 29.10 7.40 3.75 0.074
PTGES 22.65 0.95 -2.75 6.730
GAPDH 21.70 - - -
CT, Avg.sample CT-Avg.GAPDH CT; CT, Avg. CT-Avg. CT, before; 2- CT, normalized sample (after) amount relative to sample (before).
yet known.20,21 Perhaps adipocyte accumulation initiates an imbalance between matrix synthesis and degradation in healthy cartilage, which, in turn, promotes chondral loss and prevents carti- lage self-repair.
IL1F5, a member of the IL-1 family, is relatively abundant in epithelia and may help regulate inflammation in this specific compartment.22 The role of IL1F5, ADAMTS1, FN1, and MMP15 in adipocytes and the reason for their decrease after TNF- treatment, are unknown at the momentα and await further investigation.
In conclusion, we identified several inflamma- tory molecules, newly expressed in SGBS adipocytes, and also found molecular factors that explain the relationship between obesity and atherosclerosis, with a focus on the inflammatory cytokines expressed by TNF- -treated SGBS cells.α
REFERENCES
1. Kershaw EE, Flier JS. Adipose tissue as an endocrine organ. J Clin Endocrinol Metab 2004;89:2548-56.
2. Trayhurn P, Wood IS. Signalling role of adipose tissue:
adipokines and inflammation in obesity. Biochem Soc Trans 2005;33:1078-81.
3. Fantuzzi G. Adipose tissue, adipokines, and inflamma- tion. J Allergy Clin Immunol 2005;15:911-20.
4. Ziccardi P, Nappo F, Giugliano G, Esposito K, Marfella R, Cioffi M, et al. Reduction of inflammatory cytokine concentrations and improvement of endothelial functions in obese women after weight loss over one year. Circulation 2002;105:804-9.
5. Yudkin JS. Adipose tissue, insulin action and vascular disease: inflammatory signals. Int J Obes Relat Metab Disord 2003;27 (Suppl 3):S25-8.
6. Sethi JK, Hotamisligil GS. The role of TNF in adipoα - cyte metabolism. Semin Cell Dev Biol 1999;10:19-29.
7. Grunfeld C, Feingold KR. Regulation of lipid metab- olism by cytokines during host defense. Nutrition 1996;
12(1 Suppl):S24-6.
8. Wabitsch M, Brenner RE, Melzner I, Braun M, Moller P, Heinze E, et al. Characterization of a human preadipocyte cell strain with high capacity for adipose differentiation. Int J Obes Relat Metab Disord 2001;25:
8-15.
9. Sartipy P, Loskutoff DJ. Monocyte chemoattractant protein 1 in obesity and insulin resistance. Proc Natl
Acad Sci USA 2003;100:7265-70.
10. Takahashi K, Mizuarai S, Araki H, Mashiko S, Ishihara A, Kanatani A, et al. Adiposity elevates plasma MCP-1 levels leading to the increased CD11b-positive monocytes in mice. J Biol Chem 2003;278:46654-60.
11. Kodali RB, Kim WJ, Galaria II, Miller C, Schecter AD, Lira SA, et al. CCL11 (Eotaxin) induces CCR3-depen- dent smooth muscle cell migration. Arterioscler Thromb Vasc Biol 2004;24:1211-6.
12. De Caterina R, Bernini W, Carluccio MA, Liao JK, Libby P. Structural requirements for inhibition of cytokine-induced endothelial activation by unsaturated fatty acids. J Lipid Res 1998;39:1062-70.
13. Lyon CJ, Law RE, Hsueh WA. Minireview: adiposity, inflammation, and atherogenesis. Endocrinology 2003;
144:2195-200.
14. Stetler-Stevenson WG, Liotta LA, Kleiner DE Jr. Ex- tracellular matrix 6: role of matrix metalloproteinases in tumor invasion and metastasis. FASEB J 1993;7:1434-41.
15. Hynes RO. The dynamic dialogue between cells and matrices: implications of fibronectin's elasticity. Proc Natl Acad Sci USA 1999;96:2588-90.
16. Caterson B, Flannery CR, Hughes CE, Little CB. Mecha- nisms involved in cartilage proteoglycan catabolism.
Matrix Biol 2000;19:333-44.
17. Stanton H, Ung L, Fosang AJ. The 45 kDa collagen- binding fragment of fibronectin induces matrix metallo- proteinase-13 synthesis by chondrocytes and aggrecan degradation by aggrecanases. Biochem J 2002;364:
181-90.
18. Okada Y. Proteinase and matrix degradation. In: Ruddy S, Harris ED Jr, Sledge CB, editors. Kelly's Textbook of Rheumatology. Philadelphia: WB Saunders Company;
2001. p.55-72.
19. Tetlow LC, Adlam DJ, Woolley DE. Matrix metal- loproteinase and proinflammatory cytokine production by chondrocytes of human osteoarthritic cartilage:
associations with degenerative changes. Arthritis Rheum 2001;44:585-94.
20. Voros G, Maquoi E, Collen D, Lijnen HR. Differential expression of plasminogen activator inhibitor-1, tumor necrosis factor-alpha, TNF-alpha converting enzyme and ADAMTS family members in murine fat territories.
Biochim Biophys Acta 2003;1625:36-42.
21. Boeuf S, Klingenspor M, Van Hal NL, Schneider T, Keijer J, Klaus S. Differential gene expression in white and brown preadipocytes. Physiol Genomics 2001;7:15- 25.
22. Debets R, Timans JC, Homey B, Zurawski S, Sana TR, Lo S, et al. Two novel IL-1 family members, IL-1delta and IL-1epsilon function as an antagonist and agonist of NF- B activation through the orphan IL-1 receptor-κ related protein 2. J Immunol 2001;167:1440-6.