Trend of health care utilization of cleft lip and/or palate in Korea during 2007–2016
Objective: This study is performed to investigate the trend of health care (HC) utilization among cleft lip and/or palate (CL/P) during 2007–2016 by using data from the Korean National Health Insurance Service (KNHIS). Methods: The KNHIS data were reorganized to count a specific patient only once for a specific year. Cleft type (cleft lip [CL], cleft palate [CP], and cleft lip and palate [CLP]), sex, and age at HC utilization were investigated. The study period was divided into the first half (2007–2011) and the last half (2012–2016). The utilization number and rate per 1,000 population were calculated for the total population and for new-born patients. Independent t-test and one-way analysis of variance were used for statistical analyses. Results: The total CL/P population (n = 48,707) comprised 19.2% CLP, 35.5% CL, and 45.3% CP (CLP < CL < CP; p <
0.001). Their HC utilization rate increased from 0.066 in 2007 to 0.118 in 2016.
The new-born patient population (n = 7,617) comprised 18.6% CLP, 30.4% CL, and 51.0% CP (CLP < CL < CP; p < 0.001). Their HC utilization rate increased from 1.12 in 2007 to 1.74 in 2016. An examination of the utilization number and rate among new-born patients revealed CP exhibited a female-dominant pattern (all p < 0.01), while CL and CLP exhibited a male-dominant pattern (all p < 0.01). However, utilization number showed no difference by sex and cleft type between 2007–2011 and 2012–2016. Conclusions: These results might serve as a guideline for HC utilization among patients with CL/P.
[Korean J Orthod 2018;48(4):216-223]
Key words: Cleft lip, Cleft palate, Republic of Korea, National Health Programs, Population surveillance
Mihee Hong
aSeung-Hak Baek
b,ca
Department of Orthodontics, School of Dentistry, Kyungpook National University, Daegu, Korea
b
Department of Orthodontics, School of Dentistry, Seoul National University, Seoul, Korea
c
Dental Research Institute, Seoul National University, Seoul, Korea
Received April 25, 2018; Revised May 31, 2018; Accepted June 2, 2018.
Corresponding author: Seung-Hak Baek.
Professor, Department of Orthodontics, School of Dentistry, Seoul National University, 101 Daehak-ro, Jongno-gu, Seoul 03080, Korea.
Tel +82-2-2072-3952 e-mail [email protected]
© 2018 The Korean Association of Orthodontists.
This is an Open Access article distributed under the terms of the Creative Commons Attribution Non-Commercial License (http://creativecommons.org/licenses/by-nc/4.0) which permits unrestricted non-commercial use, distribution, and reproduction in any medium, provided the original work is properly cited.
pISSN 2234-7518 • eISSN 2005-372X
https://doi.org/10.4041/kjod.2018.48.4.216
INTRODUCTION
Cleft lip and/or palate (CL/P) is one of the most com- mon craniofacial congenital deformities with an inci- dence range of 1:700 to 1:1,000.
1,2Most patients with CL/P need long-term multidisciplinary medical and dental cares for rehabilitation of occlusal function and improvement of facial aesthetics.
Previous studies on the incidence of CL/P have pro- vided useful information for the efficient distribution of health care resources and future health care planning for patients with CL/P.
1-6On the basis of a study of 7.5 million births worldwide, the IPDTOC (International Peri- natal Database of Typical Oral Clefts) Working Group
2determined that the CL/P rate per 1,000 births was 0.99 (0.33 for cleft lip [CL] and 0.66 for cleft lip and palate [CLP]). By analyzing 39 population-based datasets dur- ing 2007–2011, Mai et al.
6reported that the CL/P rate per 1,000 livebirths was 1.45 (0.31 for CL, 0.59 for cleft palate [CP], 0.56 for CLP).
On the basis of an incidence study on East Asian pa- tients with CL/P, Koga et al.
7reported that the incidence of CL/P per 1,000 births in Japan was 1.32 (0.42 for CL, 0.28 for CP, and 0.62 for CLP) and the distribution was 32% with CL, 21% with CP, and 47% with CLP. Accord- ing to Lei et al.
4and Chang et al.,
5the incidence of CL/
P in Taiwan was 1.37 to 1.43 per 1,000 births (0.97–0.99 for CL with/without CP, and 0.4–0.49 for CP only) and the distribution was 66.9% to 70.7% for CL with/with- out CP and 29.3% to 33.1% with CP only.
Analysis of data from several countries that have national oral cleft registries or centralized hospital sys- tems showed a decrease in the prevalence of oral clefts because of early prenatal detection of CL and CLP and legal termination of pregnancy as well as the increased use of folic acid for reducing cleft risk.
4,5,8However, re- garding the prevalence of CP alone, studies have report- ed contradictory results including declined prevalence,
4slightly increased of rate,
5and significant rate change.
8In Korea, on the basis of an analysis of hospital-based data for 20 years, Shin et al.
9reported that the inci- dence of CL/P was 1.33 per 1,000 livebirths (0.51 for CL, 0.33 for CP, and 0.48 for CLP) and the distribution was 38.6% with CL, 36.4% with CLP, and 25% with CP. In a study on Korean young adult males born in 1979 in the four largest cities, Baik et al.
10estimated that the preva- lence of CL/P was 0.65 per 1,000 samples (0.26 for CL, 0.03 for CP, and 0.36 for CLP) and the distribution was 39.9% with CL, 4.9% with CP, and 55.2% with CLP. In addition, Baek et al.
11reported that the distribution of CL, cleft lip and alveolus, CP, and CLP was 7.6%, 19.2%, 9.6% and 63.6%, respectively, in patients undergoing orthodontic treatment at Seoul National University Den- tal Hospital during 1988–1999. Although these studies
reported the incidence of CL/P, they were based on data limited to a specific hospital, sex, or location.
Since 1989, claims for primary surgical treatment of patients with CL/P in Korea have been centralized to the Korean National Health Insurance Service (KNHIS). Kim et al.
12estimated that the incidence of CL/P in 1993 was 1.81 per 1,000 and the distribution was 34.1% with CL, 35.8% with CP, and 30.1% with CLP. On the basis of an analysis of the KNHIS data during 2005–2006, Kim et al.
13reported that the incidence of CL/P was 3.9% of all birth defects and 1.11 per 1,000 livebirths, without mentioning the ratio of cleft types. However, there is no consensus regarding whether the degree of health care utilization among patients with CL/P in Korea has re- mained constant or has changed during the last decade.
Although Korea does not have a national registry yet, this study is, to our knowledge, the first trial aimed at understanding the trend of nationwide incidence/preva- lence of oral cleft types by using the KNHIS data. If the KNHIS data could be reorganized to count a specific pa- tient only once for a specific year, it could be regarded as a substitute for population-based epidemiologic data in Korea.
Furthermore, the KNHIS is set to provide insurance benefits for orthodontic treatment to patients with CL/
P from late 2018. Therefore, the purpose of this study was to investigate the trend of health care utilization among patients with CL/P during 2007–2016 by using the KNHIS data.
MATERIALS AND METHODS
Collection of primary data
The KNHIS data covers primary cheiloplasty, palato- plasty, or alveolar bone grafting for patients with CL/P.
This retrospective epidemiologic study tried to analyze the KNHIS data claimed by medical and dental institu- tions throughout Korea during 2007–2016. When the data were requested, the KNHIS checked the error of data processing and confirmed the integrity of the data.
The population data were obtained via the website or dataset on demand from the Korean Statistical Infor- mation Service (KOSIS) and National Archives of Korea (NAK). According to the KOSIS and NAK data, the num- ber of total new-births in Korea was 4,378,608 and the sum of the annual population in Korea was 500,613,900 during 2007–2016. From these data, we extracted the total population per year, sex-specific population per year, and specific age population during 2007–2016.
Reorganization of the year-based secondary dataset for counting the number of patients with CL/P who used the KNHIS
The original insurance claim data were reorganized
to count a specific patient with CL/P only once for a specific year even though he/she visited health care fa- cilities more than one time in the same year. Therefore, the KNHIS provided a year-based secondary dataset for counting the number of patients with CL/P.
Classification of cleft types
The 10th revision of ICD (International Classification of Diseases) and Related Health Problems was used to classify cleft types. Codes including Q35, Q35.1, Q35.3, Q35.5, Q35.7, and Q35.9 were for CP; codes including Q36, Q36.0, Q36.1, and Q36.9 were for CL; and codes including Q37, Q37.0, Q37.1, Q37.2, Q37.3, Q37.4, Q37.5, Q37.8, and Q37.9 were for CLP.
Grouping of patients with CL/P
Cleft type (CL, CP, and CLP), sex, and age at the time of health care utilization were divided into subgroups.
The period of 2007–2016 was also divided into the first half (2007–2011) and the last half (2012–2016).
The number and rate of health care utilization among patients with CL/P in all age groups
In order to calculate the rates per 1,000 population of health care utilization among patients with CL/P, the number of patients with CL/P, CL, CP, and CLP per year was divided by the population of the same year and then multiplied by 1,000. The number and rate per 1,000 population of health care utilization according to each cleft type were compared between male and female pa- tients. The average number and rate of CP/L, CP, CL and CLP during 2007–2011 were compared with those dur- ing 2012–2016.
Distribution of the number and percentage of patients with CL/P in each age group
The patients were divided into 5-year age groups as
follows: “0–4” years old was the first age group, “5–9”
years old was the second age group, and the rest of them were grouped into similar 5-year age groups until the age “80” years old. Patients aged above “80” years old were included into a single group. The distribution of the number and percentage of patients with CL/P in each age group was investigated to understand the trend of health care utilization.
The number and rate of health care utilization among patients with CL/P in the new-born group
The rate of health care utilization during the birth year (for new-borns) was calculated as follows: health care utilization number of the new-born group was di- vided by the birth population of the same year and then multiplied by 1,000.
The rates per 1,000 births in the new-born group dur- ing 2007–2016 were compared by sex and cleft type (CP, CL, and CLP). Then, the average rates of CP/L, CP, CL, and CLP in the new-born group from the first half (2007–2011) were compared with those from the last half (2012–2016).
Statistical analysis
Independent t-test, one-way analysis of variance, and multiple comparisons with Tukey’s honestly significant difference test were used for statistical analyses. Bonfer- roni correction was applied to protect from Type 1 error when comparing the number and rate of health care utilization between the first half (2007–2011) and the last half (2012–2016) among the cleft types for both the total and new-born patient populations. The new p- value was the alpha-value (a
original= 0.05) divided by the number of comparisons (12): (a
altered= 0.05/12) = 0.0041.
The p-values ≤ 0.0041 were considered statistically sig- nificant.
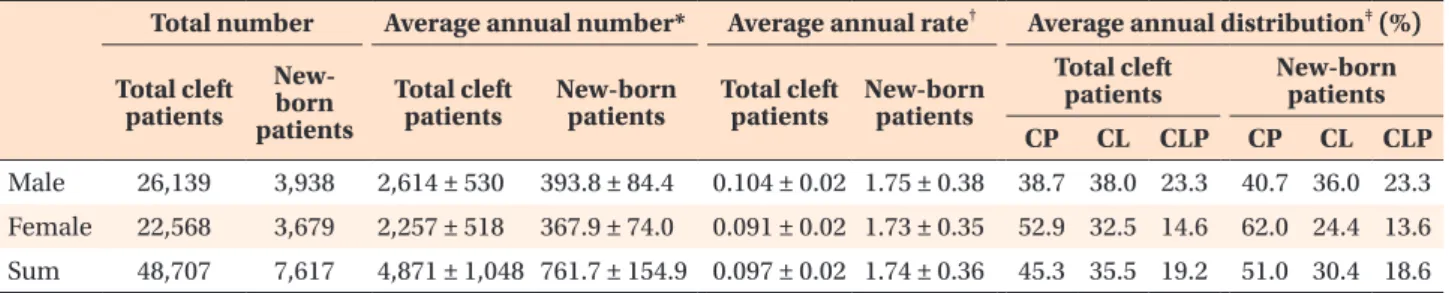
Table 1. Demographic data of the number and rate of health care utilization and the distribution of cleft types in the total and new-born patient populations with CL/P during 2007–2016
Total number Average annual number* Average annual rate
†Average annual distribution
‡(%) Total cleft
patients
New- born patients
Total cleft
patients New-born
patients Total cleft
patients New-born patients
Total cleft
patients New-born patients
CP CL CLP CP CL CLP
Male 26,139 3,938 2,614 ± 530 393.8 ± 84.4 0.104 ± 0.02 1.75 ± 0.38 38.7 38.0 23.3 40.7 36.0 23.3 Female 22,568 3,679 2,257 ± 518 367.9 ± 74.0 0.091 ± 0.02 1.73 ± 0.35 52.9 32.5 14.6 62.0 24.4 13.6 Sum 48,707 7,617 4,871 ± 1,048 761.7 ± 154.9 0.097 ± 0.02 1.74 ± 0.36 45.3 35.5 19.2 51.0 30.4 18.6 Values are presented as number only, mean ± standard deviation, or percent data only.
Rate, Health care utilization number divided by the 1,000 population of that year; CL/P, cleft lip and/or palate; CP, cleft palate;
CL, cleft lip; CLP, cleft lip and palate.
*Sum of the number of specific patients with CL/P in a specific year / duration;
†sum of the number of specific patients with
CL/P divided by the 1,000 papulation in a specific year / duration;
‡sum of the number of specific patients with CL/P in a
specific duration × 100 / sum of CP, CL, and CLP in specific patient groups for a specific duration.
RESULTS
The number and rate of health care utilization in the total and new-born patient populations
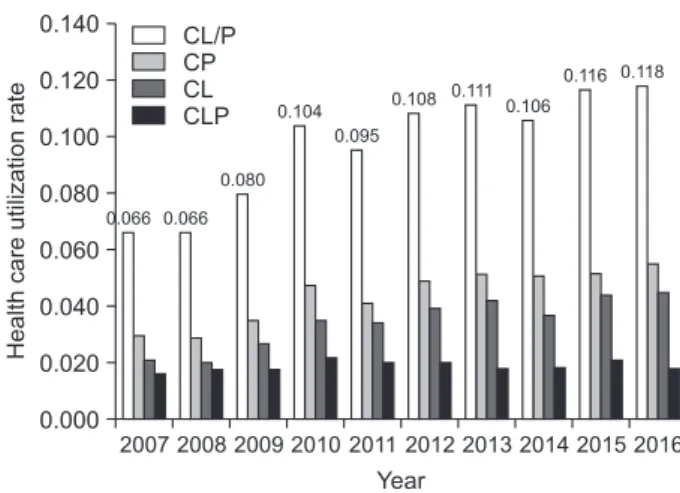
The total number and average rate of health care uti- lization per 1,000 births in the total patient population were 48,707 and 0.097, respectively (Table 1). The mean utilization rate in the total patient population increased from 0.066 in 2007 to 0.118 in 2016 (Figure 1).
The total number and average rate of health care utilization per 1,000 births in the new-born patient population were 7,617 and 1.74, respectively (Table 1).
Although the rate of health care utilization per 1,000 births showed a fluctuation, it increased from 1.12 in 2007 to 1.74 in 2016 (Figure 2).
Comparison of the number and rate of health care utilization between cleft type, sex, and age groups in the total patient population during 2007–2016
The total patient population comprised 45.3% with CP (n = 22,056), 35.5% with CL (n = 17,268), and 19.2%
with CLP (n = 9,383) (Table 1). The annual mean num- ber and rate of the CP group (2,206 and 0.044) were the largest, followed by the CL group (1,727 and 0.034) and CLP group (938 and 0.019) (CLP < CL < CP; all p <
0.001).
In the male population, the composition of CP, CL, and CLP was 38.7%, 38.0%, and 23.3%, respectively (Table 1). The annual mean number and rate of the CLP group were smaller than those of the CP and CL groups (CLP < [CL, CP]; all p < 0.001). In the female popula- tion, the composition of CP, CL, and CLP was 52.9%, 32.5%, and 14.6%, respectively (Table 1). The annual mean number and rate of the CP group were the largest, followed by the CL group and the CLP group (CLP < CL
< CP; all p < 0.001).
The number and rate per 1,000 population of health care utilization in the total population of patients with CL/P and CP were not different between the male and female patients (all p > 0.05). However, a male-domi- nant pattern was observed in the CL (994 and 0.040 in males vs. 733 and 0.029 in females; all p < 0.05) and CLP (609 and 0.024 in males vs. 329 and 0.013 in fe- males; all p < 0.001) groups.
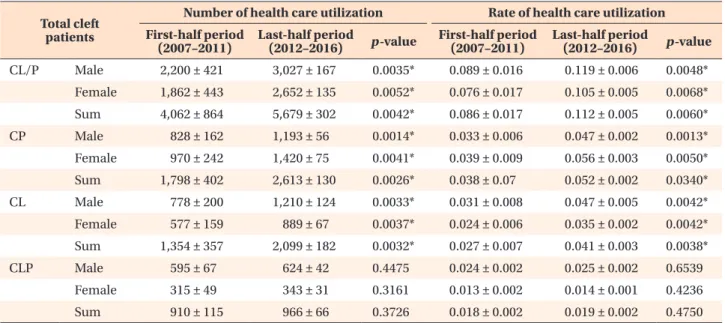
The total annual number of patients with CL/P dur- ing the last half (2012–2016) was marginally higher than that during the first half (2007–2011) after Bonferroni correction (5,679 in 2012–2016 vs. 4,062 in 2007–2011;
p = 0.0042; Table 2). The annual number of patients with CP and CL during 2012–2016 was significantly higher than that during 2007–2011 after Bonferroni correction (2,613 with CP and 2,099 with CL during 2012–2016 vs. 1,798 with CP and 1,354 with CL during 2007–2011; all p < 0.0041; Table 2). However, the annu- al number and rate per 1,000 population with CLP were not different between the two periods after Bonferroni correction (966 and 0.019 during 2012–2016 vs. 910 and 0.018 during 2007–2011; all p > 0.0041; Table 2).
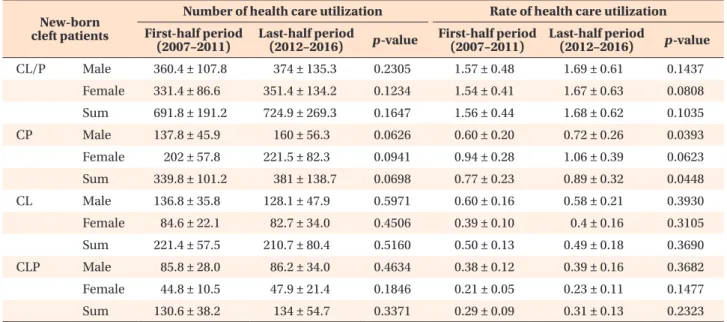
Comparison of the number and rate of health care utilization between cleft types and sexes in the new- born group during 2007–2016
New-born patients with CL/P included 51.0% with CP (n = 3,884), 30.4% with CL (n = 2,314) and 18.6% with CLP (n = 1,419) (Table 1). The annual mean number and rate of utilization were the largest in the CP group (388.4 and 0.89), followed by the CL group (231.4 and 0.53), and CLP group (141.9 and 0.32) (CLP < CL < CP); all p
< 0.001; Table 3).
In the male population, the composition of CP, CL,
Healthcareutilizationrate
2007
Year 0.000
0.140
0.120
0.100
0.080
0.060
0.040
0.020
CL/P CP CL CLP
2008 2009 2010 2011 2012 2013 2014 2015 2016 0.066
0.080 0.104
0.095
0.108 0.111 0.106
0.116 0.118
0.066
Figure 1. Change in the health care utilization rate of patients with CL/P during 2007–2016.
CL/P, Cleft lip and/or palate; CP, cleft palate; CL, cleft lip;
CLP, cleft lip and palate.
Healthcareutilizationrate
2007
Year 0.00
2.50
2.00
1.50
1.00
0.50
CL/P CP CL CLP
2008 2009 2010 2011 2012 2013 2014 2015 2016 1.74
1.12 1.20 1.42
2.02 1.97
1.90 1.99 2.04 2.02