Original Article
Risk Factors for Endothelial Cell Loss after Phacoemulsification:
Comparison in Different Anterior Chamber Depth Groups
Yang Kyeung Cho
1, Hwa Seok Chang
2, Man Soo Kim
31
Department of Ophthalmology, St. Vincent’s Hospital, The Catholic University of Korea, Suwon, Korea
2
Department of Veterinary Surgery, KonKuk University, Seoul, Korea
3
Department of Ophthalmology, Seoul St. Mary Hospital, The Catholic University of Korea, Seoul, Korea
Purpose: To assess the risk factors for endothelial cell loss after phacoemulsification with implantation of intraocular lens according to anterior chamber depth (ACD).
Methods: This prospective study included 94 eyes of 94 patients undergoing phacoemulsification cataract surgery.
To assess the risk factors for corneal endothelial cell loss, we examined seven variables at 1 day, 1 week, 6 weeks, and 12 weeks postoperatively in each ACD-stratified group.
Results: Multiple linear regression analysis showed that the only variable influencing the percentage decrease in corneal endothelial cell density throughout the postoperative follow-up period in the long ACD group (ACD III) was nucleosclerosis. The variables influencing the percentage decrease in corneal endothelial cell density in the short ACD group (ACD I) at one day and one week postoperatively were corneal incisional tunnel length and nucleosclerosis.
Conclusions: Risk factors for endothelial cell loss after phaoemulsification were different according to ACD. Long corneal tunnel length can be one of the risk factors for endothelial cell loss in short ACD eyes.
Key Words: Endothelial cell density, Phacoemulsification, Tunnel length
Received:April 22, 2009 Accepted: December 31, 2009
Reprint requests to Man Soo Kim. Department of Ophthalmology, The Catholic University of Korea, Seoul St. Mary Hospital, #505 Banpo-dong, Seocho-gu, Seoul 137-701, Korea. Tel: 82-2-2258-6197, Fax: 82-2-599- 7405, E-mail: [email protected]
ⓒ 2010 The Korean Ophthalmological Society
This is an Open Access article distributed under the terms of the Creative Commons Attribution Non-Commercial License (http://creativecommons.org/licenses /by-nc/3.0/) which permits unrestricted non-commercial use, distribution, and reproduction in any medium, provided the original work is properly cited.
Past reports have shown that several preoperative and in- traoperative parameters may influence the risk of endothelial cell loss after phacoemulsification. Risk of endothelial cell damage increases with a high nucleus grade, advanced age, long phacoemulsification time (Phaco time), high ultrasound energy, small pupil diameter, large infusion volume, type of intraocular lens (IOL), and short axial length [1-7]. Additionally, phacoemulsification surgery is performed in a limited, confined space. Adequate space can lessen the damage induced by the phacoemulsification procedure. We also believe that risk factors could variably influence the corneal endothelium in different anterior chamber depth (ACD) conditions; even though the vari- able (ACD) does not affect the degree of endothelial cell damage, the ACD can influence the effect of other variables on the endothelium. In this study, we examined the effects of
several preoperative and intraoperative parameters on corneal endothelial cell density after phacoemulsification in different ACD-stratified groups.
We also paid particular attention to a new variable, corneal incisional tunnel length, and its role in postoperative endothe- lial cell loss in ACD-stratified groups.
Materials and Methods
We prospectively examined 94 eyes of 94 patients sched- uled to undergo phacoemulsification surgery.
Exclusion criteria included the following: a history of pre- vious ocular surgery or inflammation, glaucoma, corneal pathology, trauma, and intraoperative complications such as posterior capsule rupture or postoperative complications.
All procedures were performed by the same surgeon using
retrobulbar anesthesia. A 3.0 mm clear corneal incision was
made in the superior quadrant. A capsulorhexis approximately
5.0 mm in diameter was created with forceps, then cortical
cleaving hydrodissection was performed. The nucleus was
emulsified using the stop and chop technique. After irrigation
and aspiration of the cortex, a foldable acrylic IOL (SN60WF;
Fig. 1. Corneal incisional tunnel length (A) and corneal incision length (B).
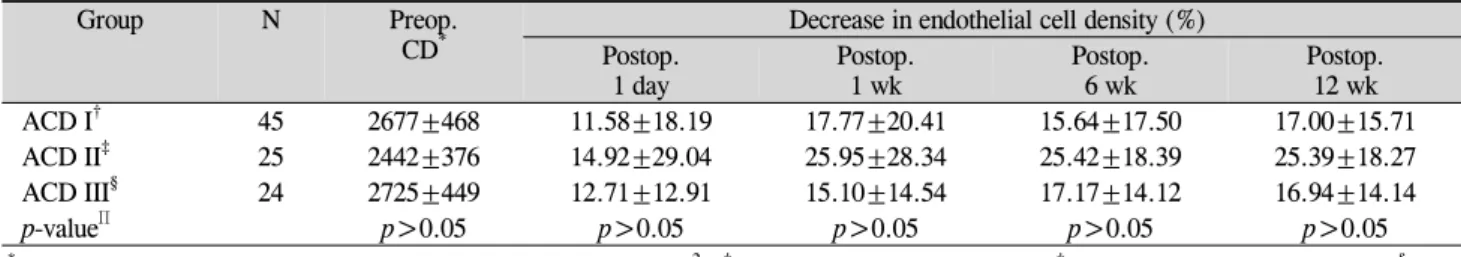
Table 1. Percentage decrease in endothelial cell density and percentage increase in corneal thickness in the anterior chamber depth (ACD) stratified group
Group N Preop.
CD
*Decrease in endothelial cell density (%) Postop.
1 day Postop.
1 wk Postop.
6 wk Postop.
12 wk
ACD I
†45 2677±468 11.58±18.19 17.77±20.41 15.64±17.50 17.00±15.71
ACD II
‡25 2442±376 14.92±29.04 25.95±28.34 25.42±18.39 25.39±18.27
ACD III
§24 2725±449 12.71±12.91 15.10±14.54 17.17±14.12 16.94±14.14
p-value
Πp>0.05 p>0.05 p>0.05 p>0.05 p>0.05
*
Preop CD: preoperative corneal endothelial cell density (cells/mm
2);
†ACD I (1.5<ACD≤2.5 mm);
‡ACD II (2.5<ACD≤3.5 mm);
§ACD III (3.5<ACD≤4.5 mm);
Πp<0.05, statistically significant.
Alcon Laboratories Inc., Fort Worth, TX, USA) was implanted in the bag. The same irrigating solution (balanced salt solution, BSS) and the same type of ophthalmic viscosurgical device (OVD, sodium hyaluronate 1.2%) were used for all patients.
Preoperatively, axial length (mm) and ACD (mm) were recorded using ultrasound A scanning (Compact II device;
Quantel Medical Inc., Bozeman, MT, USA). Eyes were stratified into groups based on ACD as follows: ACD I, 1.5<ACD≤2.5 mm; ACD II, 2.5<ACD≤3.5 mm; ACD III, 3.5<ACD≤4.5 mm. Nuclear opacity was graded from 1 to 4 using the Lens Opacities Classification System. To evaluate central corneal endothelial cell density, specular microscopic photographs of the central corneal endothelium were taken using a non-contact specular microscope (noncon robo;
Konan Medical Inc., Hyogo, Japan). We analyzed a minimum of 40 endothelial cells to calculate the endothelial cell density.
Corneal endothelial cell loss was evaluated by measuring the percentage decrease in endothelial cell density of the central cornea (cells/mm
2).
The percentage decrease in central corneal endothelial cell density was expressed as: (preoperative central corneal endothelial cell density-postoperative central corneal endothelial cell density)×100/preoperative central corneal endothelial
cell density.
Intraoperatively, we recorded phaco energy: (phacoem- ulsification time (seconds)×phacoemulsification power (%), total surgical time (min) and volume of irrigating solution (balanced salt solution, ml) used.
The corneal incisional tunnel length (mm) was measured with calipers (Fig. 1). Several factors affect the tunnel length, including the sharpness of the blade, the angle of approach of the blade and the thickness of the corneal tissue [8, 9].
The tunnel length was graded from 1 to 3 as follows:
Grade 1, less than 1 mm; Grade 2, 1.0 to less than 2.0 mm;
Grade 3, 2.0 to less than 3.0 mm.
Postoperatively, specular microscopic photographs of the central corneal endothelium were taken using a non-con- tact specular microscope at postoperative day 1, week 1, week 6, and week 12.
Statistical analyses were conducted using SPSS ver.
11.5 (SPSS Inc., Chicago, IL, USA). We compared percent- age decreases in endothelial cell density using a one-way analysis of variance (ANOVA) according to ACD group.
Univariate association of the seven variables (age, axial length, nucleosclerosis, tunnel length, operation time, irri- gation volume, and phaco energy) with a decrease in en- dothelial cell density was evaluated by simple regression analysis. A multiple linear regression analysis with a step- wise regression was used to determine the best-fitting set of variables contributing to decreases in endothelial cell density.
p-values <0.05 were considered statistically significant.
Results
Before ACD stratification of all eyes, neither ACD nor axial length was associated with percentage decrease in endothelial cell density at 1 day, 1 week, 6 weeks, and 12 weeks postoperatively (p>0.05).
The percentage decrease in central endothelial cell density at 1 day, 1 week, 6 weeks, and 12 weeks postoperatively was not significantly different among the ACD-stratified groups (p>0.05) (Table 1).
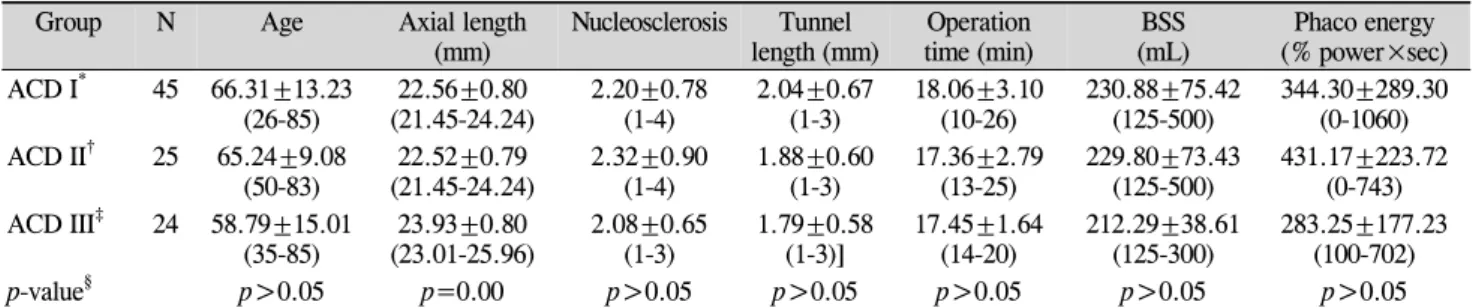
Table 2 shows the distribution of seven variables in the
ACD stratified group. The long ACD group (Group ACD III)
showed a longer axial length than ACD Groups I and II.
Table 2. Distribution of variables in the anterior chamber depth (ACD) stratified group
Group N Age Axial length
(mm) Nucleosclerosis Tunnel
length (mm) Operation
time (min) BSS
(mL) Phaco energy (% power×sec) ACD I
*45 66.31±13.23
(26-85) 22.56±0.80
(21.45-24.24) 2.20±0.78
(1-4) 2.04±0.67
(1-3) 18.06±3.10
(10-26) 230.88±75.42
(125-500) 344.30±289.30 (0-1060) ACD II
†25 65.24±9.08
(50-83) 22.52±0.79
(21.45-24.24) 2.32±0.90
(1-4) 1.88±0.60
(1-3) 17.36±2.79
(13-25) 229.80±73.43
(125-500) 431.17±223.72 (0-743) ACD III
‡24 58.79±15.01
(35-85) 23.93±0.80
(23.01-25.96) 2.08±0.65
(1-3) 1.79±0.58
(1-3)] 17.45±1.64
(14-20) 212.29±38.61
(125-300) 283.25±177.23 (100-702)
p-value
§p>0.05 p=0.00 p>0.05 p>0.05 p>0.05 p>0.05 p>0.05
Values are presened as mean±SD (range).
BSS=balanced salt solution.
*
ACD I (1.5<ACD≤2.5 mm);
†ACD II (2.5<ACD≤3.5 mm);
‡ACD III (3.5<ACD≤4.5 mm);
§p<0.05, statistically significant.
Table 3. Univariate association of the seven variables with the percentage decrease in central corneal endothelial cell density in each anterior chamber depth (ACD) stratified group
Group Variables 1 day 1 wk 6 wk 12 wk
Corr. Coeff p-value
*Corr. Coeff p-value
*Corr. Coeff p-value
*Corr. Coeff p-value
*ACD I
†Age 0.242 0.10 0.287 0.06 0.250 0.10 0.290 0.06
Axial length -0.032 0.83 0.018 0.90 0.082 0.59 0.059 0.70
Nucleosclerosis 0.383 0.00 0.685 0.00 0.415 0.00 0.481 0.00
Tunnel length 0.425 0.00 0.562 0.00 0.353 0.02 0.437 0.00
Operation time -0.179 0.23 -0.223 0.15 -0.125 0.41 -0.166 0.28
Irrigation volume 0.136 0.37 0.122 0.42 0.027 0.86 0.150 0.33
Phaco energy 0.449 0.00 0.493 0.00 0.379 0.01 0.530 0.00
ACD II
‡Age -0.005 0.96 -0.262 0.20 -0.004 0.98 0.009 0.96
Axial length -0.048 0.81 0.170 0.41 0.202 0.33 0.250 0.23
Nucleosclerosis 0.687 0.00 0.586 0.00 0.201 0.33 0.211 0.31
Tunnel length 0.532 0.00 0.406 0.04 0.172 0.41 0.155 0.46
Operation time -0.054 0.79 -0.106 0.61 0.042 0.84 -0.016 0.94
Irrigation volume -0.l74 0.40 -0.285 0.16 -0.016 0.93 -0.034 0.87
Phaco energy 0.576 0.00 0.455 0.02 0.491 0.01 0.481 0.02
ACD III
§Age 0.146 0.49 0.283 0.18 0.281 0.18 0.278 0.19
Axial length 0.272 0.19 0.077 0.72 0.048 0.82 0.052 0.80
Nucleosclerosis 0.779 0.00 0.600 0.00 0.743 0.00 0.743 0.00
Tunnel length -0.381 0.08 -0.018 0.93 -0.273 0.20 -0.267 0.20
Operation time -0.391 0.06 -0.174 0.41 -0.332 0.11 -0.332 0.11
Irrigation volume -0.040 0.85 0.054 0.80 0.227 0.28 0.229 0.28
Phaco energy 0.147 0.49 0.337 0.10 0.478 0.02 0.469 0.02
Corr. Coeff=correlation coefficient.
*
ACD I (1.5<ACD≤2.5 mm);
†ACD II (2.5<ACD≤3.5 mm);
‡ACD III (3.5<ACD≤4.5 mm);
§p<0.05, statistically significant.
Table 3 shows the correlations of the seven variables on univariate analysis with the percentage decrease in central endothelial cell density at postoperative day 1, week 1, week 6, and week 12 in the ACD-stratified groups.
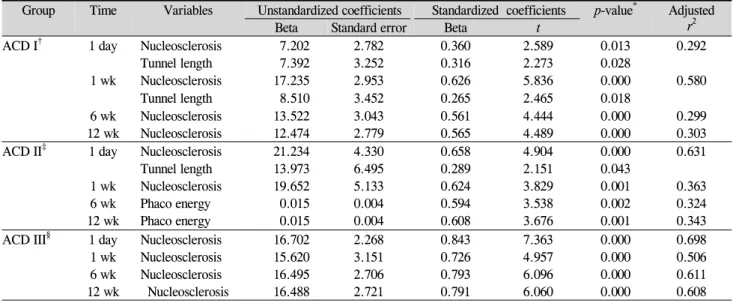
Table 4 shows a stepwise multiple regression analysis model to identify the best set of independent predictors of percentage decrease in corneal endothelial cell density at 1 day, 1 week, 6 weeks, and 12 weeks postoperatively in the ACD-stratified groups.
Endothelial Cell Density Group ACD I
As shown in Table 3, on simple regression analysis, the
significant factors for percentage decrease in central endo-
thelial cell density at postoperative day 1 were nucleosclerosis
(r=0.383, p=0.000), tunnel length (r=0.425, p=0.000) and
phaco energy (r=0.449, p=0.000). The significant factors at
postoperative week 1 were nucleosclerosis (r=0.685, p=0.000),
tunnel length (r=0.562, p=0.000) and phaco energy (r=0.493,
p=0.000). The significant factors at postoperative week 6
Table 4. Final stepwise multiple regression model for predicting decrease in endothelial cell density in each anterior chamber depth (ACD) stratified group
Group Time Variables Unstandardized coefficients Standardized coefficients p-value
*Adjusted r
2Beta Standard error Beta t
ACD I
†1 day Nucleosclerosis 7.202 2.782 0.360 2.589 0.013 0.292
Tunnel length 7.392 3.252 0.316 2.273 0.028
1 wk Nucleosclerosis 17.235 2.953 0.626 5.836 0.000 0.580
Tunnel length 8.510 3.452 0.265 2.465 0.018
6 wk Nucleosclerosis 13.522 3.043 0.561 4.444 0.000 0.299
12 wk Nucleosclerosis 12.474 2.779 0.565 4.489 0.000 0.303
ACD II
‡1 day Nucleosclerosis 21.234 4.330 0.658 4.904 0.000 0.631
Tunnel length 13.973 6.495 0.289 2.151 0.043
1 wk Nucleosclerosis 19.652 5.133 0.624 3.829 0.001 0.363
6 wk Phaco energy 0.015 0.004 0.594 3.538 0.002 0.324
12 wk Phaco energy 0.015 0.004 0.608 3.676 0.001 0.343
ACD III
§1 day Nucleosclerosis 16.702 2.268 0.843 7.363 0.000 0.698
1 wk Nucleosclerosis 15.620 3.151 0.726 4.957 0.000 0.506
6 wk Nucleosclerosis 16.495 2.706 0.793 6.096 0.000 0.611
12 wk Nucleosclerosis 16.488 2.721 0.791 6.060 0.000 0.608
*