J Vet Sci 2015, 16(4), 439-446ㆍhttp://dx.doi.org/10.4142/jvs.2015.16.4.439 JVS
Received 27 Nov. 2014, Revised 12 Feb. 2015, Accepted 30 Apr. 2015
*Corresponding authors: Tel: +86-538-8242673; Fax: +86-538-8241419; E-mails: [email protected] (L Wang), [email protected] (ZH Wang)
Journal of Veterinary Scienceㆍⓒ 2015 The Korean Society of Veterinary Science. All Rights Reserved.
This is an Open Access article distributed under the terms of the Creative Commons Attribution Non-Commercial License (http://creativecommons.org/licenses/
pISSN 1229-845X eISSN 1976-555X
Effects of chelated Zn/Cu/Mn on redox status, immune responses and hoof health in lactating Holstein cows
Xue-Jun Zhao
1, Zhong-Peng Li
1, Jun-Hong Wang
2, Xiang-Ming Xing
3, Zhen-Yong Wang
1, Lin Wang
1,*, Zhong-Hua Wang
1,*
1
College of Animal Science and Veterinary Medicine, Shandong Agricultural University, Taian 271018, China
2
Institute of Dairy Science, Zhejiang University, Hangzhou 310029, China
3
Qingdao BoYu Farm Co., Ltd., Qingdao 266600, China
To evaluate the effects of chelated Zn/Cu/Mn on redox status, immune responses and hoof health in lactating Holstein cows, 48 head in early lactation were divided into healthy or lame groups according to their gait score. Cows were fed the same amount of Zn/Cu/Mn as sulfate salts or in chelated forms for 180 days, and foot-and-mouth disease (FMD) vaccine was injected at day 90. The results showed that lame cows had lower antioxidant function, serum Zn/Mn levels, hair Cu levels, and hoof hardness. Moreover, increased antioxidant status, FMD antibody titers, serum and hair levels of Zn/Cu/Mn, and hoof hardness and decreased milk fat percent and arthritis biomarkers were observed in cows fed chelated Zn/Cu/Mn. In summary, supplementation with chelated Zn/Cu/Mn improved antioxidant status and immune responses, reduced arthritis biomarkers, and increased accumulation of Zn/Cu/Mn in the body and hoof hardness in dairy cows.
Keywords: chelated trace mineral, healthy cow, hoof, lame cow, redox status
Introduction
Trace minerals such as Zn, Cu and Mn are necessary for health in dairy cows because they play important roles in protein synthesis, body metabolism, formation of connective tissue and immune system function [16]. Moreover, they are present in many metalloenzymes involved in the antioxidant process [23]. Oxidative stress is an important pathogenic factor in many diseases [3] that has also recently been found to be involved in the development of lameness in cows [4].
Lameness is a crucial welfare issue in modern dairy husbandry that could result in serious economic losses to dairy producers [27] because of decreased milk yield [5], reduced fertility [7,21], and increased treatment costs and culling rates [8]. Indeed, lameness has been identified as the third most important health problem in dairy farming following mastitis and infertility [17]. However, it has been shown that supplemental trace minerals (such as Cu, Zn and Mn) may help reduce the incidence of lameness [34].
Regarding trace mineral sources, sulfate salts are readily available and widely used as sources of inorganic trace elements [38], but their efficiency of absorption is very low
[26]. Organic trace minerals are reportedly absorbed, stored, metabolized, and transferred more efficiently than in their inorganic forms [29]. Organic forms of Zn, Cu, and Mn have been developed to increase intestinal absorption and mineral bioavailability [40]. Furthermore, Nocek et al. [25] found that supplementation with organic trace minerals can reduce the incidence of lameness. Therefore, this experiment was designed to determine the effects of dietary Zn/Cu/Mn applied as sulfate salts or metal methionine hydroxyl analogs on production performance, different biochemical indicators and indices related to hoof health.
Materials and Methods
Animals, diets and experimental design
All experiments were reviewed and approved by the Animal
Care and Use Committee of Shandong Agricultural University
(approval no. 2013-03). Cows selected in this experiment were
of similar parity, lactation, and milk production. Before the start
of the experiment, the gait score of each cow was determined
using a 5-point gait score system (Table 1) [31]. Cows were
assigned into two groups of 24 cows each for health or lameness
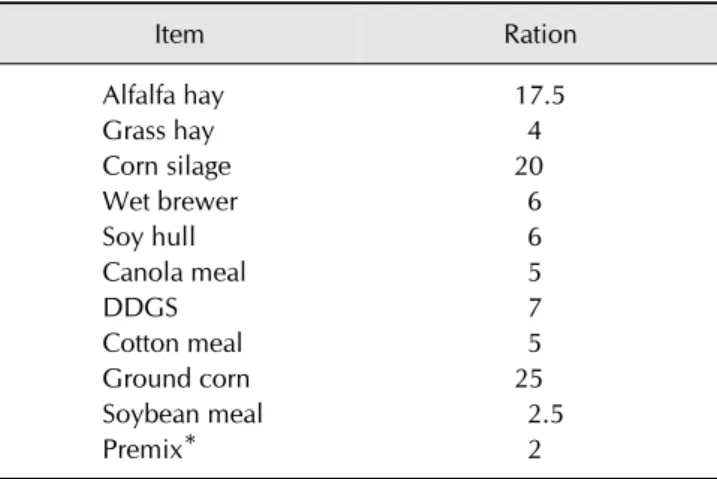
Table 2. Ingredient composition of the basal diet (%, DM basis)
Item Ration
Alfalfa hay 17.5
Grass hay 4
Corn silage 20
Wet brewer 6
Soy hull 6
Canola meal 5
DDGS 7
Cotton meal 5
Ground corn 25
Soybean meal 2.5
Premix* 2
*Formulated to provide (per kg of DM) 200,000 IU of vitamin A, 51,000 IU of vitamin D, 1,400 IU of vitamin E, 18 mg of Se, 10 mg of Co, 40 mg of I, and 1,000 mg of Fe. DM, dried matter; DDGS, dried distillers grains with solubles.
Table 3. Chemical composition of the basic diet
Item Ration
Nutrient (% of DM)
CP 16.45 ± 0.26
EE 4.8 ± 0.12
ADF 20.9 ± 0.87
NDF 34.4 ± 1.75
Ash 7.5 ± 0.36
Ca 0.88 ± 0.05
P 0.45 ± 0.03
NEl (Mcal/kg) 1.73 ± 0.04
Trace mineral (mg/kg)
Zn 33.2 ± 2.58
Cu 8.5 ± 0.87
Mn 32.1 ± 2.72
CP, crude protein; EE, ether extract; ADF, acid detergent fiber; NDF, neutral detergent fiber.
Table 1. Method for assessing gait score
Score Description
1 Smooth and coherent gait, flat back, uniform stride.
2 Slightly uneven gait, mild joint stiffness, no visible lameness.
3 Uneven gait, arched back, slight lameness.
4 Obvious head bobs, obvious arched back, obvious lameness.
5 Extreme difficulty in walking, severely arched back, severe lameness.
based on their gait score (1 and 2 indicate health and 3, 4 and 5 lameness). Cows in each group were assigned to the following two treatments: (1) control (CON): 50 mg Zn, 12 mg Cu, 20 mg Mn/kg DM as sulfate salts; (2) chelated trace mineral (CTM):
50 mg Zn, 12 mg Cu, 20 mg Mn/kg DM as metal methionine hydroxyl analog (Novus international, USA). The trial lasted for 180 days. Cows were injected with 2 mL of foot-and-mouth disease (FMD) trivalent inactivated vaccine (catalog no.
20130826; Jinyu Baoling Bio-pharmaceutical, China) at day 90 of the experiment period. Cows were housed in individual tie stalls and milked three times a day (3:00 AM, 10:00 AM, and 5:00 PM) while receiving the diets. All cows in this experiment had free access to water and received the same basal diet (Table 2). Basal diet samples were analyzed monthly, and all samples were well above the Nutrient Research Council requirements (Table 3) [26]. Dry matter intake (DMI) was also recorded monthly.
Sampling, measurement, and analysis
Milk yield of the experimental cows was recorded every 10 days, and milk samples were collected for analysis of fat, protein, lactose, and solid non-fat (SNF). Additionally, 15 mL of blood was sampled from the coccygeal vein on day 0, 90, and 180. Serum samples were obtained by centrifuging the blood samples at 1,500 × g for 10 min, then stored at −20
oC for later analysis of glutathione peroxidase (GSH-Px), superoxide dismutase (SOD), catalase (CAT) activities, reduced glutathione (GSH), oxidized glutathione (GSSG), malondialdehyde (MDA), metallothionein (MT), procollagen-II N-terminal peptide (PIIANP), C-terminal telopeptide of type II collagen (CTX-II), cartilage oligomeric matrix protein (COMP), interleukin 1 (IL-1), immunoglobulin A (IGA), and Zn/Cu/Mn levels. Serum GSH-Px, SOD, and CAT activities and GSH, GSSG, and MDA levels were measured by spectrophotometry with commercial kits (Jiancheng, China). Serum MT, PIIANP, CTX-II, COMP, IL-1 and IGA were determined using the double-antibody sandwich enzyme-linked immunosorbent assay (ELISA) method with commercial kits (Lengton, China).
In addition, blood samples were collected at day 90, 120, 150, and 180 of the experimental period for analysis of FMD antibody titers. FMD antibody titers (A, O, and Asia I) were measured by the liquid-phase blocking ELISA method with commercial kits (Liquid-phase Blocking ELISA Kit for Detecting Foot-and-Mouth Disease Virus Type A/O/Asia I Antibodies, Lanzhou Veterinary Research Institute, China).
FMD antibody titers were log
2transformed before analysis to obtain homogeneity of the residual variance.
At day 0, 90 and 180 of the experiment period, hoof hardness
of the apex sole in the heel was tested using a Shore Scale D
durometer to measure the ball indentation hardness. Five
Table 4. Effects of chelated Zn/Cu/Mn on dairy cow performance
Item
Treatment
SEM
p value Health
(CON)
Health (CTM)
Lameness (CON)
Lameness (CTM)
Lameness vs.
Health
CTM vs.
CON
Lameness × CTM
DMI (kg/d) 22.8 22.9 22.8 22.7 0.26 0.738 0.511 0.903
Milk yield (kg/d) 27.9 29.5 26.6 29.6 1.50 0.623 0.102 0.515
Fat (%) 4.07
a3.72
b4.05
a3.97
a,b0.095 0.233 0.031 0.137
Protein (%) 3.23 3.20 3.25 3.21 0.041 0.714 0.349 0.732
Lactose (%) 4.82 4.86 4.79 4.84 0.026 0.229 0.952 0.120
SNF (%) 8.36 8.37 8.32 8.38 0.050 0.916 0.451 0.258
Fat (kg/d) 1.17 1.14 1.08 1.21 0.062 0.857 0.442 0.212
Protein (kg/d) 0.93 0.98 0.87 0.98 0.052 0.564 0.103 0.652
3.5% FCM (kg/d) 31.3 31.7 29.1 32.6 1.68 0.714 0.284 0.382
a,b
Means within same row with different superscripts differ (p < 0.05). Health, healthy cows; Lameness, lame cows; CON, cows fed with sulfate salts; CTM, cows fed with CTM; Lameness vs Health, lameness effect; CTM vs CON, CTM effect; Lameness × CTM, interaction of health status and CTM; DMI, dry matter intake; SNF, solid non-fat.
measurements were made for each cow, and the average value was recorded as the hoof hardness [10]. Hair samples were also collected and analyzed for trace minerals.
For trace mineral analysis, serum samples were thawed before testing. For each sample, 2 mL was digested with 20 mL of concentrated nitric acid and 2 mL of perchloric acid in an Erlenmeyer flask. Samples were digested by heating in an adjustable furnace until the sample became colorless. One gram hair samples were accurately weighed, after which each sample was carbonized in a crucible. Carbonized samples were incinerated in the muffle furnace until completely incinerated, and then dissolved in nitric acid. Digested samples were of constant volume. The levels of Zn, Cu and Mn were analyzed using a flame atomic spectrophotometer (Purkinje General, China) after the volumes of the digested samples were constant.
Statistical analysis
All statistical analyses were performed with SAS (ver. 8.0;
SAS Institute, USA) using the cow as the experimental unit. All results were evaluated using a MIXED model including day, lameness, CTM, day × lameness, day × CTM, lameness × CTM, and lameness × CTM × day. Day was included as a repeated measure using an autoregressive covariance structure, and data collected the day before the start of the trial were included as covariates. Significance was declared at p ≤ 0.05, and trends were reported at 0.05 < p ≤ 0.10.
Results
The milk performance data is shown in Table 4. There was no significant difference in DMI, milk yield or compositions between healthy and lame cows. Cows receiving CTM had a
significantly lower milk fat percent (p = 0.031). Moreover, cows fed with CTM had numerically higher milk yield and protein yield than those in the CON group (p = 0.102 and 0.103, respectively). However, there were no differences in DMI, protein, lactose, SNF and fat yield between the CON and CTM group.
As shown in Table 5, there was no significant difference between healthy and lame cows for GSH, GSSG, GSH/GSSG, CAT, GSH-Px, PIIANP, CTX-II and COMP. However, lame cows had significantly lower SOD (p = 0.039) and higher MDA (p = 0.031) levels than healthy cows. When compared with healthy cows, lame cows tended to show lower MT (p = 0.087).
Cows fed CTM had significantly higher GSH (p = 0.008) and lower GSSG (p = 0.010) values, resulting in a higher GSH/GSSG (p = 0.009) than for those fed the CON. In addition, GSH-Px, SOD and MT were significantly higher (p = 0.011, 0.009 and 0.034, respectively) and MDA, PIIANP and CTX-II were significantly lower (p = 0.007, 0.008, and 0.039, respectively) due to CTM supplementation. CTM tended to decrease serum COMP (p = 0.087). There was no difference in CAT observed between the CON and CTM groups (p > 0.1).
Additionally, no interaction between lameness status and CTM was observed in this study for the blood variables tested above.
As shown in Table 6, there was no significant difference in IL-1, IGA, and FMD antibody titers (Type A, O, and Asia I, respectively) between healthy and lame cows (p > 0.1).
Additionally, there was no significant difference in the IL-1 and
FMD antibody titer- Asian-1 type between CON and CTM
groups. However, IGA and FMD antibody titer-O type were
significantly higher because of CTM supplementation (p =
0.008 and 0.012, respectively). FMD antibody titer-A type
tended to increase for cows supplemented with CTM (p =
Table 5. Effects of chelated Zn/Cu/Mn on blood antioxidant status and inflammatory factor
Item
Treatment
SEM
p value Health
(CON)
Health (CTM)
Lameness (CON)
Lameness (CTM)
Lameness vs.
Health
CTM vs.
CON
Lameness × CTM
GSH (mg/L) 6.59
b9.95
a6.07
b10.01
a1.13 0.855 0.008 0.702
GSSG (mol/L) 317.0
a258.0
b317.4
a262.0
a,b26.0 0.312 0.010 0.309
GSH/GSSG 0.034
b0.063
a0.031
b0.062
a0.0013 0.913 0.009 0.778
CAT (U/mL) 3.22 3.51 3.01 3.47 0.36 0.805 0.279 0.821
GSH-PX (U/mL) 46.2
b54.1
a43.7
b53.8
a3.64 0.326 0.011 0.104
SOD (U/mL) 50.5
b55.9
a46.4
c53.7
a1.99 0.039 0.009 0.664
MDA (nmol/mL) 4.43
b3.72
c5.55
a3.98
c0.64 0.031 0.007 0.225
MT (ng/mL) 39.1
b45.4
a35.9
c42.2
a2.52 0.087 0.034 0.679
PIIANP (ng/mL) 31.4
a24.2
b34.3
a,b25.9
b2.35 0.481 0.008 0.545
CTX-II (ng/mL) 139.7
a106.5
b142.7
a113.1
a10.43 0.158 0.039 0.123
COMP (ng/mL) 88.6 69.2 93.1 73.8 11.03 0.651 0.087 0.984
a,b
Means within same row with different superscripts differ (p < 0.05). GSH, glutathione; GSSG, oxidized glutathione; CAT, catalase; GSH-Px, glutathione peroxidase; SOD; superoxide dismutase; MDA; malondialdehyde; MT, metallothionein; PIIANP, procollagen-II N-terminal peptide; CTX-II, C-terminal telopeptide of type II collagen; COMP, cartilage oligomeric matrix protein.
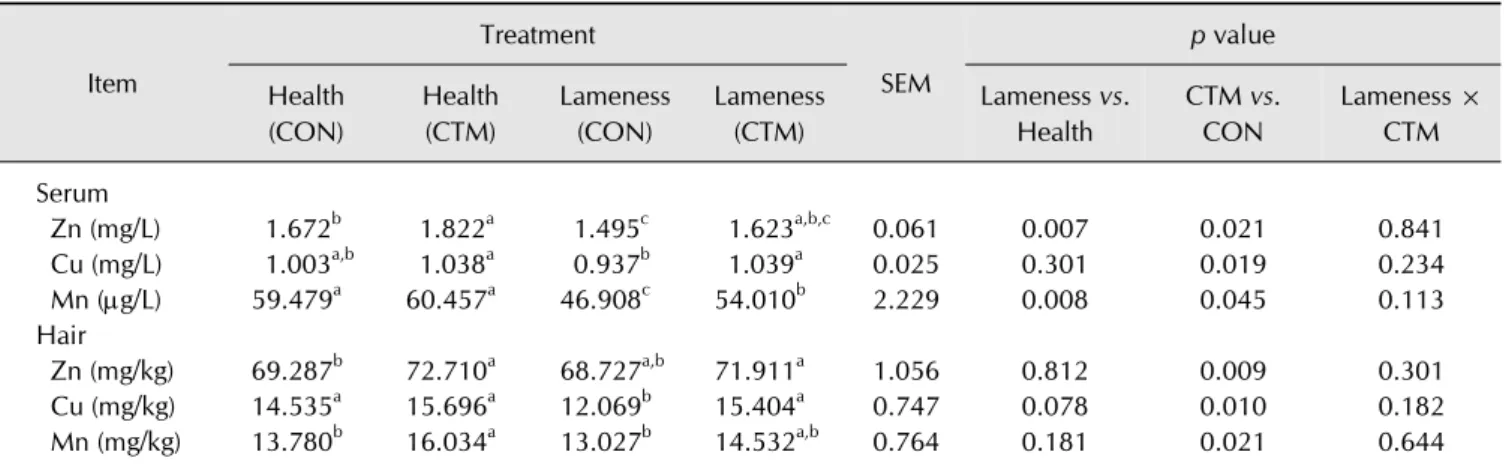
Table 7. Effects of chelated Zn/Cu/Mn on trace mineral levels in serum and hair
Item
Treatment
SEM
p value Health
(CON)
Health (CTM)
Lameness (CON)
Lameness (CTM)
Lameness vs.
Health
CTM vs.
CON
Lameness × CTM Serum
Zn (mg/L) 1.672
b1.822
a1.495
c1.623
a,b,c0.061 0.007 0.021 0.841
Cu (mg/L) 1.003
a,b1.038
a0.937
b1.039
a0.025 0.301 0.019 0.234
Mn (g/L) 59.479
a60.457
a46.908
c54.010
b2.229 0.008 0.045 0.113
Hair
Zn (mg/kg) 69.287
b72.710
a68.727
a,b71.911
a1.056 0.812 0.009 0.301 Cu (mg/kg) 14.535
a15.696
a12.069
b15.404
a0.747 0.078 0.010 0.182 Mn (mg/kg) 13.780
b16.034
a13.027
b14.532
a,b0.764 0.181 0.021 0.644
a,b
Means within same row with different superscripts differ (p < 0.05).
Table 6. Effects of chelated Zn/Cu/Mn on foot-and-mouth disease (FMD) immune responses
Item
Treatment
SEM
p value Health
(CON)
Health (CTM)
Lameness (CON)
Lameness (CTM)
Lameness vs.
Health
CTM vs.
CON
Lameness × CTM
IL-1 (pg/mL) 319.73 389.55 409.72 388.99 36.62 0.223 0.484 0.179
IGA (g/mL) 261.32
b315.19
a251.15
b288.78
a12.00 0.135 0.008 0.585
FMD antibody titer
Type A (log
2) 9.00 9.71 9.52 9.88 0.300 0.245 0.080 0.567
Type O (log
2) 10.25
b11.32
a10.32
b11.15
a,b0.33 0.861 0.012 0.722
Type Asian-1 (log
2) 9.18 9.48 9.45 9.75 0.30 0.358 0.312 0.986
a,b