© 2014 The Korean Ophthalmological Society
This is an Open Access article distributed under the terms of the Creative Commons Attribution Non-Commercial License (http://creativecommons.org/licenses /by-nc/3.0/) which permits unrestricted non-commercial use, distribution, and reproduction in any medium, provided the original work is properly cited.
Original Article
Efficacy of Intravitreal Anti-vascular Endothelial Growth Factor or Steroid Injection in Diabetic Macular Edema According to Fluid
Turbidity in Optical Coherence Tomography
Kyungmin Lee, Heeyoung Chung, Youngsuk Park, Joonhong Sohn
HanGil Eye Hospital, Incheon, Korea
Purpose: To determine if short term effects of intravitreal anti-vascular endothelial growth factor or steroid injec- tion are correlated with fluid turbidity, as detected by spectral domain optical coherence tomography (SD-OCT) in diabetic macular edema (DME) patients.
Methods: A total of 583 medical records were reviewed and 104 cases were enrolled. Sixty eyes received a single intravitreal bevacizumab injection (IVB) on the first attack of DME and 44 eyes received triamcinolone acetonide treatment (IVTA). Intraretinal fluid turbidity in DME patients was estimated with initialintravitreal SD- OCT and analyzed with color histograms from a Photoshop program. Central macular thickness and visual acuity using a logarithm from the minimum angle of resolution chart, were assessed at the initial period and 2 months after injections.
Results: Visual acuity and central macular thickness improved after injections in both groups. In the IVB group, visual acuity and central macular thickness changed less as the intraretinal fluid became more turbid. In the IVTA group, visual acuity underwent less change while central macular thickness had a greater reduction (r = -0.675, p = 0.001) as the intraretinal fluid was more turbid.
Conclusions: IVB and IVTA injections were effective in reducing central macular thickness and improving visual acuity in DME patients. Further, fluid turbidity, which was detected by SD-OCT may be one of the indexes that highlight the influence of the steroid-dependent pathogenetic mechanism.
Key Words: Bevacizumab, Diabetic macular edema, Intravitreal triamcino lone acetonide injection, Optical co- herence tomography, Turbidity
Diabetic macular edema (DME) is the most common cause of visual impairment in patients with diabetus melli- tus and every year approximately 75,000 new patients in
the United States are affected [1,2]. Despite the high preva- lence of DME, there is no definite treatment because of its complicated pathophysiologic mechanism, which is still not fully understood. The pathophysiology of DME is thought to be multifactorial. It occurs mainly as a result of blood retinal barrier disruption leading to an increased ac- cumulation of fluid within the intraretinal layers of the macula [3].Although a disruption in the blood retinal bar- rier plays the main role in the pathogenesis of DME, vit- reomacular interface changes [4], hypoxia, altered blood
Received: December 10, 2013 Accepted: February 6, 2014
Corresponding Author: Joonhong Sohn, MD, PhD. HanGil Eye Hospital,
#35 Bupyeong-daero, Bupyeong-gu, Incheon 403-722, Korea. Tel: 82-32- 503-3322, Fax: 82-32-504-3322, E-mail: [email protected] This manuscript was presented as free paper in the 27th Asian-Pacific Academy of Ophthalmology Congress on April, 2012.
flow, retinal ischemia, and inflammation are also associat- ed with the progression of DME. Therefore many treat- ments have been suggested and attempted, such as laser photocoagulation, intravitreal steroid injection, intravitreal anti-vascular endothelial growth factor (anti-VEGF) injec- tion, and pars plana vitrectomy. Among those, intravitreal anti-VEGF injection and intravitreal steroid injection are the most commonly used in clinics. However, there is no single modality that has been shown to be superior [5-11].
Therefore, many trials have investigated certain factors as potential, major indicators for determining the first line treatment in DME patients.
Recently, several studies regarding the efficacy of treat- ments, according to the patterns of spectral domain optical coherence tomography (SD-OCT) in the setting of DME were performed. According to Shimura et al. [12], intravit- real triamcino lone acetonide injection (IVTA) was more effective in patients with patterns of cystoid macular ede- ma and less effective in those with serous subretinal de- tachment. From the aspect of intravitreal anti-VEGF injec- tion, Kim et al. [13] showed greater efficacy in patients with diffuse retinal thickening type while Wu et al. [14]
showed more efficacy in those with cystoid macular ede- ma. Differences in these results revealed that there might be additional factors other than SD-OCT patterns that may influence the treatment efficacy. Therefore in this study, we focused on turbidity of intraretinal fluid shown on SD- OCT images as a potentially new factor to predict treat- ment success.
In this study, we reviewed clinical records and divided patients into 2 groups according to the treatment strategy:
intravitreal bevacizumab injection (IVB) and IVTA. We then estimated the intraretinal fluid turbidity detected on SD-OCT images upon the first onset of DME and attempt- ed to determine if the short-term effects of IVB or IVTA were influenced by the intraretinal fluid turbidity.
Materials and Methods
This study was approved by the institutional review board of the Hangil Eye Hospital Clinical Research Ethics Com- mittee before performing this retrospective review. In addi- tion, patients gave informed consent for the use of their data.
Inclusion and exclusion criteria
We reviewed the medical records of all patients who had an attack of DME and underwent SD-OCT evaluation at the Hangil Eye Hospital in Incheon, Korea between March 2010 and August 2011. Inclusion criteria for this study were the presence of clinically evident DME in patients who had never previously underwent treatment with laser photo- coagulation, intravitreal injections, or surgery. Clinically evident DME was defined as retinal thickening within one disc area at the center of the fovea on clinical biomic roscopic examination and as central macular thickness (CMT) more than 250 μm on SD-OCT images (Opko/OTI; Ophthalmic Technologies, Toronto, ON, Canada). We included patients with diffuse DME confirmed by fluorescence angiography.
If both eyes in the same patient showed DME, only one eye was randomly selected for analysis. Every eye was injected with either bevacizumab (Avastin 25 mg/mL; Genentech, South San Francisco, CA, USA) or triamcinolone acetonide and subsequently observed without any additional treatments for at least 2 months (n = 583 eyes).
Exclusion criteria included eyes with previous treat- ments of retinal photocoagulation, vitreous surgery, use of intravitreal drugs, and eyes with other diseases with the potential to cause macular edema, such as epiretinal mem- brane, retinal vascular disease, and uveitis. Also, eyes with poor quality SD-OCT images, determined by reference in- dicator lights above the OCT image, were excluded. Good quality SD-OCT images were defined as those with at least 3 indicator lights (red, orange, and green) on both the scan- ning laser ophthalmoscope focus indicator and OCT refer- ence indicator. Additionally, patients with proliferative dia- betic retinopathy identified by fluorescence angiography or with significant optical media problems that could distort OCT images, such as corneal dystrophy, opacity or signifi- cant cataract, were excluded from the study.
Clinical parameters
CMT and best-corrected visual acuity (BCVA) with log- arithm of the minimum angle of resolution chart (log- MAR) were assessed just prior to intravitreal injection and the postoperative CMT and visual acuity at 2 months after injection were also assessed. CMT was calculated by 3 di- mensional average automatically using OCT software.
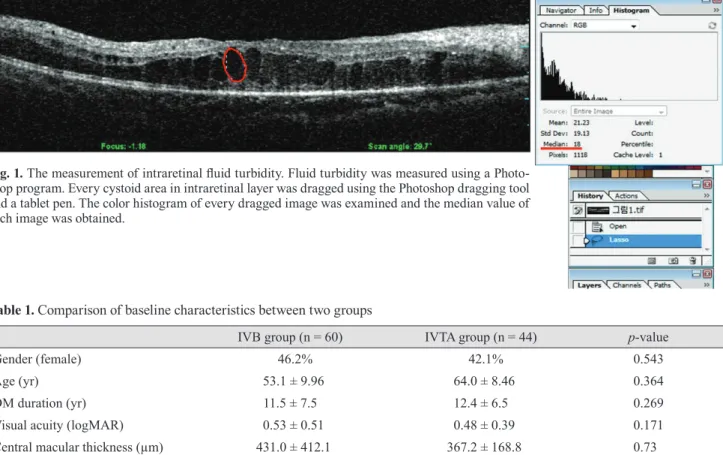
Fluid turbidity was measured using Photoshop (Adobe
Systems, San Jose, CA, USA). Every cystoid area in the in- traretinal layer of one raster image frame from the SD-OCT was dragged using the Photoshop dragging tool (Fig. 1). The color histogram of every dragged image was examined.
Thereafter, we obtained the median value of each image and calculated the median value of each dragged area in that frame. Then, we calculated the average of the total median value of each frame, which was defined as the fluid turbidity.
Changes in CMT were assessed by reduction rates, which are calculated with the following equation: [(CMTat baseline - CMTat postoperative 2 months) / CMTat baseline] × 100. Change of the best mean corrected visual acuity was assessed by subtrac- tion of the baseline BCVA from the BCVA at the 2 month postoperative time point.
Intravitreal injection technique
Topical anesthesia was obtained by applying at least 3 drops of eye drops (Alcaine; Alcon Laboratories, Fort
Worth, TX, USA). After disinfection and draping, 0.05 mL containing 1.25 mg of bevacizumab (Avastin 25 mg/mL, Genentech) or 0.1 mL containing 4 mg of triamcinolone acetonide (Kenalog 40 mg/mL; Dongkwang Pharm., Seoul, Korea) was injected into the vitreous cavity using a 30-gauge needle at a distance of 3 to 3.5 mm from the limbus according to the lens status. After the injection, a topical antimicrobial drug, levofloxacin ophthalmic solution (Cravit;
Santen Pharmaceutical, Osaka, Japan), was administered 4 times a day for a week.
Statistical analysis
Data were presented as mean ± standard deviation. Sta- tistical analyses were performed using SPSS ver. 17.0 (SPSS Inc., Chicago, IL, USA). Statistical differences between the clinical data for pre- and post-intravitreal regimens’ application were assessed using the Mann- Whitney test. A p-value <0.05 was considered to be
Table 1. Comparison of baseline characteristics between two groups
IVB group (n = 60) IVTA group (n = 44) p-value
Gender (female) 46.2% 42.1% 0.543
Age (yr) 53.1 ± 9.96 64.0 ± 8.46 0.364
DM duration (yr) 11.5 ± 7.5 12.4 ± 6.5 0.269
Visual acuity (logMAR) 0.53 ± 0.51 0.48 ± 0.39 0.171
Central macular thickness (µm) 431.0 ± 412.1 367.2 ± 168.8 0.73
Intraretinal fluid turbidity 18.27 ± 15.31 13.86 ± 10.19 0.256
Mann-Whitney test was performed.
IVB = intravitreal bevacizumab injection; IVTA = intravitreal triamcinolone acetonide injection; DM = diabetes mellitus; logMAR = logarithm of the minimum angle of resolution.
Fig. 1. The measurement of intraretinal fluid turbidity. Fluid turbidity was measured using a Photo- shop program. Every cystoid area in intraretinal layer was dragged using the Photoshop dragging tool and a tablet pen. The color histogram of every dragged image was examined and the median value of each image was obtained.
statistically significant. To investigate the correlation between fluid turbidity versus CMT change, and fluid turbidity versus visual acuity in each group, Spearman correlation coefficients (r) and p-values were calculated.
Results
Among the 538 eyes, a total of 104 eyes were enrolled and divided into two groups according to treatment strate- gy. One group was the IVB group and the other was the IVTA group. Sixty eyes were enrolled in the IVB group and 44 eyes in the IVTA group. Baseline characteristics of each group are summarized in Table 1. There were no sig- nificant differences in the mean age, duration of diabetes, initial visual acuity, CMT, or intraretinal fluid turbidity.
Change of mean best-corrected visual acuity
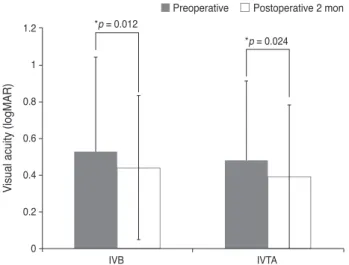
The average preoperative logMAR BCVA was 0.53 ± 0.51 in the IVB group and 0.48 ± 0.39 in the IVTA group and no significant differences between the groups were found (p = 0.171). Further, the average postoperative logMAR BCVA was 0.44 ± 0.43 in the IVB group and 0.39 ± 0.39 in the IVTA group. After the intravitreal injection, the visual acuity improved in both groups with statistical significance (p = 0.012 in IVB group, p = 0.024 in IVTA group) (Fig. 2).
Change of central macular thickness
The average preoperative CMT was 431.0 ± 412.1 μm in the IVB group and 367.2 ± 168.8 μm in the IVTA group.
Both groups showed no statistical differences in the preop- erative CMT (p = 0.73). The average postoperative CMT was 309.8 ± 168.0 μm in the IVB group and 276.5 ± 102.6 μm in the IVTA group. After injection, CMT significantly decreased in both groups (p = 0.000 in IVB group, p = 0.001 in IVTA group) (Fig. 3).
Change of mean best-corrected visual acuity and central macular thickness according to intraretinal fluid turbidity
In the IVB group, as intraretinal fluid turbidity incre- ased, the mean BCVA and CMT underwent less changes and nearly remained unchanged (Fig. 4). Also, there were
no statistically significant correlations between the intraretinal fluid turbidity and change of both the mean BCVA and CMT (Table 2).
Fig. 2. Change of the mean best-corrected visual acuity after in- travitreal injection. The best-corrected visual acuity was expressed as a logarithm of the minimum angle of the resolution chart (log- MAR). After a period of 2 months after intravitreal injection, both in travitreal bevacizumab injection (IVB) and intravitreal triam- cinolone acetonide injection (IVTA) groups showed statistically significant improvement in visual acuity (p = 0.0012 in IVB and p
= 0.0024 in IVTA, respectively). *Statistically significant (p < 0.05) by Mann-Whitney test.
*p = 0.012
*p = 0.024
IVB IVTA
Visual acuity (logMAR)
0 0.2 0.4 0.6 0.8 1 1.2
Preoperative Postoperative 2 mon
Fig. 3. Change of central macular thickness after intravitreal in- jection. At the 2 month postoperative time point central macular thickness was significantly reduced after intravitreal injection in in travitreal bevacizumab injection (IVB) and intravitreal triamcin- olone acetonide injection (IVTA) groups (p = 0.000 in IVB and p
= 0.0001 in IVTA, respectively). *Statistically significant (p < 0.05) by Mann-Whitney test.
*p = 0.001
IVB
*p = 0.000
IVTA
Central macular thickness (µm)
0 100 200 300 400 500 600 700 800 900
Preoperative Postoperative 2 mon
Fig. 5. Change of the mean best-corrected visual acuity (A) and central macular thickness (CMT) (B) according to the intraretinal fluid turbidity in the intravitreal triamcinolone acetonide injection (IVTA) group. Change of mean best-corrected visual acuity is defined as the subtraction between initial best-corrected visual acuity and the 2 month postoperative best-corrected visual acuity. The change of CMT is defined as [(CMTat baseline - CMTat postoperative 2 months) / CMTat baseline] × 100. In the IVTA group, as the intraretinal fluid turbidity increased, the best-corrected visual acuity was unchanged in comparison with those of initial measurements (A), and the CMT reduced greatly (B).
-.60 .00 10.00 20.00 30.00 40.00
R2(linear) = 9.927E-7
Intraretinal fluid turbidity
Visual acuity change
-.40 -.20 .00 .20
.00 10.00 20.00 30.00 40.00
R2(linear) = 0.474
Intraretinal fluid turbidity
Central macular thickness change (%)
-80.00 -60.00 -40.00 -20.00 .00 20.00 40.00
-.60 .00 10.00 20.00 30.00 40.00
R2(linear) = 9.927E-7
Intraretinal fluid turbidity
Visual acuity change
-.40 -.20 .00 .20
.00 10.00 20.00 30.00 40.00
R2(linear) = 0.474
Intraretinal fluid turbidity
Central macular thickness change (%)
-80.00 -60.00 -40.00 -20.00 .00 20.00 40.00
A B
Fig. 4. Correlation between intraretinal fluid turbidity and the change of both the mean best-corrected visual acuity (A) and central macular thickness (CMT) (B) in the intravitreal bevacizumab injection (IVB) group. Change of the best mean corrected visual acuity is defined as the subtraction between initial best-correct ed visual acuity and the 2 month postoperative best-corrected visual acuity. Further the change of CMT is defined as [(CMTat baseline - CMTat postoperative 2 months) / CMTat baseline] × 100. As the intraretinal fluid turbidity increased in the IVB group, the best-corrected visual acuity (A) and CMT (B) remained unchanged compared to initial measurements.
-1.50
.00 20.00
R2(linear) = 0.002
Intraretinal fluid turbidity
Visual acuity change
40.00 60.00
-1.00 -.50 .00 .50
-100.00
.00 20.00
R2(linear) = 0.003
Intraretinal fluid turbidity
Central macular thickness change (%)
40.00 60.00
-50.00 .00 50.00 100.00 150.00
-1.50
.00 20.00
R2(linear) = 0.002
Intraretinal fluid turbidity
Visual acuity change
40.00 60.00
-1.00 -.50 .00 .50
-100.00
.00 20.00
R2(linear) = 0.003
Intraretinal fluid turbidity
Central macular thickness change (%)
40.00 60.00
-50.00 .00 50.00 100.00 150.00
A B
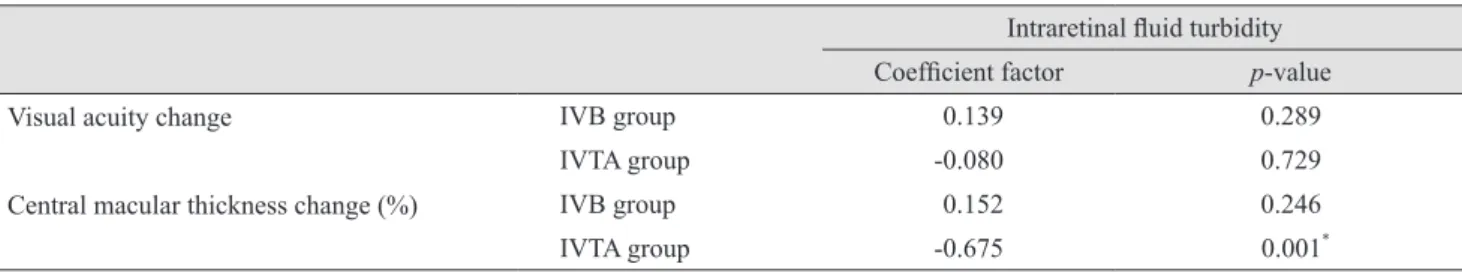
Table 2. Correlation between intraretinal fluid turbidity and change of visual acuity and central macular thickness Intraretinal fluid turbidity
Coefficient factor p-value
Visual acuity change IVB group 0.139 0.289
IVTA group -0.080 0.729
Central macular thickness change (%) IVB group 0.152 0.246
IVTA group -0.675 0.001*
IVB = intravitreal bevacizumab injection; IVTA = intravitreal triamcinolone acetonide injection.
*Statistically significant (p < 0.05) by Spearman’s rho correlation coefficient.
In the IVTA group, visual acuity changed less (Fig. 5A), but CMT was greatly lowered (Fig. 5B) as intraretinal fluid turbidity increased. Although there was no significant cor- relation between the intraretinal fluid turbidity and change of the mean BCVA. From the aspect of CMT changes, there was a statistically significant correlation with intra- retinal fluid turbidity (r = -0.675, p = 0.001) (Table 2).
Discussion
In this study, IVB and IVTA both showed good short term clinical effects for improving visual acuity and CMT.
However, after analyzing the influence of intraretinal fluid turbidity, the visual acuity and CMT was not significantly affected by the intraretinal fluid turbidity in the IVB group, although this showed a slight tendency of negative correlation. On the contrary, in the IVTA group, a diff- erent tendency was seen. From the aspect of visual acuity, it showed the same findings as those of the IVB group, but in terms of CMT changes the intraretinal fluid turbidity was positively influenced by the short term efficacy of the treatment.
There have been many randomized clinical studies regarding intravitreal anti-VEGF injections, such as rani- bizuamb and bevacizumab, which showed excellent treat- ment effects for DME. In the READ-II (ranibizumab for edema of the mAcula in diabetes) study [15,16], nearly 75%
of patients showed a visual acuity of more than 20 / 50 and 35% showed a central foveal thickness of less than 250 μm at the 24 month follow up appointment. Furth ermore, in the RESTORE study [17], 53% of patients showed a visual acuity of more than 20 / 50 at the 12 month follow up appointment. According to the RISE and RIDE study [18], nearly 98% of patients lost visual acuity of less than 15 letters, 34% to 45% of patients gained more than 15 letters, and nearly 75% of the patients showed central foveal thickness of less than 250 μm at the 24 month follow up appointment. Although the BOLT [19] and DRCR net studies [20] did not describe the portion of patients with visual acuity and CMT changes, they did show significant improvements in DME with IVB. As shown in these studies, nearly 60% to 70% of patients had clinical improvements in DME with intravitreal anti-VEGF injection and about 30% to 40% of patients were refractory to anti-VEGF. In addition to prompt laser treatment, similar
results were seen after treatment with ranibizumab mon- otherapy [17,18]. This sugg ests that only reducing VEGF levels in the vitreous cavity was not sufficient to reduce DME for refractory cases.
According to Funatsu et al. [21], aqueous levels of VEGF and interleukin (IL)-6 were significantly higher than the respective plasma levels (both p < 0.001) in DME patients.
In addition, the aqueous level of VEGF significantly correlated with IL-6 levels (p < 0.01). Furthermore, the status of the posterior vitreous was significantly correlated with the severity of macular edema (p < 0.0001). Ther- efore, they concluded that not only VEGF, but also IL-6, might play an important role in the pathogenesis of DME.
Further, Sohn et al. [22]. showed that after IVB, VEGF levels in aqueous humor decreased significantly while IL-6 levels remained unch anged. After IVTA, however, IL-6, interferon gamma-induced protein 10, monocyte chemotactic protein 1, platelet derived growth factor-AA, and VEGF signi ficantly decreased, although the amount of VEGF redu ction was less than those in the IVB group. In cases with more inflammatory factors, such as IL-6 in the vitreous cavity, intravitreal steroid injection could be more effective than anti-VEGF injection. It was for this reason that determining if the clinical index represents the effects of inflammatory processes in DME patients.
In our study, as the intraretinal fluid turbidity increased, IVTA showed a greater effect in the reduction of CMT.
The intraretinal fluid turbidity, which was detected in SD- OCT, might be one of the indexes to show the influence of steroid-dependent pathogenetic mechanisms. Although visual acuity showed the same findings with the IVB group, it might be influenced by the short term follow up period. Further, we came to the same conclusions as previous studies [23] in that visual acuity was not always correlated with CMT. Also, there were many studies [5,7,11]
that showed the complications of IVTA such as deteri- oration of visual acuity due to cataract progression and incr- ease of intraocular pressure. However in our study, as we evaluated the short term effects of each treatment, and there were no cases with these complications.
In this study, we aimed at evaluating one of the indexes to help determine the first line treatment regimen for DME. This may allow for future customized treatments for DME resulting in improvement of visual acuity and retinal function in diabetic patients. However, this study had some limitations. First, this study is a review of medical
records with limited information and prospective studies regarding treatment efficacy, according to the intraretinal fluid turbidity with systemic factors such as HbA1C level and lipid status, are needed. Second, this study had a small number of patients with a relatively short follow up and further studies with longer follow up and study population are needed. Lastly, the correlation bet ween cytokine levels in anterior aqueous humor and the intraretinal fluid turbidity also require analysis and evaluation in future studies.
Conflict of Interest
No potential conflict of interest relevant to this article was reported.
References
1. Klein R, Klein BE, Moss SE. Visual impairment in diabe- tes. Ophthalmology 1984;91:1-9.
2. Moss SE, Klein R, Klein BE. Ten-year incidence of visual loss in a diabetic population. Ophthalmology 1994;101:1061-70.
3. Antcliff RJ, Marshall J. The pathogenesis of edema in dia- betic maculopathy. Semin Ophthalmol 1999;14:223-32.
4. Montero JA, Ruiz-Moreno JM, De La Vega C. Incomplete posterior hyaloid detachment after intravitreal pegaptanib injection in diabetic macular edema. Eur J Ophthalmol 2008;
18:469-72.
5. Ahmadieh H, Ramezani A, Shoeibi N, et al. Intravitreal bevacizumab with or without triamcinolone for refractory diabetic macular edema; a placebo-controlled, randomized clinical trial. Graefes Arch Clin Exp Ophthalmol 2008;246:
483-9.
6. Goyal S, Lavalley M, Subramanian ML. Meta-analysis and review on the effect of bevacizumab in diabetic macular edema. Graefes Arch Clin Exp Ophthalmol 2011;249:15-27.
7. Soheilian M, Ramezani A, Bijanzadeh B, et al. Intravitreal bevacizumab (avastin) injection alone or combined with triamcinolone versus macular photocoagulation as primary treatment of diabetic macular edema. Retina 2007;27:1187-95.
8. Soheilian M, Ramezani A, Obudi A, et al. Randomized tri- al of intravitreal bevacizumab alone or combined with tri- amcinolone versus macular photocoagulation in diabetic macular edema. Ophthalmology 2009;116:1142-50.
9. Lim JW, Lee HK, Shin MC. Comparison of intravitreal bevacizumab alone or combined with triamcinolone versus triamcinolone in diabetic macular edema: a randomized clin- ical trial. Ophthalmologica 2012;227:100-6.
10. Song JH, Lee JJ, Lee SJ. Comparison of the short-term effects of intravitreal triamcinolone acetonide and bevaci zumab injection for diabetic macular edema. Korean J Ophth almol 2011;25:156-60.
11. Paccola L, Costa RA, Folgosa MS, et al. Intravitreal triam- cinolone versus bevacizumab for treatment of refra ctory diabetic macular oedema (IBEME study). Br J Ophth almol 2008;92:76-80.
12. Shimura M, Yasuda K, Nakazawa T, et al. Visual outcome after intravitreal triamcinolone acetonide depends on optical coherence tomographic patterns in patients with diffuse diabetic macular edema. Retina 2011;31:748-54.
13. Kim M, Lee P, Kim Y, et al. Effect of intravitreal bevaci- zumab based on optical coherence tomography patterns of diabetic macular edema. Ophthalmologica 2011;226:138-44.
14. Wu PC, Lai CH, Chen CL, Kuo CN. Optical coherence tomographic patterns in diabetic macula edema can predict the effects of intravitreal bevacizumab injection as primary treatment. J Ocul Pharmacol Ther 2012;28:59-64.
15. Nguyen QD, Shah SM, Heier JS, et al. Primary end point (six months) results of the ranibizumab for edema of the mAcula in diabetes (READ-2) study. Ophthalmology 2009;
116:2175-81.
16. Nguyen QD, Shah SM, Khwaja AA, et al. Two-year out- comes of the ranibizumab for edema of the mAcula in dia- betes (READ-2) study. Ophthalmology 2010;117:2146-51.
17. Mitchell P, Bandello F, Schmidt-Erfurth U, et al. The RE- STORE study: ranibizumab monotherapy or combined with laser versus laser monotherapy for diabetic macular edema.
Ophthalmology 2011;118:615-25.
18. Nguyen QD, Brown DM, Marcus DM, et al. Ranibizumab for diabetic macular edema: results from 2 phase III ran- domized trials: RISE and RIDE. Ophthalmology 2012;119:
789-801.
19. Michaelides M, Kaines A, Hamilton RD, et al. A prospective randomized trial of intravitreal bevacizumab or laser thera- py in the management of diabetic macular edema (BOLT study) 12-month data: report 2. Ophthalmology 2010;117:
1078-86.
20. Diabetic Retinopathy Clinical Research Network, Scott IU, Edwards AR, et al. A phase II randomized clinical trial of intravitreal bevacizumab for diabetic macular edema. Oph
thalmology 2007;114:1860-7.
21. Funatsu H, Yamashita H, Noma H, et al. Increased levels of vascular endothelial growth factor and interleukin-6 in the aqueous humor of diabetics with macular edema. Am J Ophth almol 2002;133:70-7.
22. Sohn HJ, Han DH, Kim IT, et al. Changes in aqueous con- centrations of various cytokines after intravitreal triamcin-
olone versus bevacizumab for diabetic macular edema. Am J Ophthalmol 2011;152:686-94.
23. Browning DJ, Apte RS, Bressler SB, et al. Association of the extent of diabetic macular edema as assessed by optical coherence tomography with visual acuity and retinal out- come variables. Retina 2009;29:300-5.