pISSN 2093-2278 · eISSN 2093-2286
Root coverage using a coronally
advanced flap with or without acellular dermal matrix: a meta-analysis
Wei Guan,† Haiqing Liao,† Li Guo, Changning Wang, Zhengguo Cao*
Department of Periodontology, The State Key Laboratory Breeding Base of Basic Science of Stomatology (Hubei-MOST KLOS) & Key Laboratory for Oral Biomedical Engineering of Ministry of Education (KLOBME), School & Hospital of Stomatology, Wuhan University, Wuhan, China
ABSTRACT
Purpose: Gingival recession is a major esthetic concern and may lead to root sensitivity during periodontal treatment. Coronally advanced flaps (CAFs) with and without acellular dermal matrix (ADM) are widely used in root coverage procedures. The aim of this study was to analyze the efficacy of CAF in combination with ADM in the treatment of gingival recession.
Methods: PubMed, The Cochrane Library, and Embase were used to identify relevant articles.
The articles were screened, data were extracted, and the quality of the studies was assessed by three reviewers with expertise in clinical practice, trials, statistics, and biomedical editing.
The clinical endpoints of interest included changes in recession, probing depth (PD), clinical attachment level (CAL), and keratinized tissue (KT).
Results: Ten randomized controlled trials were identified, including six studies that compared CAFs with ADM and CAFs using connective tissue grafting (CTG) and four studies that compared CAFs with or without ADM. No statistically significant differences were found between the use of ADM and CTG, whereas statistically significant differences were found between groups in which ADM and CAF were combined and groups that underwent CAF alone with regard to recession coverage, CAL, and KT. The combination of CAF with an ADM allograft achieved more favorable recession coverage and recovery of CAL and KT than CAF alone.
Conclusions: The results from the ADM and CTG groups suggest that both procedures may be equally effective in clinical practice. Given the limitations of this study, further investigation is needed to clarify the effectiveness of ADM and CAF in clinical practice.
Keywords: Acellular Dermis; Gingival recession; Meta-analysis
INTRODUCTION
Gingival recession is defined as the apical shift of the gingival margin from its original position to the cementoenamel junction or beyond, exposing the root surface to the oral environment [1]. Many problems occur as a result of gingival recession, and esthetic concerns seem to be an area of particular concern for patients [2,3]. To date, the surgical procedures recommended for root coverage to treat gingival recession include pedicle tissue grafts,
Research Article
http://doi.org/10.5051/jpis.2016.46.1.22
Received: Nov 22, 2015 Accepted: Jan 26, 2016
*Correspondence to Zhengguo Cao
Department of Periodontology, School &
Hospital of Stomatology, Wuhan University, 237 Luoyu Road, Wuhan 430070, China.
E-mail: caozhengguo@whu.edu.cn Tel: +86-27-87686212
Fax: +86-27-87686212
†Wei Guan and Haiqing Liao equally contributed to this study.
Copyright © 2016 Korean Academy of Periodontology
This is an Open Access article distributed under the terms of the Creative Commons Attribution Non-Commercial License (http://
creativecommons.org/licenses/by-nc/3.0/).
ORCID Wei Guan
http://orcid.org/0000-0002-1238-1694 Haiqing Liao
http://orcid.org/0000-0002-3917-3115 Li Guo
http://orcid.org/0000-0002-3593-3404 Changning Wang
http://orcid.org/0000-0002-5292-7428 Zhengguo Cao
http://orcid.org/0000-0002-4261-9034
23 http://doi.org/10.5051/jpis.2016.46.1.22
http://jpis.org Funding
The study was partly supported by grants from the National Natural Science Foundation of China to ZC (81570946), from the Youth Chenguang Project of Science and Technology of Wuhan City to ZC (2014072704011255),from the Natural Science Foundation of Hubei Province to ZC (2015CFB259), and from the Young Medical Talent Project of the Health Department of Wuhan (2014-2016).
Conflict of Interest
No potential conflict of interest relevant to this article was reported.
free tissue grafts, and combined procedures involving tissue regeneration [4-8]. Coronally advanced flaps (CAFs) are an effective surgical procedure for root coverage, and they can be used alone or together with connective tissue grafting (CTG), enamel matrix derivative, acellular dermal matrix (ADM), or a barrier membrane [9-12]. ADM is a substitute for an autogenous graft when it is difficult or impossible to harvest a connective tissue graft [13,14], and the fact that it avoids a flap graft procedure helps to alleviate patients' discomfort with such procedures. The present study aimed to evaluate the clinical effectiveness of ADM for root coverage compared with CAF alone or CAF combined with CTG.
MATERIALS AND METHODS
Search strategy
Three electronic databases were searched: PubMed, The Cochrane Library, and Embase. The search encompassed English-language articles published by October 2015 using the following terms: (acellular dermal matrix OR acellular dermal matrices OR acellular dermal graft tissue OR decellularized dermal scaffold OR Alloderm) AND (root coverage OR gingival recession OR gingival atrophy). Potentially relevant articles were selected based on a manual evaluation of the search results. The literature search was conducted independently and in duplicate by two reviewers with expertise in clinical practice, trials, statistics, and biomedical editing. All discrepancies between the two reviewers were resolved through discussion with the third reviewer.
Inclusion and exclusion criteria
We included randomized clinical controlled studies with a minimum of six months of follow- up. The other inclusion criteria are listed below, following the Participants, Interventions, Comparisons, and Outcomes framework. Patients with a diagnosis of Miller Class I or II gingival recession were included (Participants). The following surgical procedures for root coverage were considered: CAF, CAF with CTG, and CAF with ADM (Interventions).
The following comparisons were made between interventions: CAF with ADM versus CAF alone and CAF with ADM versus CAF with CTG (Comparisons). The outcomes of interest (Outcomes) included recession reduction (RecRed), increase of the clinical attachment level (CAL), reduction in the probing depth (PD), and gain in keratinized tissue (KT). The exclusion criteria included: (1) other types of study designs, such as animal studies, case reports, case series, and reviews; (2) duplicated studies; and (3) studies with insufficient information about the study design and/or inadequate data about changes in clinical parameters.
Study selection
A total of 413 records were retrieved from the literature search. These articles were imported to Endnote in order to remove duplicates. Two reviewers performed the eligibility assessment by analyzing the titles, abstracts, and full texts of the studies. Articles were included in the next stage of the analysis if both reviewers agreed that it was appropriate to do so. Differences between the reviewers were resolved by consensus, and a third reviewer provided a decision if no agreement was reached between the first two reviewers.
Data extraction and quality assessment
Two independent reviewers (W.G. and L.G.) performed the data extraction and quality assessment.
Discrepancies between the two reviewers were resolved by consensus based on discussion with the third reviewer (H.Q.L.). The following information was extracted from the studies: name of
the first author, year of publication, study design, patient demographics, details of the gingival recession defects, type of intervention, length of the follow-up, and reported outcomes.
The two reviewers performed quality assessment according to the guidelines presented in the Cochrane Handbook [15]. Six main criteria were examined: random sequence generation, allocation concealment, blinding of participants and personnel, blinding of outcome assessment, incomplete outcome data, and selective reporting. After quality assessment, the studies were grouped into three categories: (A) high risk of bias, if two or more criteria were not met; (B) moderate risk of bias, if one criterion was not met; and (C) low risk of bias, if all of the criteria were met.
Statistical analysis
We conducted the meta-analysis with software (Revman 5.1) from The Cochrane Library [15].
The results of our analysis of the outcomes were expressed as weighted mean differences and 95% confidence intervals (95% CIs). We used the chi-square test and I2 to assess the statistical heterogeneity between trials. Studies with results of P>0.1 and I2≤50% were considered to have low heterogeneity, and those with results of P<0.1 and I2>50% were considered to have high heterogeneity [16,17]. We used a fixed-effects model if evidence of low heterogeneity was found, while a random-effects model was used in cases of high heterogeneity. Moreover, publication bias was investigated using the funnel plot and the Egger funnel plot, which was assessed using the regression line method.
RESULTS
Study selection
The flowchart of how the search results were analyzed is shown in Figure 1. The initial electronic search of articles in three databases resulted in the identification of 413 articles. We excluded 17 duplicate articles. Of the remaining 396 articles, 353 articles were excluded based on their titles and abstracts because they did not meet the inclusion and exclusion criteria.
Ultimately, 10 studies [18-27] were included in the meta-analysis after screening the full text of the remaining 43 articles for detailed information. Thirty-three articles were excluded due to inappropriate study design, incorrect or incomplete data, or lack of information about the methodology.
Characteristics and quality assessment of the included studies
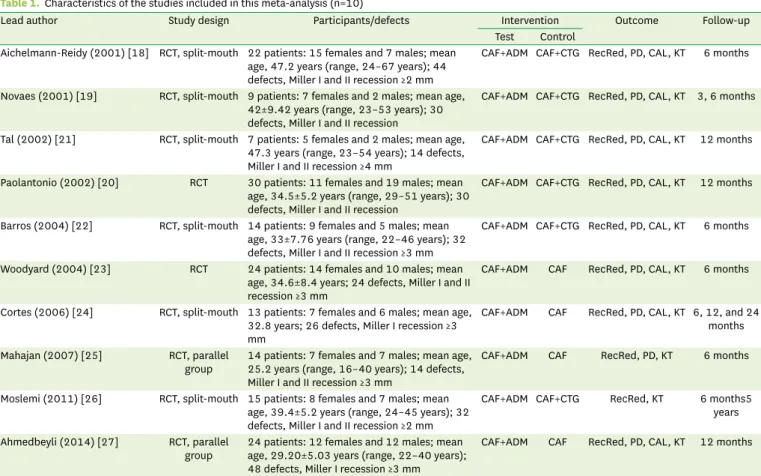
The characteristics of the included studies are presented in Table 1. Two distinct sets of comparisons were found: CAF with ADM versus CAF with CTG in six studies [18-22,26], and CAF with ADM versus CAF alone in four studies [23-25,27]. Two studies used a parallel-group design, and six studies employed split-mouth models. The numbers of participants ranged from seven to 30 patients. Most studies reported the outcomes of RecRed, reduction in PD, gain in CAL, and gain in KT; however, two studies [25,26] did not report all four parameters.
The follow-up period of the studies ranged from three to 60 months. Detailed findings regarding the risk of bias in the 10 studies included in this analysis are presented in Table 2.
Three [22,24,27] were found to exhibit a high risk of bias, seven [18-21,23,25,26] were found to show a moderate risk of bias, and none exhibited a low risk of bias.
25 http://doi.org/10.5051/jpis.2016.46.1.22
http://jpis.org
Records identified through database searching
(n=413)
Full-text articles assessed for eligibility
(n=10)
Studies included in
quantitative synthesis (meta-analysis) (n=10)
Records screened (n=43)
Full-text articles excluded, with reasons
(n=33) Records excluded
(n=353) Records after duplicates removed
(n=396)
Figure 1. Flowchart of the literature search.
Table 1. Characteristics of the studies included in this meta-analysis (n=10)
Lead author Study design Participants/defects Intervention Outcome Follow-up
Test Control Aichelmann-Reidy (2001) [18] RCT, split-mouth 22 patients: 15 females and 7 males; mean
age, 47.2 years (range, 24–67 years); 44 defects, Miller I and II recession ≥2 mm
CAF+ADM CAF+CTG RecRed, PD, CAL, KT 6 months
Novaes (2001) [19] RCT, split-mouth 9 patients: 7 females and 2 males; mean age, 42±9.42 years (range, 23–53 years); 30 defects, Miller I and II recession
CAF+ADM CAF+CTG RecRed, PD, CAL, KT 3, 6 months
Tal (2002) [21] RCT, split-mouth 7 patients: 5 females and 2 males; mean age, 47.3 years (range, 23–54 years); 14 defects, Miller I and II recession ≥4 mm
CAF+ADM CAF+CTG RecRed, PD, CAL, KT 12 months
Paolantonio (2002) [20] RCT 30 patients: 11 females and 19 males; mean age, 34.5±5.2 years (range, 29–51 years); 30 defects, Miller I and II recession
CAF+ADM CAF+CTG RecRed, PD, CAL, KT 12 months
Barros (2004) [22] RCT, split-mouth 14 patients: 9 females and 5 males; mean age, 33±7.76 years (range, 22–46 years); 32 defects, Miller I and II recession ≥3 mm
CAF+ADM CAF+CTG RecRed, PD, CAL, KT 6 months
Woodyard (2004) [23] RCT 24 patients: 14 females and 10 males; mean age, 34.6±8.4 years; 24 defects, Miller I and II recession ≥3 mm
CAF+ADM CAF RecRed, PD, CAL, KT 6 months
Cortes (2006) [24] RCT, split-mouth 13 patients: 7 females and 6 males; mean age, 32.8 years; 26 defects, Miller I recession ≥3 mm
CAF+ADM CAF RecRed, PD, CAL, KT 6, 12, and 24 months Mahajan (2007) [25] RCT, parallel
group 14 patients: 7 females and 7 males; mean age, 25.2 years (range, 16–40 years); 14 defects, Miller I and II recession ≥3 mm
CAF+ADM CAF RecRed, PD, KT 6 months
Moslemi (2011) [26] RCT, split-mouth 15 patients: 8 females and 7 males; mean age, 39.4±5.2 years (range, 24–45 years); 32 defects, Miller I and II recession ≥2 mm
CAF+ADM CAF+CTG RecRed, KT 6 months5 years Ahmedbeyli (2014) [27] RCT, parallel
group 24 patients: 12 females and 12 males; mean age, 29.20±5.03 years (range, 22–40 years);
48 defects, Miller I recession ≥3 mm
CAF+ADM CAF RecRed, PD, CAL, KT 12 months
RCT, randomized controlled trial; CAF, coronally advanced flap; ADM, acellular dermal matrix; CTG, connective tissue grafting; RecRed, recession reduction; PD, probing depth; CAL, clinical attachment level; KT, keratinized tissue.
Meta-analysis
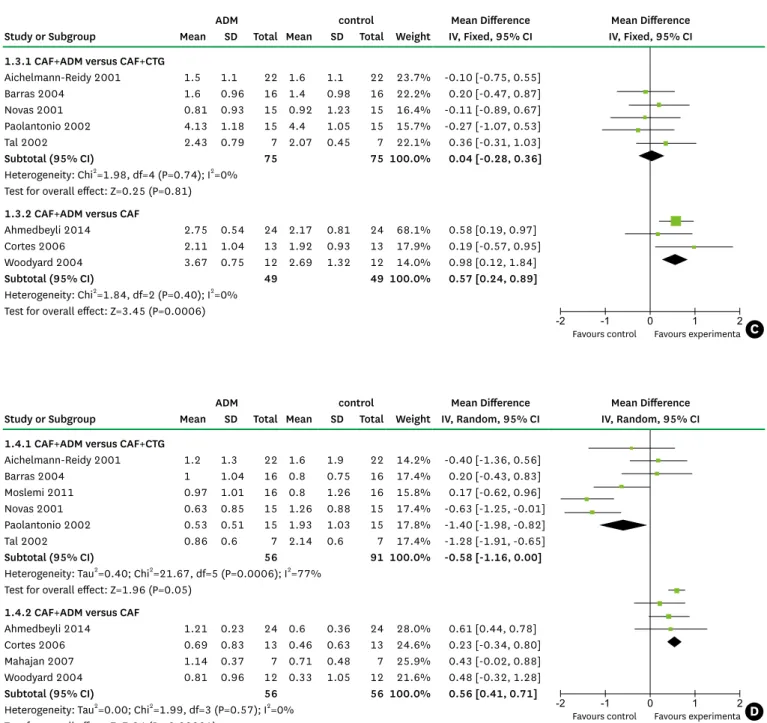
The results of our meta-analysis are presented in four forest plots (Figure 2A–D). The studies that were analyzed presented treatment outcomes at a range of follow-up points, including three, six, 12, and 60 months. Most of the studies reported results at six months. Since different follow-up durations may have influenced the findings regarding clinical outcomes, we pooled the results at six and 12 months of follow-up, respectively. The pooled results showed no significant difference between the different durations of follow-up. Therefore, we combined the outcomes at six months [18,19,22-26] and 12 months [20,21,27] together in the final analysis.
CAF with ADM vs. CAF with CTG
CAF with ADM was shown to have a RedRec 0.3 mm (95% CI=−0.33–0.93 mm) greater than that observed for CAF with CTG (Figure 2A). Similar results were found regarding the reduction in PD (Figure 2B) and the gain in CAL (Figure 2C), with the combination of CAF and ADM achieving better outcomes than the control group. However, no statistically significant differences were found when CAF with ADM was compared to CAF with CTG across these four clinical parameters. These overall results may indicate that both procedures are comparably effective in clinical practice.
CAF vs. CAF with ADM
When CAF alone was compared to CAF with ADM, the inclusion of ADM was associated with favorable results for the four parameters of interest. In comparison with CAF alone, CAF with ADM was associated with a mean recession reduction (Figure 2A) that was greater by 0.68 mm (95% CI=0.20–1.17 mm), a mean reduction in PD (Figure 2B) that was greater by 0.09 mm (95% CI=−0.05–0.24 mm), a mean gain in CAL (Figure 2C) that was greater by 0.57 mm (95% CI=0.24–0.89 mm) and a mean gain in KT (Figure 2D) that was greater by 0.56 mm (95%
CI=0.41–0.71 mm). These differences were statistically significant, except for that observed in the reduction of PD, indicating that the combination of CAF and ADM significantly decreased gingival recession and increased the CAL and KT in comparison to CAF alone.
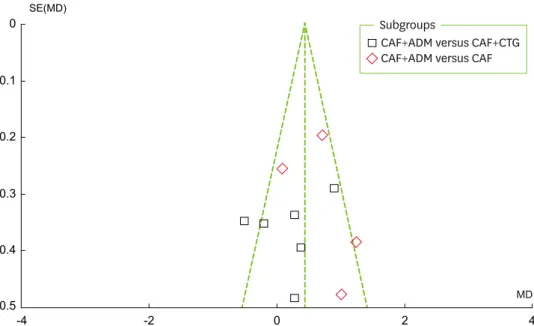
Publication bias
As can be seen in Figure 3, a visual inspection of the funnel plot for recession change does not suggest the presence of publication bias. As shown in Figure 4, the Egger test indicated Table 2. Quality assessment of the studies included in the meta-analysis
Studies Assessment categories Risk of bias
A B C D E F
Aichelmann-Reidy [18] Yes Unclear No Yes No No Moderate
Novaes [19] Unclear Unclear No Unclear No No Moderate
Tal [21] Unclear Yes No Yes No No Moderate
Paolantonio [20] Unclear Unclear No Yes No No Moderate
Barros [22] Unclear Unclear No No No No High
Woodyard [23] Yes Unclear No Yes No No Moderate
Cortes [24] Yes Unclear No No No No High
Mahajan [25] Yes Unclear No Unclear No No Moderate
Moslemi [26] Yes Yes No Yes Y/w No Moderate
Ahmedbeyli [27] Yes Unclear No No No No High
A, random sequence generation; B, allocation concealment; C, blinding of participants and personnel; D, blinding of outcome assessment; E, incomplete outcome data; F, selective reporting; Y/w, yes without impact on observed effect size.
Three levels of risk of bias were defined: low, all of the criteria were met; moderate, one criterion was not met; high, two or more criteria were not met.
27 http://doi.org/10.5051/jpis.2016.46.1.22
http://jpis.org
no significant publication bias (P=0.837). Publication bias is suggested to be present in the Egger test if P < 0.05 or if the 95% CI does not include 0.
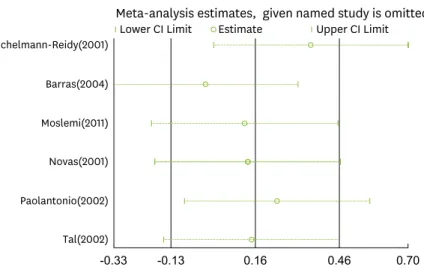
Sensitivity analysis
As is shown in Figures 2A and 2D, high heterogeneity (I2=56%, 61%, and 77%, respectively) was present in RecRed in both sets of comparisons and in the KT gain in the comparison of CAF and ADM with CAF and CTG, and we therefore performed a sensitivity analysis with STATA to explore this heterogeneity. The pooled results (Figure 5A–C) showed that no single study changed the pooled differences in the mean values, suggesting that the results were statistically stable and reliable.
-2 -1 0 1 2
Favours control Favours experimenta -2 -1 0 1 2
Favours control Favours experimenta
-2 -1 0 1 2
Favours control Favours experimenta -2 -1 0 1 2
Favours control Favours experimenta
A B
C D
ADM control Mean Difference Mean Difference
Study or Subgroup Mean SD Total Mean SD Total Weight IV, Random, 95% CI IV, Random, 95% CI 1.1.1 CAF+ADM versus CAF+CTG
Aichelmann-Reidy 2001 1.7 1.2 22 2.2 1.1 22 17.3% -0.50 [-1.18, 0.18]
Barras 2004 3 0.64 16 2.1 0.97 16 19.9% 0.90 [0.33, 1.47]
Moslemi 2011 2.57 1.15 16 2.2 1.08 16 15.4% 0.37 [-0.40, 1.14]
Novas 2001 2.1 1 15 1.83 0.83 15 17.8% 0.27 [-0.39, 0.93]
Paolantonio 2002 4 1.06 15 4.2 0.86 15 17.1% -0.20 [-0.89, 0.49]
Tal 2002 4.57 0.9 7 4.29 0.9 7 12.4% 0.28 [-0.66, 1.22]
Subtotal (95% CI) 91 91 100.0% 0.20 [-0.24, 0.63]
Heterogeneity: Tau2=0.16; Chi2=11.38, df=5 (P=0.04); I2=56%
Test for overall effect: Z=0.89 (P=0.37) 1.1.2 CAF+ADM versus CAF
Ahmedbeyli 2014 3.08 0.51 24 2.37 0.83 24 32.7% 0.71 [0.32, 1.10]
Cortes 2006 2.58 0.67 13 2.5 0.64 13 28.9% 0.08 [-0.42, 0.58]
Mahajan 2007 3.85 0.89 7 2.85 0.89 7 17.0% 1.00 [0.07, 1.93]
Woodyard 2004 3.42 0.93 12 2.19 0.95 12 21.3% 1.23 [0.48, 1.98]
Subtotal (95% CI) 56 56 100.0% 0.68 [0.20, 1.17]
Heterogeneity: Tau2=0.14; Chi2=7.78, df=3 (P=0.05); I2=61%
Test for overall effect: Z=2.77 (P=0.006)
-2 -1 0 1 2
Favours control Favours experimenta -2 -1 0 1 2
Favours control Favours experimenta
-2 -1 0 1 2
Favours control Favours experimenta -2 -1 0 1 2
Favours control Favours experimenta
A B
C D
ADM control Mean Difference Mean Difference
Study or Subgroup Mean SD Total Mean SD Total Weight IV, Fixed, 95% CI IV, Fixed, 95% CI 1.2.1 CAF+ADM versus CAF+CTG
Aichelmann-Reidy 2001 0.2 1 22 0.6 1 22 10.7% -0.40 [-0.99, 0.19]
Barras 2004 -0.2 0.54 16 -0.1 0.66 16 21.5% -0.10 [-0.52, 0.32]
Novas 2001 0.13 0.6 15 -0.09 0.75 15 15.9% 0.22 [-0.27, 0.71]
Paolantonio 2002 -0.13 0.51 15 -0.2 0.56 15 25.5% 0.07 [-0.31, 0.45]
Tal 2002 0.22 0.3 7 0 0.41 7 26.5% 0.22 [-0.16, 0.60]
Subtotal (95% CI) 75 75 100.0% 0.05 [-0.15, 1.17]
Heterogeneity: Chi2=3.99, df=4 (P=0.41); I2=0%
Test for overall effect: Z=0.47 (P=0.64) 1.2.2 CAF+ADM versus CAF
Ahmedbeyli 2014 0.33 0.32 24 0.21 0.25 24 77.7% 0.12 [-0.04, 0.28]
Cortes 2006 0.46 0.56 13 0.58 0.57 13 10.9% -0.12 [-0.55, 0.31]
Mahajan 2007 0.14 0.37 7 0.14 0.69 7 6.1% 0.00 [-0.58, 0.58]
Woodyard 2004 -0.25 0.62 12 -0.5 0.9 12 5.4% 0.25 [-0.37, 0.87]
Subtotal (95% CI) 56 56 100.0% 0.09 [-0.05, 0.24]
Heterogeneity: Chi2=1.38, df=3 (P=0.71); I2=0%
Test for overall effect: Z=1.28 (P=0.020)
(Continued to the next page)
DISCUSSION
The focused question of this meta-analysis was the clinical outcomes of CAF with ADM in the treatment of Miller I or II gingival recession in comparison to the reference treatments of CAF alone and CAF combined with CTG. A previous systematic review confirmed CAF to be a safe and reliable method in periodontal plastic surgery. CAF with CTG has been reported to result in better clinical outcomes than CAF alone, with no other therapies providing better results than CAF with CTG [28].
Figure 2. Forest plots for (A) the reduction in recession, (B) the reduction in probing depth, (C) the gain in clinical attachment level, and (D) the gain in keratinized tissue. CAF, coronally advanced flap; ADM, acellular dermal matrix; CTG, connective tissue grafting.
-2 -1 0 1 2
Favours control Favours experimenta -2 -1 0 1 2
Favours control Favours experimenta
-2 -1 0 1 2
Favours control Favours experimenta -2 -1 0 1 2
Favours control Favours experimenta
A B
C D
ADM control Mean Difference Mean Difference
Study or Subgroup Mean SD Total Mean SD Total Weight IV, Fixed, 95% CI IV, Fixed, 95% CI 1.3.1 CAF+ADM versus CAF+CTG
Aichelmann-Reidy 2001 1.5 1.1 22 1.6 1.1 22 23.7% -0.10 [-0.75, 0.55]
Barras 2004 1.6 0.96 16 1.4 0.98 16 22.2% 0.20 [-0.47, 0.87]
Novas 2001 0.81 0.93 15 0.92 1.23 15 16.4% -0.11 [-0.89, 0.67]
Paolantonio 2002 4.13 1.18 15 4.4 1.05 15 15.7% -0.27 [-1.07, 0.53]
Tal 2002 2.43 0.79 7 2.07 0.45 7 22.1% 0.36 [-0.31, 1.03]
Subtotal (95% CI) 75 75 100.0% 0.04 [-0.28, 0.36]
Heterogeneity: Chi2=1.98, df=4 (P=0.74); I2=0%
Test for overall effect: Z=0.25 (P=0.81) 1.3.2 CAF+ADM versus CAF
Ahmedbeyli 2014 2.75 0.54 24 2.17 0.81 24 68.1% 0.58 [0.19, 0.97]
Cortes 2006 2.11 1.04 13 1.92 0.93 13 17.9% 0.19 [-0.57, 0.95]
Woodyard 2004 3.67 0.75 12 2.69 1.32 12 14.0% 0.98 [0.12, 1.84]
Subtotal (95% CI) 49 49 100.0% 0.57 [0.24, 0.89]
Heterogeneity: Chi2=1.84, df=2 (P=0.40); I2=0%
Test for overall effect: Z=3.45 (P=0.0006)
-2 -1 0 1 2
Favours control Favours experimenta -2 -1 0 1 2
Favours control Favours experimenta
-2 -1 0 1 2
Favours control Favours experimenta -2 -1 0 1 2
Favours control Favours experimenta
A B
C D
ADM control Mean Difference Mean Difference
Study or Subgroup Mean SD Total Mean SD Total Weight IV, Random, 95% CI IV, Random, 95% CI 1.4.1 CAF+ADM versus CAF+CTG
Aichelmann-Reidy 2001 1.2 1.3 22 1.6 1.9 22 14.2% -0.40 [-1.36, 0.56]
Barras 2004 1 1.04 16 0.8 0.75 16 17.4% 0.20 [-0.43, 0.83]
Moslemi 2011 0.97 1.01 16 0.8 1.26 16 15.8% 0.17 [-0.62, 0.96]
Novas 2001 0.63 0.85 15 1.26 0.88 15 17.4% -0.63 [-1.25, -0.01]
Paolantonio 2002 0.53 0.51 15 1.93 1.03 15 17.8% -1.40 [-1.98, -0.82]
Tal 2002 0.86 0.6 7 2.14 0.6 7 17.4% -1.28 [-1.91, -0.65]
Subtotal (95% CI) 56 91 100.0% -0.58 [-1.16, 0.00]
Heterogeneity: Tau2=0.40; Chi2=21.67, df=5 (P=0.0006); I2=77%
Test for overall effect: Z=1.96 (P=0.05) 1.4.2 CAF+ADM versus CAF
Ahmedbeyli 2014 1.21 0.23 24 0.6 0.36 24 28.0% 0.61 [0.44, 0.78]
Cortes 2006 0.69 0.83 13 0.46 0.63 13 24.6% 0.23 [-0.34, 0.80]
Mahajan 2007 1.14 0.37 7 0.71 0.48 7 25.9% 0.43 [-0.02, 0.88]
Woodyard 2004 0.81 0.96 12 0.33 1.05 12 21.6% 0.48 [-0.32, 1.28]
Subtotal (95% CI) 56 56 100.0% 0.56 [0.41, 0.71]
Heterogeneity: Tau2=0.00; Chi2=1.99, df=3 (P=0.57); I2=0%
Test for overall effect: Z=7.24 (P < 0.00001)
29 http://doi.org/10.5051/jpis.2016.46.1.22
http://jpis.org
ADM has been introduced as an alternative to CTG in mucogingival surgery. An ADM allograft is obtained from human skin with the cellular components removed, such that the connective tissue matrix is left behind to act as a scaffold for cellular in-growth and tissue remodeling.
This process allows the revascularization and repopulation of blood vessels, fibroblasts, and epithelium from the receptor site [29,30]. ADM has a wide range of application in the dental field, including soft tissue augmentation for the treatment of alveolar ridge deformities, the augmentation of KT around teeth or implants, and as a barrier membrane in root coverage surgery [31-33].
The overall results of this meta-analysis revealed that the RecRed, PD reduction, and CAL gain were slightly higher in the CAF with ADM group than in the CAF with CTG group,
0.5-4 -2 0 2 4
0.4 0.3 0.2
SE(MD)
MD 0.1
0
CAF+ADM versus CAF+CTG CAF+ADM versus CAF Subgroups
Figure 3. Funnel plot for recession changes. CAF, coronally advanced flap; ADM, acellular dermal matrix; CTG, connective tissue grafting; SE, standard error; MD: mean difference.
Egger’s publication bias plot
-2 -1 0 1 2
Precision
standardized effect
0 .5 1 1.5 2
Figure 4. Egger funnel plot for recession change.
Tal(2002) Paolantonio(2002) Novas(2001) Moslemi(2011) Barras(2004) Aichelmann-Reidy(2001)
-0.33 -0.13 0.16 0.46 0.70
Meta-analysis estimates, given named study is omitted Lower CI Limit Estimate Upper CI Limit
Tal(2002) Paolantonio(2002) Novas(2001) Moslemi(2011) Aichelmann-Reidy(2001)
-0.47 -0.33 -0.01 0.31 0.55
Meta-analysis estimates, given named study is omitted Lower CI Limit Estimate Upper CI Limit Woodyard(2004)
Mahajan(2007) Cortes(2006) Ahmedbeyli(2014)
0.21 0.47 0.86 1.25 1.58
Meta-analysis estimates, given named study is omitted Lower CI Limit Estimate Upper CI Limit
A
B
C
Figure 5. Sensitivity analysis for (A) recession reduction comparing CAF with ADM and CAF with CTG, (B) recession reduction comparing CAF with ADM and CAF alone, and (C) KT gain comparing CAF with ADM and CAF with CTG. CAF, coronally advanced flap; ADM, acellular dermal matrix; CTG, connective tissue grafting; KT, keratinized tissue.
31 http://doi.org/10.5051/jpis.2016.46.1.22
http://jpis.org
but not to a statistically significant extent. However, CAF with ADM was associated with better values for these four clinical parameters than CAF alone, with statistically significant differences observed between these two groups in RecRed, CAL gain, and KT gain. These results showed that the combination of CAF with ADM provided better clinical outcomes than CAF alone. This might be related to the important fact that each side of ADM possesses different properties. The basement membrane surface in contact with the root surface and periosteum may act as a scaffold, allowing fibroblasts, epithelial cells, and keratinocytes to repopulate and form new tissues. In contrast, the connective tissue side faces the overlapping flap with collagen and elastin fibers. The two surfaces of this material have been found to show satisfactory biological compatibility [34]. Moreover, the application of ADM increases the thickness of the flap margin, which is considered to be important in defect coverage.
We did not detect any statistically significant difference between the ADM and CTG groups.
Previous studies have found CAF with CTG to be the gold standard for root coverage procedures. Therefore, our meta-analysis showed that ADM grafting is capable of yielding satisfactory results similar to those obtained using CTG. It is worth mentioning that the characteristics of the KT below the recession defect had a great impact on the choice of root coverage surgery. If the width of the KT below the recession area is at least 3 mm longer than the distance between the bottom of the gingival recession and the cementoenamel junction, CAF may suffice to cover the denuded root surface. If this distance is less than 3 mm, CAF with CTG or CAF with ADM may be a better choice [35].
With regard to the complications associated with the techniques, graft removal from the palate in CTG procedures may increase the likelihood of postoperative pain and hemorrhage.
In contrast, ADM avoids such issues and supplies an adequate source of material in cases that demand a wide range of graft tissues [36]. Graft exposure may sometimes take place in root coverage procedures. ADM exposure in the early healing phase may influence the ingrowth of cells and vessels and limit vascularization of the graft. However, CTG may reduce the impact of exposure since the adjacent blood supply can guarantee graft vitality [37].
The results of this meta-analysis showed that better results regarding KT were achieved with CTG than when ADM was used, although not to a statistically significant extent. The characteristics of ADM and the healing process may explain this outcome. ADM acts as a scaffold and a non-vital graft, meaning that only cells from the periodontal ligament and gingival connective tissue are capable of inducing the development of a keratinized epithelium [38]. Paolantonio et al. [20] suggested that the inductive properties of ADM depend on the extent of colonization of the non-vital graft by host cells derived from tissues capable of inducing keratinization. Novaes et al. [19] showed a greater gain in KT in CTG sites than in ADM sites three months after surgery; however, this difference disappeared at six months, which indicates that ADM may simply require more time to heal.
Esthetic concerns are extremely important for most patients, and most root coverage procedures can meet patients’ expectations. Joly et al. [36] showed that color matching and gingival contours seemed to be more favorable at sites treated with ADM. It has been established that a CTG measuring 1 mm in thickness is ideal for obtaining better esthetic outcomes [39], although it is difficult to harvest a uniform graft. Moreover, CTG can preserve the characteristics of palatal tissue, which determine gingival keratinization and influence local color matching. As discussed above, ADM presents several advantages in comparison with CTG, including elimination of a second surgical site for harvesting the graft, reduced
postoperative pain and discomfort, less chair time, favorable esthetic outcomes, and increased acceptance by patients.
Large heterogeneity was found for RecRed in both comparisons (CAF with ADM versus CAF with CTG, as well as CAF with ADM versus CAF alone) and for KT gains in the comparison of CAF with ADM versus CAF with CTG. This heterogeneity may have been related to several factors, including surgical techniques, the amount of KT, the severity of the recession defect, operator skill, and flap retraction from different grafts.
The limitations of this meta-analysis included the limited number of studies that were included, the limited quantity of newly published studies, the absence of data about recession defects and KT in some studies, the low quality of the studies that were included, and the potential of publication bias. These limitations may have hindered us from obtaining reliable guidelines for clinical practice. Therefore, more newly published, high-quality studies with more data regarding recession defects and KT tissue are required to confirm our findings.
ACKNOWLEDGEMENTS
The authors gratefully acknowledge Dr. Yinghong Zhou from Queensland University of Technology and Yu Chen from Hong Kong University for their extremely helpful suggestions and thorough review of this paper.
REFERENCES
1. Tugnait A, Clerehugh V. Gingival recession-its significance and management. J Dent 2001;29:381-94.
PUBMED | CROSSREF
2. Oates TW, Robinson M, Gunsolley JC. Surgical therapies for the treatment of gingival recession. A systematic review. Ann Periodontol 2003;8:303-20.
PUBMED | CROSSREF
3. Roccuzzo M, Bunino M, Needleman I, Sanz M. Periodontal plastic surgery for treatment of localized gingival recessions: a systematic review. J Clin Periodontol 2002;29 Suppl 3:178-94.
PUBMED | CROSSREF
4. Staffileno H. Management of gingival recession and root exposure problems associated with periodontal disease. Dent Clin North Am 1964;8:111-20.
5. Cohen DW, Ross SE. The double papillae repositioned flap in periodontal therapy. J Periodontol 1968;39:65-70.
PUBMED | CROSSREF
6. Pennel BM, Higgason JD, Towner JD, King KO, Fritz BD, Salder JF. Oblique Rotated Flap. J Periodontol 1965;36:305-9.
PUBMED | CROSSREF
7. Tarnow DP. Semilunar coronally repositioned flap. J Clin Periodontol 1986;13:182-5.
PUBMED | CROSSREF
8. Sullivan HC, Atkins JH. Free autogenous gingival grafts. I. Principles of successful grafting. Periodontics 1968;6:121-9.
PUBMED
9. Modica F, Del Pizzo M, Roccuzzo M, Romagnoli R. Coronally advanced flap for the treatment of buccal gingival recessions with and without enamel matrix derivative. A split-mouth study. J Periodontol 2000;71:1693-8.
PUBMED | CROSSREF
33 http://doi.org/10.5051/jpis.2016.46.1.22
http://jpis.org
10. Pini Prato G, Tinti C, Vincenzi G, Magnani C, Cortellini P, Clauser C. Guided tissue regeneration versus mucogingival surgery in the treatment of human buccal gingival recession. J Periodontol 1992;63:919-28.
PUBMED | CROSSREF
11. Wennström JL, Zucchelli G. Increased gingival dimensions. A significant factor for successful outcome of root coverage procedures? A 2-year prospective clinical study. J Clin Periodontol 1996;23:770-7.
PUBMED | CROSSREF
12. Harris RJ. Root coverage with a connective tissue with partial thickness double pedicle graft and an acellular dermal matrix graft: a clinical and histological evaluation of a case report. J Periodontol 1998;69:1305-11.
PUBMED | CROSSREF
13. Chambrone L, Sukekava F, Araújo MG, Pustiglioni FE, Chambrone LA, Lima LA. Root-coverage procedures for the treatment of localized recession-type defects: a Cochrane systematic review. J Periodontol 2010;81:452-78.
PUBMED | CROSSREF
14. Ayub LG, Ramos UD, Reino DM, Grisi MF, Taba M, Souza SL, et al. A Randomized comparative clinical study of two surgical procedures to improve root coverage with the acellular dermal matrix graft. J Clin Periodontol 2012;39:871-8.
PUBMED | CROSSREF
15. Higgins JP, Green S, editors. Cochrane handbook for systematic reviews of interventions version 5.1.0.
London: The Cochrane Collaboration; 2011. Available from: www.cochrane-handbook.org
16. Deeks JJ, Higgins JP, Altman DG. Chapter 9: Analysing data and undertaking meta-analyses. In: Higgins JP, Green S, editors. Cochrane handbook for systematic reviews of interventions version 5.1.0. London:
The Cochrane Collaboration; 2011. Available from: www.cochrane-handbook.org
17. Higgins JP, Thompson SG. Quantifying heterogeneity in a meta-analysis. Stat Med 2002;21:1539-58.
PUBMED | CROSSREF
18. Aichelmann-Reidy ME, Yukna RA, Evans GH, Nasr HF, Mayer ET. Clinical evaluation of acellular allograft dermis for the treatment of human gingival recession. J Periodontol 2001;72:998-1005.
PUBMED | CROSSREF
19. Novaes AB Jr, Grisi DC, Molina GO, Souza SL, Taba M Jr, Grisi MF. Comparative 6-month clinical study of a subepithelial connective tissue graft and acellular dermal matrix graft for the treatment of gingival recession. J Periodontol 2001;72:1477-84.
PUBMED | CROSSREF
20. Paolantonio M, Dolci M, Esposito P, D’Archivio D, Lisanti L, Di Luccio A, et al. Subpedicle acellular dermal matrix graft and autogenous connective tissue graft in the treatment of gingival recessions: a comparative 1-year clinical study. J Periodontol 2002;73:1299-307.
PUBMED | CROSSREF
21. Tal H, Moses O, Zohar R, Meir H, Nemcovsky C. Root coverage of advanced gingival recession: a comparative study between acellular dermal matrix allograft and subepithelial connective tissue grafts. J Periodontol 2002;73:1405-11.
PUBMED | CROSSREF
22. Barros RR, Novaes AB, Grisi MF, Souza SL, Taba MJ, Palioto DB. A 6-month comparative clinical study of a conventional and a new surgical approach for root coverage with acellular dermal matrix. J Periodontol 2004;75:1350-6.
PUBMED | CROSSREF
23. Woodyard JG, Greenwell H, Hill M, Drisko C, Iasella JM, Scheetz J. The clinical effect of acellular dermal matrix on gingival thickness and root coverage compared to coronally positioned flap alone. J Periodontol 2004;75:44-56.
PUBMED | CROSSREF
24. de Queiroz Côrtes A, Sallum AW, Casati MZ, Nociti FH Jr, Sallum EA. A two-year prospective study of coronally positioned flap with or without acellular dermal matrix graft. J Clin Periodontol 2006;33:683-9.
PUBMED | CROSSREF
25. Mahajan A, Dixit J, Verma UP. A patient-centered clinical evaluation of acellular dermal matrix graft in the treatment of gingival recession defects. J Periodontol 2007;78:2348-55.
PUBMED | CROSSREF
26. Moslemi N, Mousavi Jazi M, Haghighati F, Morovati SP, Jamali R. Acellular dermal matrix allograft versus subepithelial connective tissue graft in treatment of gingival recessions: a 5-year randomized clinical study. J Clin Periodontol 2011;38:1122-9.
PUBMED | CROSSREF
27. Ahmedbeyli C, Ipçi SD, Cakar G, Kuru BE, Yılmaz S. Clinical evaluation of coronally advanced flap with or without acellular dermal matrix graft on complete defect coverage for the treatment of multiple gingival recessions with thin tissue biotype. J Clin Periodontol 2014;41:303-10.
PUBMED | CROSSREF
28. Cairo F, Pagliaro U, Nieri M. Treatment of gingival recession with coronally advanced flap procedures: a systematic review. J Clin Periodontol 2008;35 Suppl:136-62.
PUBMED | CROSSREF
29. Batista EL Jr, Batista FC, Novaes AB Jr. Management of soft tissue ridge deformities with acellular dermal matrix. Clinical approach and outcome after 6 months of treatment. J Periodontol 2001;72:265-73.
PUBMED | CROSSREF
30. Reagan BJ, Madden MR, Huo J, Mathwich M, Staiano-Coico L. Analysis of cellular and decellular allogeneic dermal grafts for the treatment of full-thickness wounds in a porcine model. J Trauma 1997;43:458-66.
PUBMED | CROSSREF
31. Alghamdi H, Babay N, Sukumaran A. Surgical management of gingival recession: A clinical update. Saudi Dent J 2009;21:83-94.
PUBMED | CROSSREF
32. Batista EL Jr, Batista FC, Novaes AB Jr. Management of soft tissue ridge deformities with acellular dermal matrix. Clinical approach and outcome after 6 months of treatment. J Periodontol 2001;72:265-73.
PUBMED | CROSSREF
33. Jayavel K, Swaminathan M, Kumar S. Ridge augmentation and root coverage using acellular dermal matrix: a case report. Dent Res J (Isfahan) 2010;7:88-91.
PUBMED
34. Gholami GA, Saberi A, Kadkhodazadeh M, Amid R, Karami D. Comparison of the clinical outcomes of connective tissue and acellular dermal matrix in combination with double papillary flap for root coverage:
A 6-month trial. Dent Res J (Isfahan) 2013;10:506-13.
PUBMED
35. Pini Prato G, Rotundo R, Franceschi D, Cairo F, Cortellini P, Nieri M. Fourteen-year outcomes of coronally advanced flap for root coverage: follow-up from a randomized trial. J Clin Periodontol 2011;38:715-20.
PUBMED | CROSSREF
36. Joly JC, Carvalho AM, da Silva RC, Ciotti DL, Cury PR. Root coverage in isolated gingival recessions using autograft versus allograft: a pilot study. J Periodontol 2007;78:1017-22.
PUBMED | CROSSREF
37. Henderson RD, Greenwell H, Drisko C, Regennitter FJ, Lamb JW, Mehlbauer MJ, et al. Predictable multiple site root coverage using an acellular dermal matrix allograft. J Periodontol 2001;72:571-82.
PUBMED | CROSSREF
38. Karring T, Lang NP, Löe H. The role of gingival connective tissue in determining epithelial differentiation.
J Periodontal Res 1975;10:1-11.
PUBMED | CROSSREF
39. Zucchelli G, Amore C, Sforza NM, Montebugnoli L, De Sanctis M. Bilaminar techniques for the treatment of recession-type defects. A comparative clinical study. J Clin Periodontol 2003;30:862-70.
PUBMED | CROSSREF