D I A B E T E S & M E T A B O L I S M J O U R N A L
This is an Open Access article distributed under the terms of the Creative Commons At- tribution Non-Commercial License (http://creativecommons.org/licenses/by-nc/3.0/) which permits unrestricted non-commercial use, distribution, and reproduction in any medium, provided the original work is properly cited.
Agreement between Framingham Risk Score and United Kingdom Prospective Diabetes Study Risk Engine in Identifying High Coronary Heart Disease Risk in North Indian Population
Dipika Bansal1, Ramya S. R. Nayakallu1, Kapil Gudala1, Rajavikram Vyamasuni1, Anil Bhansali2
1Department of Pharmacy Practice, National Institute of Pharmaceutical Education and Research, Mohali,
2Department of Endocrinology, Postgraduate Institute of Medical Education and Research, Chandigarh, India
Background: The aim of the study is to evaluate the concurrence between Framingham Risk score (FRS) and United Kingdom Prospective Diabetes Study (UKPDS) risk engine in identifying coronary heart disease (CHD) risk in newly detected diabetes mellitus patients and to explore the characteristics associated with the discrepancy between them.
Methods: A cross-sectional study involving 489 subjects newly diagnosed with type 2 diabetes mellitus was conducted. Agree- ment between FRS and UKPDS in classifying patients as high risk was calculated using kappa statistic. Subjects with discrepant scores between two algorithms were identified and associated variables were determined.
Results: The FRS identified 20.9% subjects (range, 17.5 to 24.7) as high-risk while UKPDS identified 21.75% (range, 18.3 to 25.5) as high-risk. Discrepancy was observed in 17.9% (range, 14.7 to 21.7) subjects. About 9.4% had high risk by UKPDS but not FRS, and 8.6% had high risk by FRS but not UKPDS. The best agreement was observed at high-risk threshold of 20% for both (κ=0.463). Analysis showed that subjects having high risk on FRS but not UKPDS were elderly females having raised systolic and diastolic blood pressure. Patients with high risk on UKPDS but not FRS were males and have high glycosylated hemoglobin.
Conclusion: The FRS and UKPDS (threshold 20%) identified different populations as being at high risk, though the agreement between them was fairly good. The concurrence of a number of factors (e.g., male sex, low high density lipoprotein cholesterol, and smoking) in both algorithms should be regarded as increasing the CHD risk. However, longitudinal follow-up is required to form firm conclusions.
Keywords: Coronary heart disease; Diabetes mellitus; Predictive value of tests; Risk assessment
Corresponding author: Dipika Bansal
Department of Pharmacy Practice, National Institute of Pharmaceutical Research, Sector 67, SAS Nagar, Mohali, India
E-mail: dipikabansal079@gmail.com
INTRODUCTION
It is a well accepted fact that cardiovascular disease (CVD) risk factors such as smoking, dyslipidemia, and diabetes cluster to- gether and interact multiplicatively to enhance vascular risk [1,2]. This understanding has led to the development of multi- variable risk prediction models incorporating various risk fac-
tors and can be utilized by clinicians for assessing individual subject for the risk of developing CVD or specific components of CVD, i.e., coronary heart disease (CHD) [3,4], peripheral vascular disease [5], or stroke [6]. For example, the Framingham formulation [3] for predicting CHD was incorporated into the Third Report of the Expert Panel on Detection, Evaluation, and Treatment of High Blood Cholesterol in Adults (Adult Treat- http://dx.doi.org/10.4093/dmj.2015.39.4.321
pISSN 2233-6079 · eISSN 2233-6087
ment Panel III) [7]. The Framingham risk assessment tool has been validated in whites and blacks in the United States [8] and later modified so that they are valid to culturally diverse popula- tions in Europe, the Mediterranean region [9] and Asia [10].
Type 2 diabetes mellitus (T2DM) is expanding in pandemic proportions worldwide and particularly in developing nations like India. Diabetes poses two to four times higher risk for de- veloping CVD [11] as compared to general population. This perception headed to the development of diabetes specific mul- tivariable risk prediction algorithms by different ethnic groups for efficient prevention and management [12]. The prognostic ability of these algorithms differs substantially among different populations [13]. For example, United Kingdom Prospective Diabetes Study (UKPDS) Risk Engine was developed based on large randomized controlled trial which showed that both in- tensive treatment of blood glucose and of blood pressure in di- abetes can lower the risk of diabetes-related complications in individuals newly diagnosed with T2DM. This model also pro- vided the algorithm for CHD risk assessment specifically in subjects with T2DM [12].
Indians are considered ethnically to be a high-risk population both for T2DM and CVD [14]. However, no India specific pre- dictive CVD risk score has been developed till date and we con- tinue to use the risk models. In this context the present study is conducted to assess 10-year CHD risk in newly diagnosed T2DM patients using Framingham risk score (FRS) [3] which was devel- oped in general population and UKPDS which is diabetes specif- ic CVD risk engine [12].
METHODS
Study sample selection
Subjects for the present study are drawn out of the baseline cross-sectional data from an ongoing study that is aimed to as- sess the performance of FRS and UKPDS risk engine in a pub- lic tertiary care hospital in North India. The study proceeded following the approval from the Institute Ethics Committee (PGIMER, Chandigarh, India). Consecutive patients of either sex, aged 18 to 75 years visiting endocrinology outpatient clinic of the hospital and newly diagnosed with T2DM (≤6 months duration of diagnosis) were eligible for study enrolment. The patients were enrolled if they had necessary data in their medi- cal files to calculate FRS and UKPDS and were also ready to be interviewed for additional parameters. All patients provided written informed consent before their recruitment in the study.
Pregnant and lactating women and patients with prior CVD were excluded. The sociodemographic and clinical characteris- tics of patients were obtained from the medical records avail- able with the subjects and behavioural factors by personal in- terviews.
Assessment of CHD risk using FRS and UKPDS risk engine Ten-year CHD risk was calculated according to FRS and UKP- DS risk engine. Baseline risk factors included in UKPDS risk engine includes age, sex, race, smoking status, glycosylated he- moglobin (HbA1c), systolic blood pressure (SBP), total choles- terol, and high density lipoprotein cholesterol (HDL-C). Base- line risk factors included in FRS includes age, sex, total choles- terol, HDL-C, SBP, diastolic blood pressure (DBP), smoking status and presence of diabetes. A risk score <10% is considered very low, 10% to 15% low, 15% to 20% moderate, and >20% re- flects high 10-year risk of cardiovascular events [3]. To calculate coronary risk, the following variables were collected: age, sex, total cholesterol, HDL-C, SBP, DBP, and smoking history.
Blood pressure was measured using mercury sphygmoma- nometer as recommended in several guidelines. Blood tests were performed in venous blood, after at least 8 hours fasting, in reference laboratories in the hospital. Lipid profiles were evaluated in accordance with the recommendations of the Adult Treatment Panel III [7]. The proportion of high risk sub- jects on FRS with high risk cut off at 20% and the UKPDS risk engine at various cut-offs is calculated. The proportion of study subjects categorised into level of risk using both FRS chart and UKPDS risk engine were compared at 20% high risk cut-point and were analysed for the variables involved in discrepancy.
Statistical analysis
Data analysis was done by descriptive and analytic statistics using SPSS version 14.0 (SPSS Inc., Chicago, IL, USA). Agree- ment between the two charts was assessed using the κ statistic (κ<0.2, poor agreement; 0.21 to 0.40, fair agreement; 0.41 to 0.60, moderate agreement; 0.61 to 0.80, good agreement; and 0.81 to 1.0, very good agreement) [7]. Discrepancies between the two scales were analyzed using the Pearson chi-square test for categorical variables and the Student t-test for quantitative variables, based on estimates of normality and equality of vari- ances.
A P value less than 0.05 was considered statistically signifi- cant and 95% confidence intervals calculated.
RESULTS
Patient characteristics
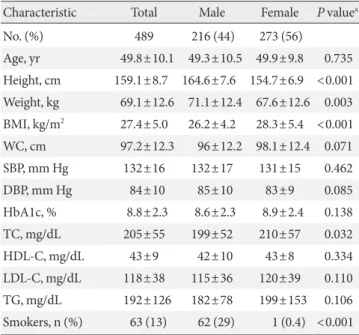
Of the 489 subjects included in the present study, the mean age±standard deviation was 49.8±10.1 years 56% were women and 13% were smokers, 14% had a history of hypertension. The mean SBP of the study cohort was 132±16 and diastolic 84±10 mm Hg. The mean FRS value was 15.1%, and the mean UKP- DS risk engine score value was 13.4%. The baseline patient characteristics are shown in Table 1.
Assessment of CHD risk status
Using a threshold of 20%, 20.9% of the sample was classified as high risk using the FRS compared to 7.2% using UKPDS risk engine with cut-off at 30%. When a cut-point of 25% was used, the proportion of high risk subjects on the UKPDS risk engine increased to 12.7%. The proportion of high risk subjects on FRS with high risk cut off at 20% and the UKPDS risk engine at various cut-offs is shown in Fig. 1. The κ indices between the FRS and UKPDS risk engine are also shown. The κ index in-
creased as the cut-point for high risk decreased on the UKPDS risk engine. The highest agreement was observed for a thresh- old of 20% of both the scores. At this cut-point, the number of high risk cases identified by the two scoring systems was found to be similar (P<0.001). Lowering the cut-point to 15% did not increase agreement between the two charts. Table 2 shows the distribution of the population into high risk and non-high risk groups using thresholds of 20% on both FRS and UKPDS risk engine. There was disagreement between the two scoring sys- tems for 17.9% (14.7% to 21.7%) of cases (high risk on one scoring system but not on the other; κ=0.46 [0.36 to 0.56]). Of those, 9.4% were classified as high risk by UKPDS risk engine but not by FRS, and 8.6% were classified as high risk by FRS but not by UKPDS risk engine.
Table 3 shows the characteristics of the two groups in which there were discrepancies between the two instruments. Indi-
Table 1. Sociodemographic and biochemical characteristics Characteristic Total Male Female P valuea
No. (%) 489 216 (44) 273 (56)
Age, yr 49.8±10.1 49.3±10.5 49.9±9.8 0.735 Height, cm 159.1±8.7 164.6±7.6 154.7±6.9 <0.001 Weight, kg 69.1±12.6 71.1±12.4 67.6±12.6 0.003 BMI, kg/m2 27.4±5.0 26.2±4.2 28.3±5.4 <0.001 WC, cm 97.2±12.3 96±12.2 98.1±12.4 0.071
SBP, mm Hg 132±16 132±17 131±15 0.462
DBP, mm Hg 84±10 85±10 83±9 0.085
HbA1c, % 8.8±2.3 8.6±2.3 8.9±2.4 0.138
TC, mg/dL 205±55 199±52 210±57 0.032
HDL-C, mg/dL 43±9 42±10 43±8 0.334
LDL-C, mg/dL 118±38 115±36 120±39 0.110
TG, mg/dL 192±126 182±78 199±153 0.106
Smokers, n (%) 63 (13) 62 (29) 1 (0.4) <0.001 Values are presented as mean±standard deviation.
BMI, body mass index; WC, waist circumference; SBP, systolic blood pressure; DBP, diastolic blood pressure; HbA1c, glycosylated hemo- globin; TC, total cholesterol; HDL-C, high density lipoprotein cho- lesterol; LDL-C, low density lipoprotein cholesterol; TG, triglycer- ides.
aP value indicates the comparison between males and females where continuous variables assessed using unpaired t-test and categorical variables were assessed using chi-square test.
60 50 40 30 20 10
% of patients with high CHD risk 0
FRS >
20 UKPDS >
30 UKPDS >
25 UKPDS >
20 UKPDS >
15 UKPDS >
10 20.9
7.2 12.7 21.7 33.1
(17.5–24.7) 51
κ =0.273 (5.2–5.8)
κ =0.363 (10.0–15.9)
κ =0.463 (18.3–25.5)
κ =0.42 (29.1–37.4)
κ =0.298 (46.7–55.5)
Fig. 1. Percentage of patients classified as high risk by Fram- ingham Risk score (FRS) and UKPDS, United Kingdom Pro- spective Diabetes Study (UKPDS) using different cut-points.
CHD, coronary heart disease.
Table 2. Distribution of subjects according to classification as high risk using FRS and UKPDS
FRS assessment UKPDS assessment
Not high risk High risk
Not high risk 341 (69.7) 46 (9.4)
High risk 42 (8.6) 60 (12.3)
Values are presented as number (%). κ=0.463 (0.365 to 0.561), P<
0.001, Mc Nemar=0.749. Discrepancies=88 (17.99%; 95% confi- dence interval, 14.75 to 21.76).
FRS, Framingham Risk score; UKPDS, United Kingdom Prospective Diabetes Study.
viduals classified as high risk on UKPDS risk engine but not on Framingham risk equation included a high percentage of males and cases with higher HbA1c levels than the group which clas- sified as high risk with FRS but not on UKPDS risk engine. In the latter group, there were higher percentages of women and subjects with age ≥50 years. Also subjects had higher SBP and DBP values.
Table 4 shows the distribution of study subjects in various risk categories in detail from very low to high risk according to both the risk scoring systems. Using UKPDS more variation was observed in high risk category according to the gender, where 34% (n=73) are males and 12% (n=33) are females, while using FRS 26% (n=55) are males and 18% (n=49) are
females. Though fair inter-rater agreement was observed be- tween FRS and UKPDS scores (κ=0.27 [0.24 to 0.32]), large discrepancies are observed in very low, low, and moderate risk categories. While 49% of the study subjects are categorized as very low risk subjects according to UKPDS, only 30% subjects fell into very-low risk category according to FRS.
DISCUSSION
In the present North Indian population study in individuals aged 18 to 75 years with no history of CVD and newly diag- nosed with T2DM, the predicted results shows 21% and 22%
of the study subjects having high risk of developing CHD in Table 3. Characteristics of individuals with a discrepancy in coronary heart disease risk using FRS and UKPDS
Characteristic High risk using UKPDS but not FRS
(n=46, 9.4%) High risk using FRS but not UKPDS
(n=42, 8.6%) P value
Women 17 (37) 27 (64) 0.010
Age, yr 54.3±9.7 57.2±5.6 0.080
Age ≥50 35 (76.1) 41 (98) <0.001
Body mass index, kg/m2 26.6±3.3 27.9±5.4 0.195
Smoking 10 (22) 8 (19) 0.755
Glycosylated hemoglobin, % 11.4±2.5 7.6±1.5 <0.001
Total cholesterol, mg/dL 215±49 230±57 0.187
High density lipoprotein cholesterol, mg/dL 41±10 41±8 0.940
Low density lipoprotein cholesterol, mg/dL 123±34 131±41 0.378
Triglycerides, mg/dL 218±152 221±115 0.937
Systolic blood pressure, mm Hg 127±14 142±13 <0.001
Diastolic blood pressure, mm Hg 80.41±9.23 89±10 <0.001
Hypertension >130/80 mm Hg 14 (30) 33 (79) <0.001
Values are presented as number (%) or mean±standard deviation.
FRS, Framingham Risk score; UKPDS, United Kingdom Prospective Diabetes Study.
aP value indicates the comparison between males and females, where continuous variables are expressed in mean±standard deviation and as- sessed using unpaired t-test and categorical variables were expressed in percentages and assessed using chi-square test.
Table 4. Comparison of estimated coronary heart disease risk scores according to FRS and UKPDS
FRS UKPDS
Total Male Female Total Male Female
Risk, n (%) 489 (100) 216 (44) 273 (56) 489 (100) 216 (44) 273 (56)
High 104 (21) 55 (26) 49 (18) 106 (22) 73 (34) 33 (12)
Moderate 116 (24) 46 (21) 70 (26) 57 (12) 36 (17) 21 (8)
Low 124 (25) 57 (26) 67 (25) 89 (18) 37 (17) 52 (19)
Very low 145 (30) 58 (27) 87 (32) 237 (49) 70 (32) 167 (61)
FRS, Framingham Risk score; UKPDS, United Kingdom Prospective Diabetes Study.
10 years using FRS and UKPDS equations respectively. Only moderate agreement in identifying CHD risk was observed between FRS and UKPDS risk engine (using 20% cut-point).
We did not find significant difference in high risk category in FRS and UKPDS (21% [n=104] vs. 22% [n=106]). However, the actual patients identified by the two scoring systems are dif- ferent. Although Table 4 suggests significant difference in ‘very low risk group’ of FRS and UKPDS; but it was definite only in women (32% vs. 61%), not in men (27% vs. 32%), it carries less importance since it’s the high risk category that needs to be tar- geted and requires active intervention to prevent future mor- bidity and mortality.
Factors associated with individuals being classified as high risk using FRS but not UKPDS were low HbA1c, high blood pressure, particularly in elderly women; being classified as high risk by UKPDS but not by FRS was associated with being male and having a high HbA1c values or lower baseline SBP and DBP.
Compared to FRS, UKPDS may underestimate risk in pa- tients with diabetes, low HbA1c, high blood pressure, particu- larly in elderly women. On the other hand, in comparison to UKPDS, FRS is likely to underestimate risk in young male pa- tients with high HbA1c.
Agreement of the FRS and UKPDS risk engine
Using scoring algorithms to estimate CHD risk has its limita- tions. Comparative studies of the FRS and UKPDS have been done in various ethnic subgroups. In a cross-sectional study of 199 asymptomatic T2DM patients, Rakhit et al. [15] reported that area under the curves (AUCs) of the FRS and UKPDS risk engine were 0.61 and 0.56, respectively, with no significant dif- ference between them. Guzder et al. [16] compared the pre- dictability of the FRS and UKPDS equations in 428 newly di- agnosed T2DM patients in United Kingdom and reported that the AUCs of FRS and UKPDS were 0.657 and 0.670, respec- tively. In contrary to the above line of evidence, in a study by Simmons et al. [11] estimated 10-year CVD risk in the DM group as 37% and 33% using the FRS and UKPDS equations respectively.
In this study, we found that the estimated risk of developing CHD was more in males than in females which are similar to the findings of Hernaez et al. [17], where risk was higher in men. In general, males have a greater risk of CHD than females, but this observed gender difference gets diminished in T2DM patients [3,18-20].
A systematic review of 27 external validity studies found that
the performance of the FRS differs significantly among differ- ent countries and ethnic groups. Predicted to observed ratios using FRS ranged from an under prediction of 0.43 in a high risk population, to over-prediction of 2.87 in low risk popula- tions [21]. In our study UKPDS may have generated higher risk scores than FRS because it was developed for risk estimation in a population with diabetes, including important variables such as diabetes duration and HbA1c level, whereas the FRS was de- veloped for general population.
Limitations
The main limitation of the study is its cross-sectional design meaning thereby the patients were not followed-up over time.
Nevertheless, such a design is appropriate for assessing agree- ment between the scoring algorithms. Though the present study is being conducted using a rigorous methodology, the small sample size is yet another limitation.
Subjects in the study do not represent the national sample which is one of the limitations because in India there is no pub- lically accessible database/registry. The present study is being conducted in largest tertiary care centre, i.e., PGIMER where patients from five different states covering entire Northern In- dia visit the hospital. The present study is prospective study where each patient interfaced the researcher and was inter- viewed using structured questionnaire. Present manuscript is a part of larger project which aims at creating a new scoring sys- tem which will be useful for Indian patients.
Right now based on cross-sectional results we cannot com- ment on applicability of these algorithms in Indians, as Indians have been found to manifest CHD at lower body mass index [22,23], waist circumference [24,25], and total cholesterol levels relative to other ethnic groups [26,27]. The results of this study with longitudinal follow-up may help in exploring these issues further to draw firm conclusions and recalibration of popula- tion-specific CVD risk prediction tools which will translate the findings into Indian context.
In conclusion, discrepancies in risk assessment and the identification of high risk individuals between the FRS and UKPDS risk engine (using a cut-point of 20%) have been ob- served. The two algorithms identify different populations as being at high risk. Defining the variables involved that resulted in discrepancies between the two algorithms can help in de- signing a new risk assessment tool which is valid for Indian population, which may help to improve the clinical assessment of CHD risk in patients with T2DM.
The importance of these findings and the impact of their ap- plication in clinical practice should be confirmed in future lon- gitudinal studies.
CONFLICTS OF INTEREST
No potential conflict of interest relevant to this article was re- ported.
ACKNOWLEDGMENTS
Authors are grateful to Ms. Harini Muthyala and Mr. Hari Prasad Esam for their assistance in data collection.
REFERENCES
1. Jackson R. Guidelines on preventing cardiovascular disease in clinical practice. BMJ 2000;320:659-61.
2. Anderson KM, Odell PM, Wilson PW, Kannel WB. Cardiovas- cular disease risk profiles. Am Heart J 1991;121(1 Pt 2):293-8.
3. Wilson PW, D’Agostino RB, Levy D, Belanger AM, Silbershatz H, Kannel WB. Prediction of coronary heart disease using risk factor categories. Circulation 1998;97:1837-47.
4. Anderson KM, Wilson PW, Odell PM, Kannel WB. An updat- ed coronary risk profile. A statement for health professionals.
Circulation 1991;83:356-62.
5. Murabito JM, D’Agostino RB, Silbershatz H, Wilson WF. Inter- mittent claudication. A risk profile from The Framingham Heart Study. Circulation 1997;96:44-9.
6. Wolf PA, D’Agostino RB, Belanger AJ, Kannel WB. Probability of stroke: a risk profile from the Framingham Study. Stroke 1991;22:312-8.
7. Expert Panel on Detection, Evaluation, and Treatment of High Blood Cholesterol in Adults. Executive summary of the third re- port of The National Cholesterol Education Program (NCEP) Expert Panel on Detection, Evaluation, And Treatment of High Blood Cholesterol In Adults (Adult Treatment Panel III). JAMA 2001;285:2486-97.
8. D’Agostino RB Sr, Grundy S, Sullivan LM, Wilson P; CHD Risk Prediction Group. Validation of the Framingham coro- nary heart disease prediction scores: results of a multiple eth- nic groups investigation. JAMA 2001;286:180-7.
9. Marrugat J, D’Agostino R, Sullivan L, Elosua R, Wilson P, Or- dovas J, Solanas P, Cordon F, Ramos R, Sala J, Masia R, Kannel WB. An adaptation of the Framingham coronary heart disease
risk function to European Mediterranean areas. J Epidemiol Community Health 2003;57:634-8.
10. Liu J, Hong Y, D’Agostino RB Sr, Wu Z, Wang W, Sun J, Wilson PW, Kannel WB, Zhao D. Predictive value for the Chinese pop- ulation of the Framingham CHD risk assessment tool compared with the Chinese Multi-Provincial Cohort Study. JAMA 2004;
291:2591-9.
11. Simmons RK, Coleman RL, Price HC, Holman RR, Khaw KT, Wareham NJ, Griffin SJ. Performance of the UK Prospective Diabetes Study Risk Engine and the Framingham Risk Equa- tions in Estimating Cardiovascular Disease in the EPIC: Nor- folk Cohort. Diabetes Care 2009;32:708-13.
12. Stevens RJ, Kothari V, Adler AI, Stratton IM; United Kingdom Prospective Diabetes Study (UKPDS) Group. The UKPDS risk engine: a model for the risk of coronary heart disease in type II diabetes (UKPDS 56). Clin Sci (Lond) 2001;101:671-9.
13. Chamnan P, Simmons RK, Sharp SJ, Griffin SJ, Wareham NJ.
Cardiovascular risk assessment scores for people with diabe- tes: a systematic review. Diabetologia 2009;52:2001-14.
14. Kanjilal S, Rao VS, Mukherjee M, Natesha BK, Renuka KS, Sibi K, Iyengar SS, Kakkar VV. Application of cardiovascular disease risk prediction models and the relevance of novel biomarkers to risk stratification in Asian Indians. Vasc Health Risk Manag 2008;4:199-211.
15. Rakhit DJ, Downey M, Jeffries L, Moir S, Prins JB, Marwick TH. Screening for coronary artery disease in patients with dia- betes: a Bayesian strategy of clinical risk evaluation and exer- cise echocardiography. Am Heart J 2005;150:1074-80.
16. Guzder RN, Gatling W, Mullee MA, Mehta RL, Byrne CD.
Prognostic value of the Framingham cardiovascular risk equa- tion and the UKPDS risk engine for coronary heart disease in newly diagnosed type 2 diabetes: results from a United King- dom study. Diabet Med 2005;22:554-62.
17. Hernaez R, Choque L, Gimenez M, Costa A, Marquez JI, Con- get I. Coronary risk assessment in subjects with type 2 diabetes mellitus. General population-based scores or specific scores?
Rev Esp Cardiol 2004;57:577-80.
18. McGuire DK, Granger CB. Diabetes and ischemic heart dis- ease. Am Heart J 1999;138(5 Pt 1):S366-75.
19. McEwan P, Williams JE, Griffiths JD, Bagust A, Peters JR, Hop- kinson P, Currie CJ. Evaluating the performance of the Fram- ingham risk equations in a population with diabetes. Diabet Med 2004;21:318-23.
20. Coleman RL, Stevens RJ, Retnakaran R, Holman RR. Framing- ham, SCORE, and DECODE risk equations do not provide re-
liable cardiovascular risk estimates in type 2 diabetes. Diabetes Care 2007;30:1292-3.
21. Brindle P, May M, Gill P, Cappuccio F, D’Agostino R Sr, Fisch- bacher C, Ebrahim S. Primary prevention of cardiovascular disease: a web-based risk score for seven British black and mi- nority ethnic groups. Heart 2006;92:1595-602.
22. Deurenberg-Yap M, Chew SK, Lin VF, Tan BY, van Staveren WA, Deurenberg P. Relationships between indices of obesity and its co-morbidities in multi-ethnic Singapore. Int J Obes Relat Metab Disord 2001;25:1554-62.
23. Misra A, Vikram NK. Insulin resistance syndrome (metabolic syndrome) and obesity in Asian Indians: evidence and impli- cations. Nutrition 2004;20:482-91.
24. Mohan V, Deepa M, Farooq S, Narayan KM, Datta M, Deepa R. Anthropometric cut points for identification of cardiometa-
bolic risk factors in an urban Asian Indian population. Metab- olism 2007;56:961-8.
25. Misra A, Madhavan M, Vikram NK, Pandey RM, Dhingra V, Luthra K. Simple anthropometric measures identify fasting hyperinsulinemia and clustering of cardiovascular risk factors in Asian Indian adolescents. Metabolism 2006;55:1569-73.
26. Mohan V, Deepa R, Rani SS, Premalatha G; Chennai Urban Population Study (CUPS No.5). Prevalence of coronary artery disease and its relationship to lipids in a selected population in South India: The Chennai Urban Population Study (CUPS No.
5). J Am Coll Cardiol 2001;38:682-7.
27. Goel PK, Bharti BB, Pandey CM, Singh U, Tewari S, Kapoor A, Garg N, Sinha N. A tertiary care hospital-based study of con- ventional risk factors including lipid profile in proven coro- nary artery disease. Indian Heart J 2003;55:234-40.