I. Introduction
Mobile phones are the most ubiquitous type of equipment in the world, 3.3 billion people—half of the earth’s inhabit- ants—have at least one mobile phone. Mobile healthcare ap- plications are becoming a growing trend as more people now own cell phones, smartphones or table PCs [1]. In particular, smartphone applications (apps), available on the Apple or Android app stores, have been developed for patients and physicians [2].
The prevalence of dementia in modern society is showing a steady growing trend. In South Korea, the prevalence of
Online Learning for Classification of Alzheimer Disease based on Cortical Thickness and
Hippocampal Shape Analysis
Ga-Young Lee, BS1, Jeonghun Kim, MS2, Ju Han Kim, MD, PhD3,4, Kiwoong Kim, MD, PhD5, Joon-Kyung Seong, PhD1
Departments of 1Biomedical Engineering and 2Computer and Radio Communications Engineering, Korea University, Seoul; 3Seoul National University Biomedical informatics (SNUBI), Division of Biomedical Informatics, Seoul National University College of Medicine, Seoul; 4Systems Biomedical Informatics Research Center, Seoul National University, Seoul; 5Department of Neuropsychiatry, Seoul National University Bundang Hospital, Seoul National University College of Medicine, Seongnam, Korea
Objectives: Mobile healthcare applications are becoming a growing trend. Also, the prevalence of dementia in modern so- ciety is showing a steady growing trend. Among degenerative brain diseases that cause dementia, Alzheimer disease (AD) is the most common. The purpose of this study was to identify AD patients using magnetic resonance imaging in the mobile environment. Methods: We propose an incremental classification for mobile healthcare systems. Our classification method is based on incremental learning for AD diagnosis and AD prediction using the cortical thickness data and hippocampus shape. We constructed a classifier based on principal component analysis and linear discriminant analysis. We performed initial learning and mobile subject classification. Initial learning is the group learning part in our server. Our smartphone agent implements the mobile classification and shows various results. Results: With use of cortical thickness data analysis alone, the discrimination accuracy was 87.33% (sensitivity 96.49% and specificity 64.33%). When cortical thickness data and hippocampal shape were analyzed together, the achieved accuracy was 87.52% (sensitivity 96.79% and specificity 63.24%).
Conclusions: In this paper, we presented a classification method based on online learning for AD diagnosis by employing both cortical thickness data and hippocampal shape analysis data. Our method was implemented on smartphone devices and discriminated AD patients for normal group.
Keywords: Alzheimer Disease, Artificial Intelligence, Classification, Mobile Health Units, Delivery of Health Care
Healthc Inform Res. 2014 January;20(1):61-68.
http://dx.doi.org/10.4258/hir.2014.20.1.61 pISSN 2093-3681 • eISSN 2093-369X
Original Article
Submitted: November 15, 2013 Revised: December 24, 2013 Accepted: January 1, 2014 Corresponding Author Joon-Kyung Seong, PhD
Department of Biomedical Engineering, Korea University, 145 Anam-ro, Seongbuk-gu, Seoul 136-701, Korea. Tel: +82-2-940- 2887, Fax: +82-2-940-2880, E-mail: [email protected]
This is an Open Access article distributed under the terms of the Creative Com- mons Attribution Non-Commercial License (http://creativecommons.org/licenses/by- nc/3.0/) which permits unrestricted non-commercial use, distribution, and reproduc- tion in any medium, provided the original work is properly cited.
ⓒ 2014 The Korean Society of Medical Informatics
62 www.e-hir.org http://dx.doi.org/10.4258/hir.2014.20.1.61 dementia among the elderly population will reach 1.14 mil-
lion by 2030. Among degenerative brain diseases that cause dementia, Alzheimer disease (AD) is the most common, and the occurrence rate doubles every 5 years [3,4]. As life expectancy increases, the number of AD patients increases.
Therefore, early detection of AD patients is becoming more important.
For an accurate classification, it is essential to choose eli- gible features which clearly represent group differences. Re- cently, there was a report that a structural change can be ob- served in human brains a few years before any symptomatic awareness [5]. Therefore, this structural change is important for the detection of AD. Several classification methods based on cortical thickness data have been reported [6,7]. Subcor- tical structures, such as hippocampi and certain regions of gray matter, are substantially more vulnerable in AD. Some studies have utilized hippocampal volumes or hippocampal shapes for AD classification [8,9]. Therefore, we adopt corti- cal thickness data and hippocampus shape deformity for AD
classification.
Incremental learning-based versions of statistical tech- niques, such as principal component analysis (PCA) and linear discriminant analysis (LDA), have been reported. Hall et al. [10] proposed an incremental PCA method which up- dates the PCA transformation matrix sequentially with each of the additional training data. Pang et al. [11] proposed an incremental LDA scheme which can handle large amounts of training data. Cho et al. [12] proposed the incremental learning based on PCA and LDA. They showed that classifi- cation accuracy increases incrementally with additional data.
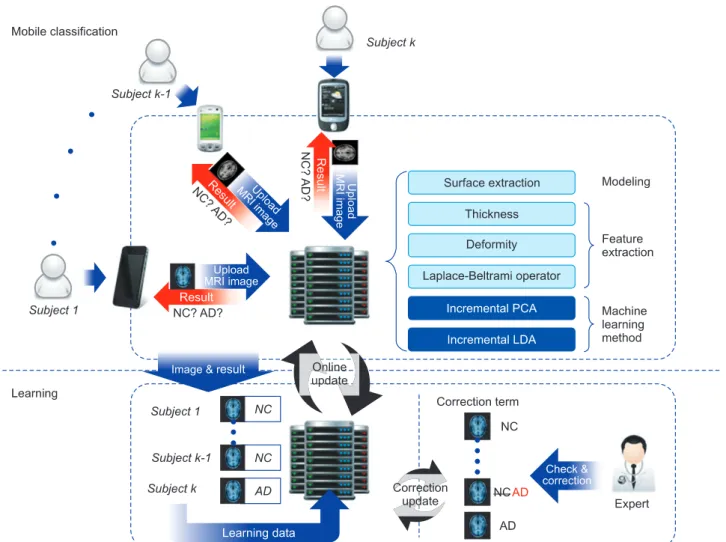
Figure 1. Overview of the proposed method. AD: Alzheimer disease group, NC: normal control group, PCA: principal component analy- sis, LDA: linear discriminant analysis, MRI: magnetic resonance image.
Table 1. Demographic characteristics of normal controls (NC) and patients with Alzheimer disease (AD)
Characteristic NC (n = 84) AD (n = 33)
Age (yr) 74.0 ± 4.5 76.2 ± 8.4
Sex (male:female) 49:36 14:19
63
Vol. 20 • No. 1 • January 2014 www.e-hir.org
Online Learning for Classification of AD The purpose of this study was to identify AD patients us-
ing magnetic resonance imaging in the mobile environment.
We performed online classification for AD diagnosis and AD prediction by using the smartphone. Our classification method is based on incremental learning for AD diagnosis and AD prediction using the cortical thickness data and hippocampus shape. We constructed a classifier based on PCA and LDA [13]. Specifically, whenever a new data set is obtained, our classification method will train the classifier incrementally with the newly obtained data set. There are two main stages in our method, the initial learning part and the online learning part. We first performed initial learning.
This process trains a group classifier with labeled MR vol- umes. We performed the mobile classification step in which unlabeled subjects are classified.
II. Methods
1. Data Acquisition and Image Processing
To analyze cortical thickness and hippocampal shape in degenerative human brain diseases, we chose a group of 117 subjects, including 84 healthy controls and 33 AD pa- tients. The subjects underwent high-resolution T1-weighted volume magnetic resonance imaging at the Seoul National University Bundang Hospital, Seongnam, Korea. Table 1 presents the demographic characteristics of the participants.
The T1 images of each subject were processed to extract the cortical surface using the FreeSurfer pipeline [14,15]. This surface modeling pipeline includes several steps: removal of non-brain tissue [16], Talairach alignment, tissue segmenta- tion, intensity normalization [17], tessellation of boundaries between the gray and white matter, automated topology cor- rection [18,19], and surface deformation based on intensity gradients [14]. Once the cortical meshes were reconstructed, they were automatically parcellated into anatomical regions based on lobar and cortical folding structure. In addition to the cortical surface extraction, we constructed the hippo- campal surface by employing the in-house software package.
2. Overview
Here, we present an incremental classification method for AD diagnosis and AD prediction using cortical thickness and hippocampal shape analysis data. Figure 1 shows the overall structure of the proposed method. It comprises two parts: initial learning and mobile subject classification. In the first step, the classifier is trained with labeled MR volumes.
We extract cortical thickness data and hippocampus from the MR volumes. Then, to remove noise, we filter out high frequency components from the cortical thickness data and
hippocampus at vertices, and train the classifier with the re- sulting data. In the latter part, we classify unlabeled subjects based on the training. We construct its feature vector repre- senting the noise-filtered cortical thickness data and hippo- campal shape by using our initial classifier training.
3. Initial Learning
First, we construct a feature vector from an MR volume. To achieve a high classification performance, a feature vector should reflect group differences. It should also be compact to achieve computational efficiency. To construct the feature vector, we extract the cortical thickness data and hippocam- pal shape deformity, after which, we perform noise removal.
Next, we perform initial learning. We train the classi- fier with the feature vectors obtained from a set of labeled subjects. Our classification is based on PCA and LDA [20- 22]. Given feature vectors, xi, 1 ≤ i ≤ N belong to one V of two groups, normal control and AD, our group classifier is trained by performing PCA and LDA. We derived the fol- lowing covariance matrix of the training data set X = {xi, ···, xn}:
∑
∑ ∑
′
∑ ∑
, where x-is the mean of all feature vectors.
Given the PCA transformation matrix, Wp, a feature vec- tor x in the feature space is converted to a vector y in a PCA space spanned by the column vectors of Wp as follows:
y = WTp x.
Then, we conduct LDA with the training data set Y. LDA finds the coordinate axes which maximally separate the groups of the data set. LDA maximizes the between-classes variance of Y across the groups and minimizes the within- class variance for each group. LDA finds an axis w that maxi- mizes the following energy function [23]:
∑
∑ ∑
′
∑ ∑
,
where sbetween(w) denotes between-classes variance, and sbetween(w) denotes within-class variance. They are projected onto the axis w. The between-classes scatter matrix SB and the within-class scatter matrix SW are defined as
∑
∑
∑
′
,
∑
∑ ∑
′
.
64 www.e-hir.org Ga-Young Lee et al
http://dx.doi.org/10.4258/hir.2014.20.1.61 An input data y from the PCA sub-space is mapped onto
the LDA space as
z = WTL y,
where the matrix WL is the LDA transformation matrix.
4. Mobile Classification
Once the classifier is trained with the labeled MR volumes in the server, we classify each subject’s MR volume by employ- ing the mobile classification method. Note that the mobile classification method is implemented on the smartphone device (see Section II-6 for details).
We performed PCA and LDA in sequence to transform the feature vector x of the subject to a point z in the LDA space:
z = WTLWTp x,
where WTp and WTL are given as defined in the initial learning section. Our new classifier maps the subject onto one of the groups when z is given in the LDA space.
5. Online Learning
After an unlabeled subject is classified, its result is validated by a clinician. It is time-consuming to train the classifier with the entire training data whenever new training data are added. Therefore, the initial learning method is modified to train a mobile classifier. In other words, the mobile classifier is trained incrementally without using the previously used training data; thus, the time efficiency is dependent only on the size of the new data.
To update Wp, we modify x- (mean vector) and the covari- ance matrix V. Then, we acquired the new PCA matrix [24].
The new mean x- is computed from the old mean x- as,
∑
∑ ∑
′
∑ ∑
. The new covariance matrix V' is
∑
∑ ∑
′
∑
∑
.
We refer the other reports for enhanced the computational efficiency for incremental PCA [10,24,25].
To compute the LDA transformation matrix WL, we employ an incremental LDA method [11]. This method incremental- ly computes the between- and within-class scatter matrices in the feature space and then maps the results onto the PCA subspace to finally compute WL.
We describe how to convert SXW in the feature space SW to in the PCA subspace using the PCA transformation matrix Wp:
∑
∑ ∑
′
∑ ∑
,
where xik is the kth feature vector in the group Gi. Also, SXB can be converted into SB:
SB = WTpSXBWp. 6. Mobile Implementation
A platform comprises three main components, namely, a health avatar, broker, and agent. A health avatar is a user cli- ent system. The avatar system was implemented on a iPhone 5 (iOS 7.04) with the dual-core 1.3 GHz Swift CPU with 1 GB memory. A broker is a monitoring system which moni- tors a patient’s personal information and communication history. Our mobile classifier processes the patient’s data in our server. The classification result is sent to an agent. Final- ly, the agent processes the patient’s acquired ID, gender, age, and brain data from the broker.
III. Results
We first used the cortical thickness data as a feature vector.
Then, we used the combination of the cortical thickness data and hippocampal shape deformity as a feature vector. After training the classifiers, we assessed the sensitivity of each classification with the test as follows:
Sensitivity = number of true positives
number of true positives + number of false negatives ,
Specificity = number of true negatives
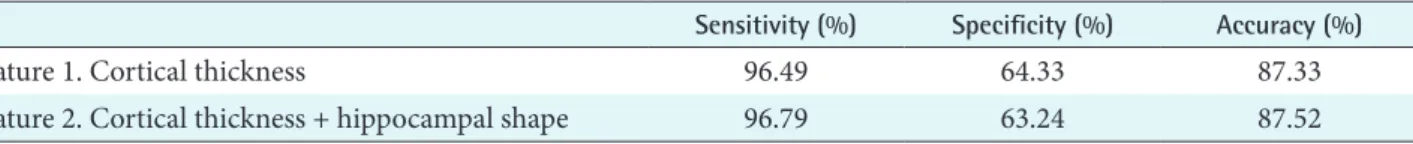
number of true negatives + number of false positives . Table 2 shows the results using two different feature vec-
Table 2. Classification accuracy for the two different features
Sensitivity (%) Specificity (%) Accuracy (%)
Feature 1. Cortical thickness 96.49 64.33 87.33
Feature 2. Cortical thickness + hippocampal shape 96.79 63.24 87.52
65
Vol. 20 • No. 1 • January 2014 www.e-hir.org
Online Learning for Classification of AD tors. Feature 1 is cortical thickness data and feature 2 is the
combination of the cortical thickness data and hippocampal shape. The sensitivity and the specificity were 94.49% and 64.33% for feature 1, and 96.79% and 63.24% for feature 2.
The accuracy was 87.33% for feature 1 and 87.52% for fea- ture 2.
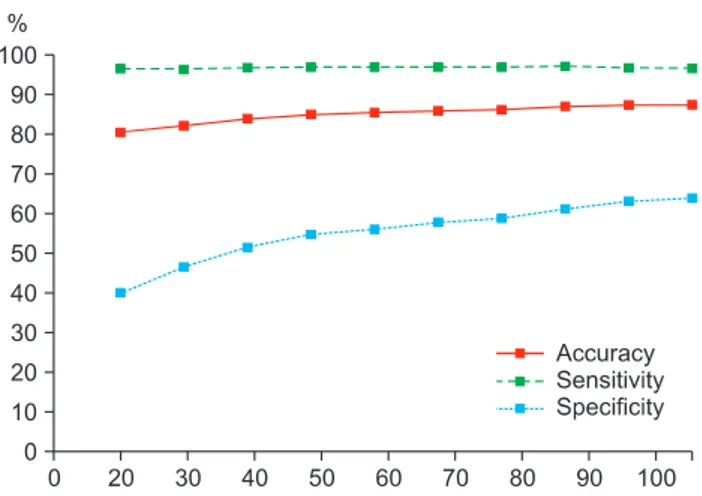
We further demonstrated the effectiveness of our incre- mental classification method. Figure 2 shows the accuracy, sensitivity, and specificity of the classifier using feature 2 (combination of the cortical thickness data and hippocam- pal shape deformity) as a feature vector. Since the values of feature 1 and feature 2 are very similar, we only show the fea- ture 2 value. As seen in the figure, accuracy, sensitivity, and
specificity tended to converge with those of the respective classifier trained with the entire training data as the number of used training patients approached those of the training patients.
Also, we extracted the cortex and hippocampus regions for our classifiers. Figure 3 depicts the discriminative regions on the atlas surface meshes for our classification.
Figure 4 is a snapshot of our agent. Our agent’s name is ‘Ades’, which is composed of ‘AD’ and ‘Descriptor’. When touching the ‘START’ button on the first screen, the patient’s gender and age are shown (Figure 4A). Then, the user touches the
‘Confirm’ button and waits for 24 hours. When the alarm
‘Ades process is over!’ appears on the smartphone screen, one can access the feature data (the cortical thickness and hip- pocampal shape deformity data in our experiments). After mobile classification, the agent system shows online learning classification result, such as patient’s distribution, severity chart and visualization (Figure 4B). The visualization part is composed of left and right cortex buttons as well as left and right hippocampus buttons. When each button is touched, one can see the patient’s corresponding feature. Figure 4C and D show the left and right cortex feature; Figure 4E and F show the left and right hippocampus feature.
IV. Discussion
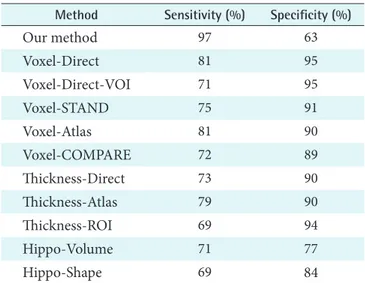
Cuingnet et al. [26] compared ten classification meth- ods: Voxel-Direct, Voxel-Direct_VOI, Voxel-Atlas, Voxel- STAND, Voxel-COMPARE, Thickness-Direct, Thickness-At- Figure 2. Accuracy, sensitivity, and specificity of classifiers using
cortical thickness and hippocampus shape.
Figure 3. Discriminative regions in classification: (A) cortex and (B) hippocampus. Each figure visualizes the linear discriminant analy- sis axes on the atlas meshes.
66 www.e-hir.org http://dx.doi.org/10.4258/hir.2014.20.1.61 las, Thickness-ROI, Hippo-Volume, and Hippo-Shape. The first five methods employed voxel-based segmented tissue probability maps. The next three methods employed cortical thickness data. Then, the last two methods used hippocam- pal features [26]. Table 3 summarizes the classification per- formance results of the ten classification methods together with those of ours. Our method achieved good sensitivity measure in classification. It was ranked in the first position;
however, the specificity of our method was lower than other classification methods.
Conflict of Interest
No potential conflict of interest relevant to this article was reported.
Table 3. Classification sensitivity and specificity comparison of eleven methods
Method Sensitivity (%) Specificity (%)
Our method 97 63
Voxel-Direct 81 95
Voxel-Direct-VOI 71 95
Voxel-STAND 75 91
Voxel-Atlas 81 90
Voxel-COMPARE 72 89
Thickness-Direct 73 90
Thickness-Atlas 79 90
Thickness-ROI 69 94
Hippo-Volume 71 77
Hippo-Shape 69 84
Figure 4. Snapshot of the agent. When the user run the agent, (A) the patient’s gender and age are shown. Then, touching the ‘Confirm’ button, (B) online learning classification results are shown. The visualization part is composed of several buttons. When each button is touched, one can see the patient’s corresponding feature; (C) left cortex, (D) right cortex, (E) left hippocampus, and (F) right hippocampus feature.
67
Vol. 20 • No. 1 • January 2014 www.e-hir.org
Online Learning for Classification of AD
Acknowledgments
This work was supported by the National Research Founda- tion of Korea grant funded by the Korean government (No.
2010-0028631).
References
1. Martinez-Perez B, de la Torre-Diez I, Lopez-Coronado M. Mobile health applications for the most prevalent conditions by the World Health Organization: review and analysis. J Med Internet Res 2013;15(6):e120.
2. Boulos MN, Wheeler S, Tavares C, Jones R. How smart- phones are changing the face of mobile and participa- tory healthcare: an overview, with example from eCAA- LYX. Biomed Eng Online 2011;10:24.
3. Jack CR Jr. Alzheimer disease: new concepts on its neu- robiology and the clinical role imaging will play. Radiol- ogy 2012;263(2):344-61.
4. Bain LJ, Jedrziewski K, Morrison-Bogorad M, Albert M, Cotman C, Hendrie H, et al. Healthy brain aging: a meeting report from the Sylvan M. Cohen Annual Re- treat of the University of Pennsylvania Institute on Ag- ing. Alzheimers Dement 2008;4(6):443-6.
5. Jack CR Jr, Knopman DS, Jagust WJ, Shaw LM, Aisen PS, Weiner MW, et al. Hypothetical model of dynamic biomarkers of the Alzheimer's pathological cascade.
Lancet Neurol 2010;9(1):119-28.
6. Desikan RS, Cabral HJ, Hess CP, Dillon WP, Glaston- bury CM, Weiner MW, et al. Automated MRI measures identify individuals with mild cognitive impairment and Alzheimer's disease. Brain 2009;132(Pt 8):2048-57.
7. Querbes O, Aubry F, Pariente J, Lotterie JA, Demonet JF, Duret V, et al. Early diagnosis of Alzheimer's disease us- ing cortical thickness: impact of cognitive reserve. Brain 2009;132(Pt 8):2036-47.
8. Colliot O, Chetelat G, Chupin M, Desgranges B, Magnin B, Benali H, et al. Discrimination between Alzheimer disease, mild cognitive impairment, and normal aging by using automated segmentation of the hippocampus.
Radiology 2008;248(1):194-201.
9. Gerardin E, Chetelat G, Chupin M, Cuingnet R, Des- granges B, Kim HS, et al. Multidimensional classifica- tion of hippocampal shape features discriminates Al- zheimer's disease and mild cognitive impairment from normal aging. Neuroimage 2009;47(4):1476-86.
10. Hall PM, Marchall D, Martin RR. Incremental eigena- nalysis for classification. Cardiff, UK: Department of Computer Science, University of Wales; 1998.
11. Pang S, Ozawa S, Kasabov N. Incremental linear dis- criminant analysis for classification of data streams. IEEE Trans Syst Man Cybern B Cybern 2005;35(5):905-14.
12. Cho Y, Seong JK, Jeong Y, Shin SY; Alzheimer's Disease Neuroimaging Initiative. Individual subject classifica- tion for Alzheimer's disease based on incremental learn- ing using a spatial frequency representation of cortical thickness data. Neuroimage 2012;59(3):2217-30.
13. Zhao W, Chellappa R, Phillips PJ, Rosenfeld A. Face recognition: a literature survey. ACM Comput Surv 2003;35(4):399-458.
14. Dale AM, Fischl B, Sereno MI. Cortical surface-based analysis: I. Segmentation and surface reconstruction.
Neuroimage 1999;9(2):179-94.
15. Fischl B, Sereno MI, Dale AM. Cortical surface-based analysis: II. Inflation, flattening, and a surface-based co- ordinate system. Neuroimage 1999;9(2):195-207.
16. Segonne F, Dale AM, Busa E, Glessner M, Salat D, Hahn HK, et al. A hybrid approach to the skull stripping prob- lem in MRI. Neuroimage 2004;22(3):1060-75.
17. Sled JG, Zijdenbos AP, Evans AC. A nonparametric method for automatic correction of intensity non- uniformity in MRI data. IEEE Trans Med Imaging 1998;17(1):87-97.
18. Fischl B, Liu A, Dale AM. Automated manifold surgery:
constructing geometrically accurate and topologically correct models of the human cerebral cortex. IEEE Trans Med Imaging 2001;20(1):70-80.
19. Segonne F, Pacheco J, Fischl B. Geometrically accurate topology-correction of cortical surfaces using nonseparat- ing loops. IEEE Trans Med Imaging 2007;26(4):518-29.
20. Belhumeur PN, Hespanha JP, Kriegman D. Eigenfaces vs. fisherfaces: recognition using class specific lin- ear projection. IEEE Trans Pattern Anal Mach Intell 1997;19(7):711-20.
21. Liu C, Wechsler H. Robust coding schemes for indexing and retrieval from large face databases. IEEE Trans Im- age Process 2000;9(1):132-7.
22. Yu H, Yang J. A direct LDA algorithm for high-dimen- sional data: with application to face recognition. Pattern Recognit 2001;34(10):2067-70.
23. Balakrishnama S, Ganapathiraju A. Linear discriminant analysis: a brief tutorial. Mississippi State (MS): Institute for Signal and information Processing, Mississippi State University; 1998.
24. Lim J, Ross D, Lin RS, Yang MH. Incremental learning for visual tracking. In: Advances in neural information processing systems 17. Cambridge (MA): MIT Press;
2004. p. 793-800.
68 www.e-hir.org http://dx.doi.org/10.4258/hir.2014.20.1.61 25. Hall PM, Marshall D, Martin RR. Adding and sub-
tracting eigenspaces with eigenvalue decomposition and singular value decomposition. Image Vis Comput 2002;20(13):1009-16.
26. Cuingnet R, Gerardin E, Tessieras J, Auzias G, Lehericy
S, Habert MO, et al. Automatic classification of patients with Alzheimer's disease from structural MRI: a com- parison of ten methods using the ADNI database. Neu- roimage 2011;56(2):766-81.