INTRODUCTION
Gabapentin (GBP, 1-aminomethyl-1-cyclohexylacetic acid) has been available since December, 1993 with the indication for use as new adjunctive antiepileptic drug for treatment of complex partial seizures.1∼5) Efficacy of GBP as an adjunctive or single agent was established in several controlled clinical trials in adults and children with refractory partial seizures.1∼8) GBP has a similar chemical structure of the inhibitory neu-
rotransmitter γ-aminobutyric acid (GABA) and shown active transport across the brain-blood barrier and the gut via the L-system amino acid transporter, which recognizes L-isoleucine, L-leucine, L-phenylalanine and L-valine.9,10)Although GBP was designed to potentiate GABA at neuronal receptors, it does not work at either GABAAor GABABreceptors. It interacts with specific high-affinity binding site that is an auxiliary protein subunit of voltage-gated calcium channels. GBP also causes a dose-dependent non-synaptic release and neuronal synthesis of GABA from glutamate in the brain. It may decrease the
책임저자:강주섭, ꂕ 133-791, 서울시 성동구 행당동 17 한양대학교 의과대학 약리학교실 및 임상약리실험실 Tel: 02-2220-0652, Fax: 02-2292-6686
E-mail: [email protected]
접수일:2007년 2월 13일, 게재승인일:2007년 3월 7일
Correspondence to:Ju-Seop Kang
Department of Pharmacology & Clinical Pharmacology Laboratory, College of Medicine, Hanyang University, 17, Haengdang-dong, Seong- dong-gu, Seoul 133-791, Korea
Tel: +82-2-2220-0652, Fax: +82-2-2292-6686 E-mail: [email protected]
High-Throughput Analytic Method Development for Gabapentin in Human Plasma by LC Coupled with Tandem Mass Spectrometry for Pharmacokinetic Studies
Jin-Hee Park1, Su-Jin Lim1, Jung-Sik Lee1, Song-Hee Park1, Hee-Kyung Seo1, Min-Ho Lee2, Ok-Hwa Jhee3 and Ju-Seop Kang1
1Department of Pharmacology and Institute of Biomedical Sciences, College of Medicine, Department of Bioengineering, Hanyang University, 2Department of Internal Medicine, College of Medicine, Hanyang University, Seoul 133-791,
3Department of Practical Arts Education, Gongju National University of Education, Gongju 314-711, Korea A simple, sensitive and validated liquid chromatography coupled with tandem mass spectrometry (LC-MS/MS) for gabapentin (GBP) in human plasma has been developed for pharmacokinetic (PK) studies. In a single-dose PK study of GBP in normal 24 subjects were given single oral doses of 300 mg GBP after fasting 12 hours. Plasma samples were drawn predose and then serially at 13 times after dose for 36 hours and plasma GBP were analyzed by deveopled LC-MS/MS. The procedures involves a simple protein precipitation with acetonitrile (ACN) and separated by LC equipped with C18 column using ACN: 10 mM ammonium acetate (20:80, v/v, pH adjusted to 3.2 with acetic acid) as mobile phase.
The GBP and α-aminocyclohexane propionic acid hydrate (IS, internal standard) were analyzed by API 2000 MS/MS in the multiple-reaction monitoring (MRM) mode. The MS/MS analysis was optimized using ESI (+) and selectivity with ionization as m/z 154.0 for GBP and m/z 126.0 for IS that fully separated during a 4.0-min run time. The accuracy and precision were met the analytical method validation criteria for concentrations over the standard ranges. The calibration curve was linear over a working range of 20(LLOQ) - 5,000 ng/ml and no interfering endogenous compounds with the analysis.
This LC-MS/MS method was successfully applied for the GBP PK studies after single oral dosing of 300 mg of GBP in 24 Korean healthy subjects. (Cancer Prev Res 12, 41-50, 2007)
Key Words: LC-Tandem mass spectrometry (LC-MS/MS), Gabapentin, Pharmacokinetic study
41
concentrations of glutamate and it inhibits the Na+ channel by mechanisms different from phenytoin and carbamazepines.10) Several cellular actions have been described but are likely related to multiple concentration-dependent actions resulting in seizure control.11) Although GBP is a drug that widely used to due to its antiepileptic and antinociceptive properties, its bioavailability may vary greatly inter- and intra-subjects because of its particular active intestinal absorption and renal excretion of unchanged drug.12∼14) In human, GBP is eli- minated exclusively by renal excretion of unchanged form, and plasma protein binding is negligible.12) Renal clearance is similar to GFR, indicating that no net renal secretion or reabsorption occur.15) Of clinical interest, GBP displays dose- dependent absorption, with systemic bioavailability decreasing with increasing doses. The mechanism underlying this pheno- menon appears to involve an active and saturable transport mechanism.12) In clinical trails, plasma GBP concentrations increase with increasing dose but increments were not linear.
Bioavailability following single doses in healthy subjects is about 57% at 300 mg and 42% at 600 mg16) and is dose- dependent, probably because of saturation of the transporter capacity.12) Although the average bioavailability of a 600 mg oral dose of GBP was 49%, individual subjects may vary greatly from 5% to 74%.14)A dose-response pattern is apparent for plasma GBP concentrations and for clinical effects within the dosage range of 600∼1,800 mg/kg. Seizure control has not been seen with trough levels below 2 mg/L. In control of chronic pain and addictions, higher trough levels of 15∼30 mg/L are maintained. GBP does not have a drug-drug phar- macokinetic interaction with other anticonvulsant drugs.17)The clinical implication is that usual doses are likely to result in quite different plasma concentrations in individual patients depended on age, dose and renal functions.14,18) These obser- vations suggest a role for plasma drug monitoring by with the objective of assessing either efficacy or toxicity of GBP in various clinical situations.
Several analytical methods have been reported for quantifi- cation of GBP in biological fluids. Because GBP exhibits essentially no ultraviolet (UV) absorbance, its detection processes have traditionally involved a derivatization step. Several types of analytic method are based on high-performance liquid chro- matography (HPLC) coupled UV19,20) or FLD detection21∼23); gas chromatography (GC) with FID24,25)or mass spectrometry (MS) detection26)and capillary electrophoresis (CE).27)Recently,
a sensitive method for GBP in serum or plasma using GC- tandem mass spectrometry (MS/MS)28) or LC-MS/MS29∼31) are reported. The HPLC and CE methods need derivatization of GBP to produce a chromophore, detectable by UV or FLD detection. The GC methods require derivatization of GBP to improve the volatility and avoid column interactions. Generally, for routine analysis of large scales, the derivatization step needs long-run time and more cost for sample preparations and analysis. Because of zwitterionic characteristic of GBP, it is extremely difficult to extract it from biological samples. Thus, using conventional HPLC, GC, or CE, long sample extraction procedures such as multi-step liquid-liquid to multi-step solid-phase extractions are required. LC-MS/.MS is becoming common for quantification of drugs in biological samples, owing to the improved sensitivity and selectivity of this method.29,32∼34) LC-MS/MS can be provide direct detection of GBP in biological samples since it requires simple sample preparation without derivatization of GBP. Several reports demonstrated an LC-MS/MS method for the quantification of GBP in human plasma using various internal standard (IS) such as 1,1-cyclohexane diacetic acid monoamide,29) acetaminophen (30) and (S)-(+)-α-amino-cyclohexanepropionic acid hydrate (ACP).31)
The purpose of investigation was to develop the simple, selective, efficient and highly sensitive triple quadrupole MS system with an electrospray interface (ESI) for the development and validation of isocratic LC-MS/MS method in MRM mode for the high-throughput analysis of GBP in human plasma samples using its structural isomer, ACP as IS. It was essential to establish a method capable of quantifying GBP at lower concentrations below 20 ng/ml than other reports and it was expected that this method would be efficient in analyzing large scales of samples obtained for pharmacokinetic studies after therapeutic doses of GBP. The method developed here was applied to analyze GBP concentration in serial human plasma that obtained after single oral dosing of 300 mg GBP for- mulation for PK studies of GBP in 24 healthy male volunteers.
MATERIALS AND METHODS
1. Chemicals and reagents
GBP and its structural isomer, ACP (IS) were purchased from Sigma-Aldrich Co. (St. Louis, MO, USA) (Fig. 1). Ace- tonitrile (ACN) and HPLC grade methanol were purchased
from Merck Co. (Dramstadt, Germany). CH3CO2NH4 and CH3COOH were purchased from Sigma-Aldrich Co. (St. Louis, MO, USA). Ultra pure Milli-QⓇwater prepared using a Milli- pore system (Millipore, Bedford, MA, USA). All other agents and solvents were of analytical grade. Ultra pure Milli-QⓇ water prepared using a Millipore system (Millipore, Bedford, MA, USA). GBP (NeurontinTM, Pfizer Korea Co. South Korea) containing 300 mg GBP per capsule were used in this study.
2. Preparations of primary stock solution and calibration standard curves
Primary stock solutions were prepared by diluting accurately weighed quantities of GBP and IS, respectively, to a final concentration of 1.0 mg/ml in methanol and stored at -20oC until analysis. Working stock solutions of GBP were prepared at concentrations of 20∼5,000 ng/ml by serial dilution of the primary stock solution with methanol and working solution of IS (50μg/ml) was prepared by diluting the primary IS stock solution with methnol.
Calibration curves were prepared by spiking 0.1 ml of blank plasma with 0.1 ml of one of above seven non-zero calibration standards working solutions to produce the calibration curve point's equivalent to 20, 50, 100, 500, 1,000, 2,000 and 5,000 ng/ml of GBP. The quality control (QC) samples at four concentration levels [20 ng/ml (LLOQ), 100 ng/ml (low), 1,000 ng/ml (medium) and 5,000 ng/ml (high)] were prepared using a different stock solution of GBP in a similar manner to the calibration standards. Blank human plasma without IS was analyzed before spiking to ensure that no endogenous inter- ference was found at retention times of GBP and IS. The spiked plasma samples (standards and quality controls) were extracted on each analytical batch along with the unknown
samples.
3. Preparation of plasma samples
To a 0.1 ml aliquot of human plasma, 0.04 ml of IS working solution (50μg/ml of IS) and 0.3 ml of ACN were added. The sample mixture was vortex-mixed for 2 min and centrifuged at 12,000 rpm for 5 min to remove the precipitate. A 0.3 ml of aliquot of the supernatant was transferred into a glass tube and then evaporated to dryness under nitrogen in a HYPER- VAPTM HV-200 evaporator (INTERFACE Engineering Co., Seoul, South Korea) at 40oC. The residue was reconstituted in 0.2 ml of mobile phase consisting of ACN and 10 mM CH3CO2NH4(20:80, v/v, pH adjusted to 3.2 with CH3COOH) and centrifuged at 12,000 rpm for 5 min. A 5μl of aliquot was directly injected onto the LC-MS/MS system.
4. LC- MS/MS conditions and quantifications The LC system used was an Agilent 1100 series (Agilent Technologies, Inc., Palo Alto, CA) chromatography equipped with an Agilent 1100 series binary pump, autosampler (HTC PAL system, CTC analytics AG, Switzerland) and Peak Simple LC Data System (Lab Alliance Co., State College, PA, USA) with AnalystⓇ 1.4 software package (Applied Biosystems, Foster City, CA, USA). The analytical column was a Gemini C18 column (2.0×150 mm i.d., 5μm; Phonomenex Inc.
Torrance, CA, USA). The mobile phase consisted of ACN and 10 mM CH3CO2NH4 (20:80, v/v, pH adjusted to 3.2 with CH3COOH) at a flow rate of 0.2 ml/min and the injection volume was 5μl. The separation was performed at room temperature (25oC). Mass spectrometric analysis was performed using an API 2000TM mass spectrometer system (Applied Biosystems, Foster City, CA, USA) that was equipped with a turbo ESI (5,000.0 V) operating in the positive ion mode with a cross-flow counter electrode. This system was set to the multiple reaction monitoring (MRM) mode that is, selecting parent ions dissociating them and finally analyzing the daughter selective ions reaching great selectivity and sensitivity of this mode for mass analysis and detection. The strongest fragment of each compound was selected and used as Q3 ion to be monitored. Unit resolution was used for both Q1 and Q3 mass detection. The main working parameters of the mass spectrometer are summarized in Table 1. No significant inter- ferences at the retention times of GBP or IS were observed in the mass chromatograms of blank plasma under the afore- Fig. 1. Chemical structures of GABA (A; MW=103.12, γ- ami-
nobutyric acid, C4H9NO2), GBP (B; MW=171.24, 1- (amino- methyl)- cyclohexaneacetic acid, C9H17NO2) and IS (C; ACP, MW=171.24, (S)- (+)- α- aminocyclohexanepropionic acid hyd- rate, C6H11CH2CH(NH2)CO2H·xH2O).
mentioned LC-MS/MS conditions.
5. Method validation
Plasma samples were quantified using the ratio of the peak area of GBP to that of IS as the assay parameter. Calibration curves were based on peak area ratios of GBP to IS for seven calibration standards over the range of 20∼5,000 ng/ml for GBP in human plasma. Peak area ratios were plotted against GBP plasma concentrations and standard curve was determined to validate the performance of the method. The limit of detection (LOD) demonstrated that the analyte gave a signal- to-noise ratio (S/N) of 10 for differentiation from background noise was found to be 5 ng/ml. The LLOQ in the standard curve that can be measured with acceptable accuracy and precision was found to be 20 ng/ml in human plasma. Linear least-squares regression with a weighting index of 1/χ2 was performed on the peak area ratios of GBP/IS versus GBP nominal concentrations of the seven plasma standards (20, 50, 100, 500, 1,000, 2,000, and 5,000 ng/ml) in duplicate to generate a calibration curve in the form of y=Ax+B. Valida- tion of the method was conducted in accordance to the international guidelines for bioanalytical method validation.35) To evaluate linearity, plasma calibration curves were prepared and assayed on independent three days. Accuracy and precision were determined by assay of replicates of QC samples (n=5) at four concentrations such as 20 ng/ml (LLOQ, lowest), 100
ng/ml (low), 1,000 ng/ml (medium) and 5,000 ng/ml (high) on five different days. The precision determined at each concentration level should not exceed 15 % of the coefficient of variation (CV) except for the LLOQ, where it should not exceed 20% of the CV. The accuracy of the assay was defined as the deviation of mean of the replicate measurements of QCs from the theoretical values. The mean value should be within 15% of the actual value except at LLOQ, where it should not deviate by more than 20%.35,36)
6. Application of method for GBP pharmacoki- netic studies in healthy volunteers
To demonstrate the reliability of this method for the study of pharmacokinetics of GBP, it was used to determine GBP concentrations in plasma samples at 0∼36 hours after single oral administration of 300 mg GBP capsule to healthy 24 male volunteers. GBP was given to each volunteer after having obtained their informed consents before enrollment to the study. Participants had not taken medications (including OTC) 2 weeks prior to or during the study period. The study was performed according to the revised Declaration of Helsinki37) for biomedical research involving human subjects and the rules of Good Clinical Practice (GCP). Subjects were informed of the aim and risks of the study by the clinical investigator; based on this, they provided written informed consent before participating in the study. In addition, the Bioequivalence Institutional Review Board (BE-IRB) of Hanyang University Medical Center approved the protocol prior to the start of the study. Twenty four volunteers aged between 19 and 27 years (24.3±2.1 years), with body weight between 68.2 and 86.6 kg (71.8±6.7 kg) and with height between 169.7 and 183.3 cm (176.4±4.5 cm) were included in this study. The parti- cipants were non-alcoholic and free from diseases, assessed their health status by clinical evaluation such as physical examination and the following laboratory tests; albumin, alkaline phos- phatase, ALT, AST, blood glucose, creatinine, BUN, total cholesterol, protein, total bilirubin, Hb, Hct, total and differential WBC counts, routine urinalysis. During each period, the volunteers were hospitalized to the clinical pharma- cokinetic laboratory in Hanyang University Medical Center at 18:00 pm and had an evening meal before 20:00 pm. After an overnight fasting, they received a single 300 mg GBP capsule at 07:00 along with 240 ml of water. Subjects were then in the seated position for at least 1 h and then fast for Table 1. Main working parameters of tandem mass spectro-
meter
Parameters Values
Source temperature, *C 350.0
Dwell time per transition (ms) 2.0 Ion source gas (gas 1) (psi) 50.0 Ion source gas (gas 2) (psi) 50.0
Curtain gas (psi) 50.0
Collision gas (psi) 7.0
Ion spray voltage (V) 5,000.0
Entrance potential (V) 9.0 (GBP) and 8.0 (IS) Declustering potential (V) 16.0 (GBP) and 16.0 (IS) Collision energy (V) 19.0 (GBP) and 17.0 (IS) Collision cell exit potential (V) 2.0 (GBP) and 2.0 (IS)
Mode of analysis Positive
Ion transition for gabapentin (m/z) 172.0→154.0 Ion transition for IS (m/z) 172.0→126.0
4 h. A standard lunch and evening meal were provided at 4 and 10 h after dosing. Liquid consumption was allowed ad libitum after lunch except liquid that contains xanthine and acidic beverages including tea, coffee and cola. At 0, 4, 8, 12, 24, 36 h after dose, BP, HR and BT were recorded. Blood samples (8 ml) were withdrawn by indwelling catheter to heparin-containing glass tubes from a suitable antecubital vein before and at 0.5, 1, 1.5, 2, 2.5, 3, 4, 6, 8, 10, 12, 24 and 36 h postdose. The blood samples were centrifuged at 2,500 χg for 10 minutes at room temperature and plasma was stored at -70oC until analysis. The total plasma GBP concentrations were determined as the mean of duplicate samples. The maximal concentration (Cmax) and time for maximal concen- trations (Tmax) were determined by visual inspection from each subject's plasma concentration-time plots for GBP.
Other pharmacokinetic parameters were calculated as fol- lows. The area under the plasma concentration versus time curve (AUCinfinity=∫tCt·dt+Clast/λ, λ=slope of elimination phase) was calculated for the total GBP concentration (Ct) using the linear trapezoidal rule extrapolated to infinity according to a pharmacokinetic analysis Multi-Lines Fittings38) where Ctis the last measurable concentration and the last slope (λ) was obtained from the least square fitted terminal log- linear portion of the plasma concentration versus time profile.39) The total area under the first moment versus time curve (AUMCinfinity) was calculated by intergration of time (t) of first moment (Ct·t)(AUMC=∫Ct·t·dt+Cp·t/λz+Cp/λz2
).
The mean residence time (MRT) of the GBP in the body was calculated by AUMC/AUC and the slope (λz) indicates the elimination rate constant (Ke). The terminal half-life (T1/2) was calculated by 0.692/λ.40)
RESULTS AND DISCUSSION
1. LC- MS/MS optimization
Because the inherent selectivity of MS-MS method was to be beneficial in developing a selective and sensitive analytical method for trace-mixture analysis,32) it was necessary to use MS-MS detection for GBP level in plasma below reported lowest LLOQ (40 ng/ml).29)Because IS was necessary for the determination of analyst in biological samples, a stable isotope- labeled drug as IS proved to be helpful when significant matrix effect is possible for an LC-MS/MS analysis. However, there are also many problems with the use of stable isotope-labeled IS.
The major problems include inadequate isotopic purity and stability, when often imposes unfavorable on highly sensitive quantitative analysis. In other work, several compounds were tried to find a suitable IS and reported 1,1-cyclohexane diacetic acid monoamide (CAM), structurally related to GBP as best IS for GBP analysis.29) In the initial stages of our work, we finally chose a structural isomer of GBP, ACP as IS among many chemicals including CAM29) and acetoaminophen30) because it haves similarly to GBP in analytical environment.
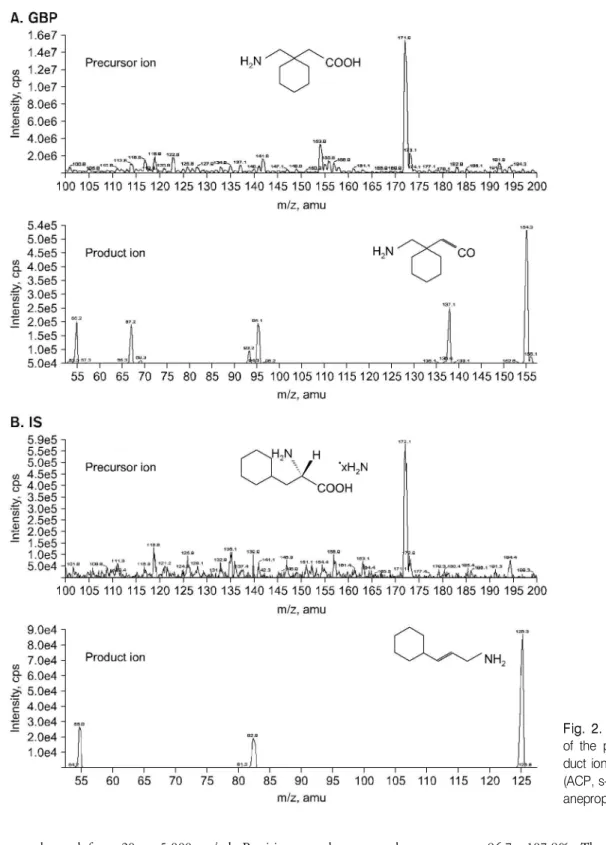
The molecular structures of GABA, GBP and IS (ACP) were shown in the Fig. 1. Although GBP and IS have the same exact monoisotopic mass (m/z 172.0), they can be detected individually since they have different fragmentation patterns.
[M+H]+ was the predominant ion in the Q1 spectrum and was used as precursor ion to obtain the product ion spectra.
The full-scan positive ion turbo ion spray product ion mass spectra showed that the precursor ions of GBP and IS were the protonated molecules, [M+H]+, of m/z 172.0 that shown in Fig. 2A and 2C. After collision-induced dissociation, the most abundant ion in the product ion mass spectrum was at m/z 154.0 for GBP at a collision energy of 19.0 eV, and m/z 126.0 for IS at a collision energy of 17.0 eV for the iden- tification and quantification in MRM mode that shown in Fig.
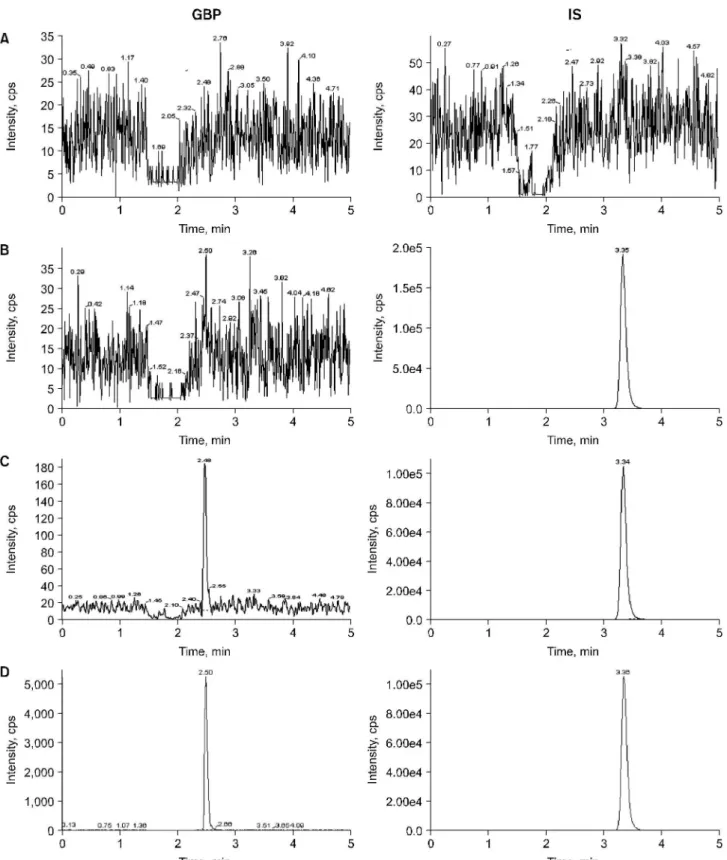
2B and 2D. The most suitable collision energy was determined by observing response obtained versus selectivity response for the fragment ion for each compound. The best collision energies set were 19.0 eV for GBP and 17.0 eV for IS ob- taining fragments m/z 154.0 and m/z 126.0 from each pro- tonated compounds. Clean MRM ion-chromatograms for GBP and IS were obtained and no significant direct interferences in the MRM channels at the relevant retention times were observed. The chromatograms of (A) blank human plasma, (B) 0.1 ml of blank plasma spiking with 40μl of IS (50μg/ml), (C) 0.1 ml of blank plasma spiking with 20 ng/ml (LLOQ) of GBP and 40μl of IS (50μg/ml), and (D) subject's plasma of 30 min after oral dose of 300 mg GBP in Fig. 3. No sig- nificant interference around retention time of GBP (2.5 min) or IS (3.36 min) in the mass chromatogram of human blank plasma under LC/MS-MS conditions was found in Fig. 3 (A, D).
2. Method validation and linearity of calibration curve
Linearity, precision and accuracy were determined to assess the performance of method. Linearity of the calibration curve
was observed from 20 to 5,000 ng/ml. Precision was deter- mined as coefficient variation, CV (%)=100 (E/T), where M is the mean, SD is the standard deviation and accuracy as the relative standard derivation, RSD (%)=100 (SD/M), T is theoretical concentration and E is the actual value. The intra- day and inter-day precision and accuracy are shown in Table 2. The intra-day precision was estimated as 0.84∼6.64% and
the accuracy as 96.7∼107.8%. The inter-day precision was estimated as 2.14∼5.51% and the accuracy as 98.2∼106.4%.
The lower limit of quantification (LLOQ) was 20 ng/ml (Fig.
3C) and defined as the lowest concentration at which both precision and accuracy were below 20% as coefficient of varia- tion.28)The calibration curves showed good linearity within the range of 20 (LLOQ) to 5,000 ng/ml as Y=4.0×10⁻⁵·X+
Fig. 2. Full- scan mass spectra of the precursor ions and pro- duct ions of (A) GBP and (B) IS (ACP, s- (+)- α- aminocyclohex- anepropionic acid hydrate).
Fig. 3. Chromatograms of (A) blank plasma, (B) with IS (50μg/ ml), (C) with GBP (LLOQ, 20 ng/ml) and IS, and (D) human plasma taken 0.5 hour after a single oral administration of 300 mg GBP spiked with IS.
3.0×10⁻³, r2=1.0 (n=8). Here, Y represents plasma concen- tration, and X describes peak area ratio.
3. Clinical application in healthy subjects The LC-MS/MS is very powerful method for pharmacokinetic studies since it provides sensitivity and selectivity requirements for analytical methods. The proposed method was applied to the quantification of GBP concentration in plasma samples for the purpose of establishing the pharmacokinetic studies after oral 300 mg GBP capsule administration in 24 healthy volun- teers. The several basic pharmacokinetic parameters for oral GBP dose obtained were described as follows. The plasma GBP levels rose rapidly after oral administration and then declined
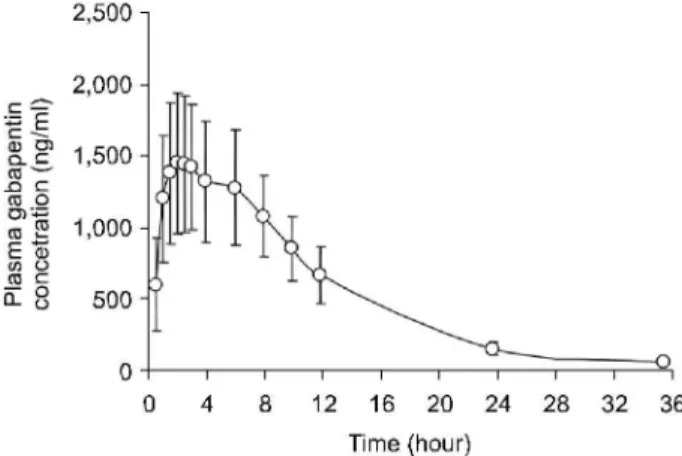
slowly. After a rapid ascent, characteristics of fast absorption, the maximal plasma concentration (Cmax) was the peak con- centration in the plasma concentration versus time profile and Tmaxwas the real time to reach the maximal concentration after oral GBP administration. The distribution and elimination of the GBP followed a one-compartment model. The mean estimated pharmacokinetic parameters derived from the plasma concentration profiles of GBP (Fig. 4) are shown in Table 3.
The mean(±SD) value of AUCt (μg·hour/ml) from time 0 to the last sampling time (36 h) was 17.39 (±3.94) and AUCinfinity from time 0 to time infinity was 17.72 (±3.99) and mean AUMC36 h (μg·h·h/ml) was 160.66 (±36.40) and AUMCinfinity was 194.41 (±43.77). The mean residence time (MRT, h) was 10.75 (±2.7). The observed maximum plasma concentration (Cmax, μg/ml) that is independent to sampling time was 1.71(±0.45) and mean time to observed maximum plasma concentration (Tmax, h) was 3.4 (±1.8) and elimination half-life (T1/2, h) was 5.3 (±0.5). The PK of GBP has been well characterized in adults.41∼43) Maximal plasma GBP concentrations occur 2∼3 h after oral dose that is similar to our results. In subject with normal renal function, GBP elimination half-life (T1/2) averages between 5 and 7 h13,41∼43) that consistent to our data.
In conclusion, we have developed a highly sensitive and specific LC-MS/MS procedure consisted of a simple plasma extraction procedure with small volume for clinical studies with lower LLOQ and total run time for analysis superior to other methods. For this method, we could successfully apply to clinical PK studies of oral 300 mg GBP capsule in 24 normal Table 2. Precision and accuracy for analysis of gabapentin in
human plasma
Precision (CV %)b Accuracy (CV %) Nominal Conc.
(ng/ml), n=5
Intra- day Inter- day Intra- day Inter- day
20 (LLOQa) 6.64 5.51 96.66 98.15
100 1.64 3.95 107.20 106.35
1,000 1.20 2.14 107.83 104.54
5,000 0.84 2.90 107.07 104.33
aLLOQ: lower limit of quantification,bCV: coefficient of variation.
Table 3. Pharmacokinetic parameters after oral 300 mg GBP administration in healthy subjects
Parameters, n=24 Mean S.D.
AUC36 hr (μg·h/ml) 17.40 3.94
AUCinfinity (μg·h/ml) 17.72 3.99
Extrapolation (%) 1.9 1.2
AUMC36 hr (μg·h·h/ml) 160.66 36.4
Aumcinfinity (μg·h·h/ml) 193.41 43.77
MRT (h) 10.75 2.7
Cmax (μg/ml) 1.71 0.45
Tmax (h) 3.4 1.8
T1/2 (h) 5.3 0.5
λz (Ke, h-1) 0.052 0.0023
AUC: area under plasma concentration- time curve, AUMC:
area under first moment of plasma concentration- time curve, MRT: mean residence time, Cmax: maximal plasma concen- tration, Tmax: time for the maximal plasma concentration, T1/2: half- life, λz (Ke): elimination rate constant.
Fig. 4. Mean (± S.D.) plasma concentrations versus time plots after oral administration of single 300 mg GBP capsule to 24 healthy male volunteers.
volunteers. A validated high-throughput LC-MS/MS system for quantification of GBP in human plasma afforded us a successful application in therapeutic drug monitoring and other clinical pharmacokinetic studies in various clinical situations.
REFERENCES
1) Walker MC, Patsalos PN. Clinical pharmacokinetics of new antiepileptic drugs. Pharmacol Ther 67, 351-384, 1995.
2) Gareri P, Gravina T. Ferreri G, De Sarro G. Treatment of epilepsy in the elderly. Prog Neurobiol 58, 389-407, 1999.
3) UK Gabapentin Study Group. Gabapentin in partial epilepsy.
Lancet 335, 114-117, 1990.
4) US Gabapentin Study Group. The long-term safety and effi- cacy of ganapentin (NeurontinⓇ) as add-on therapy in drug-resistant partial epilepsy. Epilepsy Res 18, 67-73, 1994.
5) Sivenius J, Kalviainen R, Ylinen A, Riekkinen P. Double-blind study of gabapentin in the treatment of partial seizures.
Epilepsia 32, 539-542, 1991.
6) Beydoun A, Fakhoury T, Nasreddine W, Abou-Khalil B.
Conversion to high dose gabapentin monotherapy in patients with medically refractory partial epilepsy. Epilepsia 39, 188- 193, 1998.
7) Beydoun A, Fischer J, Labar DR, Harden C, Cantrell D, Uthman BM, Sackellares JC, Abou-Khalil B, Ramsay RE, Hayes A, Greiner M, Garofalo E, Pierce M. Gabapentin monotheray: II. A 26-week, double-blind, dose-controlled, multicenter study of conversion from polytheray in outpatients with refractory complex partial or secondarily generalized seizures. The US Gabapentin Study Group. Neurology 49, 746-752, 1997.
8) Shapiro DY, Nordli D, Glauser TA , Knapp LE, Greiner M, Purcell TJ, Brigell MG, Fichtner K, Kugler AR, Malicsi M, Smith TM, Garofalo EA. Gabapentin as add-on therapy for refractory partial seizures in children 1∼36 months of age:
a novel, short-term, placebo-controlled trial. Epilepsia 41, 106, 2000.
9) Stewart BH, Kagler AR, Thompson PR, Bockbrader HN. A saturable transport mechanism in the intestinal absorption of gabapentin is the underlying cause of the lack of propor- tionality between increasing dose and drug levels in plasma.
Pharm Res 10, 276-82, 1993.
10) Taylor CP. Gabapentin: mechanisms of action. In: eds, by Levy RH Mattson RH and Melodrum BS, Antiepileptic Drugs, 4th ed. NY, Raven Press, pp 829-841, 1995.
11) McLean MJ. Gabapentin in the management of convulsive disorders. Epilepsia 40, 39-50, 1999.
12) Vollmer KO, von Hodenberg A, Kolle EU. Pharmacokinetics and metabolism of gabapentin in rat, dog and man. Arzei- mittelforschung 36, 3-12, 1983.
13) Quellet D, Bockbrader HN, Wesche DL, Shapiro DY, Garofalo E. Population pharmacokinetics of gabapentin in
infants and children. Epilepsy Res 47, 229-241, 2001.
14) Gidal BE, Radulovic LL, Kruger S, Rutecki P, Pitterle M, Bockbrader HN. Inter- and intra-subject variability in gabapentin absorption and absolute bioavailability. Epilepsy Res 40, 123-127, 2000.
15) Vollmer KO, Anhut H, Thomann P, Wagner F, Jahnchen D, Pharmacokinetic model and absolute bioavailability of the new anticonvulsant gabapentin. Adv Epileptol 17, 209-11, 1989.
16) McLean MJ, Clinical pharmacokinetics of gabapentin. Neu- rology 44, 17-22, 1994.
17) Mukesh RP, ed. Physician's Desk Reference. 5th ed. Mont- vale, NJ: Medical Economics Company, pp 2655-2658, 2002.
18) Beydoun A, Fakhoury T, Nasreddine W, Abou-Khalil B.
Conversion to high dose gabapentin monotherapy in patients with medically refractory partial epilepsy. Epilepsia 39, 188- 193, 1998.
19) Lensmeyer GL, Kempf T, Gidal B, Weibe D. Optimized method for determination of gabapentin in serum by HPLC.
Ther Drug Monit 17, 251-258, 1995.
20) Zhu Z, Neirinck L. High-performance liquid chromatographic method for the determination of gabapentin inhuman plasma.
J Chromatogr B 779, 307-312, 2002.
21) Jiang Q, Li S. Rapid high-performance liquid chromatographic determination of serum gabapentin. J Chromatogr B Biomed Sci Appl 727, 119-123, 1999.
22) Gauthier D, Gupta R. Determination of gabapentin in plasma by liquid chromatography with fluorescence detection after solid-phase extraction with a C18 column. Clin Chem 48, 2259-2261, 2002.
23) Vermeij TAC, Edelbroek PM. Simutaneous high-performance liquid chromatographic analysis of pregabalin, gabapentin and vigabatrin in human serum by precolumn derivatization with o-phtalialdehyde and fluorescence detection. J Chromatogr B 810, 297-303, 2004.
24) Hooper WD, Kavanagh MC, Dickinson RG. Determination of gabapentin in plasma and urine by capillary column gas chromatography. J Chromatogr 529, 167-174, 1990.
25) Wolf CE, Saady JJ, Poklis A. Determination of gabapentin in serum using solid-phase extraction and gas-liquid chroma- tography. J Anal Toxicol 20, 498-501, 1996.
26) Borrey DC, Godderis KO, Engelrelst VI, Bernard DR, Lang- lois MR. Quantitative determination of vigabatrin ana gaba- pentin in human serum by gas chromatography-mass chroma- tography. Clin Chim Acta 354, 147-151, 2005.
27) Chang SY, Wang FY. Determination of gabapentin in human plasma by capillary electrophoresis with laser-induced fluo- rescence detection and acetonitrile stacking technique. J Chromatogr B 799, 265-270, 1999.
28) Gambelunghe C, Mariucci G, Tantucci M, Ambrosini MV.
Gas chromatography-tandem mass spectrometry analysis of gabapentin in serum. Biomed Chromatogr 19, 63-67, 2005.
29) Ramakrishna NVS, Vishwottam KN, Koteshwara M, Manoj S, Santosh M, Chidambara J, Sumatha B, Varma DP. Rapid
quantification of gabapentin in human plasma by liquid chromatography/tandem mass spectrometry. J Pharm Biomed Anal 40, 360-368, 2006.
30) Ifa DR, Falci M, Moraes ME, Bezerra FA, Moraes MO, de Nucci G. Gabapentin quantification in human plasma by high-performance liquid chromatography coupled to electro- spray tandem mass spectrometry. Application to bioequiva- lence study. J Mass Spectrom 36, 188-194, 2001.
31) Carlsson KC, Reubsaet JLE. Sample preparation and deter- mination of gabapentin in venous and capillary blood using liquid chromatography-tandem mass spectrometry. J Pharm Biomed Anal 34, 415-423, 2004.
32) Jemal M. High-throughput quantitative bioanalysis by LC/
MS/MS. Biomed Chromatogr 14, 422-429, 2000.
33) Ramakrishna NVS, Vishwottam KN, Puran S, Manoj S, Santosh M, Koteshwara M, Chidambara J, Gopinadh B, Sumatha B. Liquid chromatography-negative ion electrospray tandem mass spectrometry method for the quantification of tacrolimus in human plasma and its bioanalytical applications.
J Chromatogr B 805, 13-20, 2004.
34) Ramakrishna NVS, Vishwottam KN, Puran S, Manoj S, Santosh M, Koteshwara M. Simple, sensitive and rapid liquid chromatographic/electrospray ionization tandem mass spectro- metric method for the quantification of lacidipine in human plasma. J Mass Spectrom 39, 824-832, 2004.
35) Shah VP, Midha KK, Findlay JW, Hill HM, Hulse JD, McGilveray IJ, McKay G, Miller KJ, Patnaik RN, Powell ML, Tonelli A, Viswanathan CT, Yacobi A. Bioanalytical method validation-a visit with a decade of progress. Pharm Res 17, 1551-1557, 2000.
36) Guidance for industry: Bioanalytical method validation. FDA, CDER, CVM, 2001.
37) Hyder AA, Human D, Crawley F, IJesselmuiden C, Singer PA, Benatar SR. Revised Declaration of Helsinki. BMJ 323, 283, 2001.
38) Yamaoka K, Tanigawara T, Nakagawa T, Uno T. A phar- macokinetic analysis program (multi) for microcomputer. J Pharmacobiodyn 4, 879-885, 1981.
39) Shargel L, Wu-Pong S, Yu A. Applied biopharmaceutics &
pharmacokinetics. 5th ed. New York, McGraw Hill, pp 161, 2005.
40) Burton ME, Shaw LM, Schentag JJ, Evans WE, Applied phar- macokinetics & pharmaco dynamics; principles of therapeutic drug monitoring. 4th ed. Philadelphia, LWW, pp 8-29, 2005.
41) MeLean MJ. Clinical pharmacokinetics of gabapentin. Neu- rology 44, 17-22, 1994.
42) Bockbrader HN. Clinical pharmacokinetics of gabapentin.
Drugs Today 31, 613-619, 1995.
43) Murphy JE. Clinical pharmacokinetics: pocket reference. 3rd ed. Bethesda, Marylamd, ASHPⓇ, pp 62-64, 2004.