The Cut-off Value of Blood Mercury Concentration in Relation to Insulin Resistance
Seok-Hoon Lee1, Beomhee Choi2, Soo-Jung Park1, Young-Sang Kim3, Nam-Seok Joo1,*
1Department of Family Practice and Community Health, Ajou University School of Medicine, Suwon; 2CHA Anti-aging Institute, CHA University, Seoul; 3Department of Family Medicine, CHA University, CHA Bundang Medical Center, Seongnam, Korea
Background: Increased blood mercury concentration is associated with inflammation, and chronic inflamma- tion can cause insulin resistance. We examined the cut-off value of blood mercury in relation to an increased score on the homeostasis model assessment for insulin resistance (HOMA-IR).
Methods: We used data from the Korean National Health and Nutrition Examination Survey (2008-2010). Rele- vant data from 5,184 subjects (2,523 men and 2,661 women) were analyzed cross-sectionally. General linear analysis was performed to evaluate the relationship between HOMA-IR score and blood mercury concentration.
In addition, we determined the cut-off value of blood mercury concentration in relation to increased HOMA-IR score (> 2.34) using an ROC curve.
Results: The mean value of blood mercury concentration in men and women was 5.88 μg/L and 4.11 μg/L, re- spectively. In men, comparing to the first quartile, HOMA-IR score increased significantly in the third and fourth blood mercury quartiles. In women, however, the increase in HOMA-IR score was not significant. The cut-off val- ue that best represented the association between increased HOMA-IR score and blood mercury concentration in men was found to be 4.71 μg/L.
Conclusion: Blood mercury concentration was associated with increased HOMA-IR score in men, and the cut-off value of blood mercury concentration that was correlated with increased HOMA-IR score was around 4.71 μg/L.
Key words: Mercury, HOMA-IR, Insulin resistance, Cut-off value, Diabetes
Received March 29, 2017 Reviewed May 18, 2017 Accepted July 4, 2017
* Corresponding author Nam-Seok Joo
http://orcid.org/0000-0001-5895-1800 Department of Family Practice and Community Health, Ajou University School of Medicine, 164 Worldcup-ro, Youngtong-gu, Suwon 16499, Korea Tel: +82-31-219-5324
Fax: +82-31-219-5218 E-mail: [email protected]
INTRODUCTION
The prevalence of type 2 diabetes is increasing. Globally, it was estimated that 415 million people aged 20-79 years had diabetes in 2015.
1People with diabetes confront numerous serious health problems, including blindness, kidney failure, cardiovascular dis- ease, premature death, cognitive decline, and amputations.
2A num- ber of lifestyle factors are known to affect development of type 2 diabetes, including lack of physical activity, obesity, a dietary shift toward more refined carbohydrates, urbanization, and stress.
3,4At the cellular level, decreased beta (β) cell function and increased in- sulin resistance are known to play a part in the pathogenesis of type
2 diabetes.
5Pancreatic β cells, which intrinsically possess low anti- oxidant enzyme activity, are vulnerable to oxidative damage.
6In- deed, oxidative stress gives rise to β cell loss
7and is known to be in- volved in diabetes.
8Blood mercury results in cellular production of reactive oxygen species and lipid peroxidation.
9Blood mercury also inhibits the ac- tivity of mitochondrial enzymes, leading to mitochondrial mem- brane depolarization and damage, which also increase the produc- tion of reactive oxygen species.
10Human exposure to mercury, es- pecially methyl mercury, occurs through various pathways, includ- ing consumption of seafood, occupational and household use of products containing mercury, and use of dental amalgams.
11In par-
Copyright © 2017 Korean Society for the Study of Obesity
This is an Open Access article distributed under the terms of the Creative Commons Attribution Non-Commercial License (http://creativecommons.org/licenses/by-nc/4.0/) which per- mits unrestricted non-commercial use, distribution, and reproduction in any medium, provided the original work is properly cited.
2017-03-16 https://crossmark-cdn.crossref.org/widget/v2.0/logos/CROSSMARK_Color_square.svg
ticular, high dietary intake of seafood is one of the most effective routes of exposure.
12The adverse health effects of mercury are a re- sult of the extent of exposure (quantity, frequency, and duration), the speciation of mercury accumulated in the body, and the age of the person.
13Unfortunately, the human body has no capability for active excretion of mercury. Therefore, mercury accumulates in the tissues of the human body.
14This accumulation is associated with chronic inflammation and the development of many diseases, such as stroke
15, hypertension, and insulin resistance.
16Therefore, in- creased mercury exposure could contribute to the pathology of dia- betes due to oxidative stress, which damages pancreatic β cells and has effects on glucose tolerance and insulin secretion.
17,18The homeostasis model assessment for insulin resistance (HOMA-IR) has been widely used to estimate the extent of insulin resistance. The cutoff value for HOMA-IR in Korean non-diabetic adults has been reported as 2.34 (sensitivity, 62.8%; specificity, 65.7%).
19Furthermore, previous studies demonstrated that blood mercury concentration was associated with HOMA-IR score in Ko- reans.
20However, the cut-off value of blood mercury concentration that enables prediction of increasing HOMA-IR score has not been established. Therefore, in this study, we tried to pinpoint the cut-off value for blood mercury concentration that has the highest sensitiv- ity and specificity for predicting an increase in HOMA-IR score.
METHODS Study data
The Korea National Health and Nutrition Examination Survey (KNHANES) is a nationwide cross-sectional health survey. Partici- pants are representatives of the Korean population. KNHANES re- sults have external validity. This study was based on data obtained from the fourth (2008 and 2009, IV-2, 3) to fifth (2010, V-1) years of the KNHANES. From an initial total of 29,235 subjects, 23,618 were excluded due to missing data on blood mercury (22,883 sub- jects), age < 19 or ≥ 70 years (10,474 subjects), type 2 diabetes (422 subjects), or an extreme blood mercury level (> 500 μg/L, one subject). Diabetes was defined as current use of anti-diabetic medications, a self-reported physician’s diagnosis of diabetes, or a fasting glucose level ≥ 126 mg/dL (6.99 mmol/L). A final total of 5,184 subjects (2,523 men and 2,661 women) were included in
this study (Fig. 1), consisting of 830 men and 885 women in 2008, 845 men and 847 women in 2009, and 848 men and 929 women in 2010, suggesting that the data are still representative of the popu- lation as a whole. All participants provided written informed con- sent to participate in the survey. The Institutional Review Board of Ajou University Hospital (Suwon, Republic of Korea) approved this study (AJIRB-MED-EXP-16-483).
Measurements
Blood mercury was measured by the Gold-Amalgam method us- ing a DMA-80 apparatus (Milestone, Italy); the inter-assay coeffi- cients of variation were 0.47-6.08%. Serum insulin concentrations were measured using an INS-Irma gamma counter with an immu- noradiometric assay (Biosource, Nivelles, Belgium), and blood glu- cose concentrations were measured using a Pureauto S GLU auto- mated analyzer with an enzymatic assay (Daiichi, Tokyo, Japan).
Insulin resistance was estimated using HOMA-IR score calculated as [fasting insulin (μIU/mL) × fasting glucose (mg/dL)]/405.
Physical examinations were performed by a trained examiner who followed a standardized procedure. Current smokers were defined
Figure 1. Flow chart of study subjects. KNHANES, Korea National Health and Nu- trition Examination Survey; YO, years old; DM, type 2 diabetes; FBG, fasting blood glucose.29,235 subjects were assessed for eligibility · KNHANES (2008-2010)
23,618 were excluded, due to · Serum mercury (-) (22,883) · Age < 19 YO or Age ≥ 70 YO (10,474)
Subjects (n= 5,607) · Men (n= 2,777) · Women (n= 2,830)
5,184 subjects were included in the analyses · Men (n= 2,523)
· Women (n= 2,661)
423 were excluded, due to · Known DM (293) · FBG ≥ 126 mg/dL (309) · Blood mercury ≥ 500 μg/L (1)
as individuals who had smoked more than five packs of cigarettes during their lifetime and were currently smoking; non-smokers had no history of smoking; past-smokers included smokers who had smoked in the past but had quit. Regular alcohol drinkers in- cluded those who currently drank alcohol more than one time per month, while nondrinkers comprised all others. Physical activity was assessed by a questionnaire and categorized as ‘yes’ or ‘no.’ A
‘yes’ indicated 30 minutes of moderate physical activity three or more times in the last week that made the subject more tired than usual. Nutrient intake including total caloric intake was assessed with a 24 hours dietary recall questionnaire administered by a trained dietician. Results were calculated using the Food Composi- tion Table developed by the National Rural Resources Develop- ment Institute (7th revision). Age at menarche was determined by a health questionnaire administered by a trained examiner. Women were classified into premenopausal, menopausal women and wom- en on hormone replacement therapy.
Statistics
Complex sample analysis was used to weight the KNHANES data following the guidance on statistics from the Korea Centers for Disease Control and Prevention. General characteristics of the study subjects were age; blood pressure; body mass index; waist cir- cumference; and metabolic markers of total cholesterol, triglyceride, high-density lipoprotein cholesterol level, fasting blood glucose, in- sulin, and blood mercury level and were analyzed by a simple de- scriptive method after data weighting. Alcohol consumption and smoking status were evaluated by the χ
2test. To evaluate the rela- tionship between blood mercury concentration and HOMA-IR score, blood mercury concentration was divided into quartiles after log transformation to create a normal distribution. Linear regression analysis was conducted in men and women after adjusting for age, physical activity, alcohol intake, smoking status, and daily total ener- gy intake. For women, we also adjusted for oral contraceptive in- take, menopause status, and hormone replacement therapy. Receiv- er operating characteristic curves and cut-off values for blood mer- cury concentrations associated with increased HOMA-IR were cal- culated. The P values were used to assess the significance of all anal- yses. Data were analyzed using SPSS 20.0 (IBM Corp., Armonk, NY, USA) to account for the complex sampling design.
RESULTS
A total of 5,184 subjects’ data were analyzed in this study. The general characteristics of the study subjects are summarized in Ta- ble 1. The mean HOMA-IR score was 2.33 for men and 2.27 for women. The mean body mass index (BMI) and waist circumfer- ence were 24.0 kg/m
2and 83.4 cm in men and 22.7 kg/m
2and 76.2 cm in women, respectively. Other respective values in men and women were as follows: average fasting blood sugar (92.7 and 90.6 mg/dL), insulin (10.1 and 10.0 µIU/mL), total cholesterol (185.4 and 184.9 mg/dL), high-density lipoprotein cholesterol (50.0 and 57.0 mg/dL), and triglyceride (149.8 and 103.2 mg/
dL). The average blood mercury level in men (5.88 μg/L) was higher than that in women (4.11 μg/L). As expected, the propor- tion of current smokers and regular alcohol consumption were higher in men than in women.
After blood mercury concentration was log-transformed, we di-
Table 1. General characteristics of the study subjectsVariables Men (n= 2,523) Women (n= 2,661) P
Age (yr) 38.7 (0.3) 40.0 (0.3) < 0.001
Height (cm) 171.4 (0.2) 158.6 (0.1) < 0.001
Weight (kg) 70.6 (0.3) 57.1 (0.2) < 0.001
BMI (kg/m2) 24.0 (0.8) 22.7 (0.8) < 0.001
WC (cm) 83.4 (0.2) 76.2 (0.2) < 0.001
SBP (mmHg) 116.0 (0.4) 110.0 (0.4) < 0.001
DBP (mmHg) 77.1 (0.3) 71.6 (0.2) < 0.001
TC (mg/dL) 185.4 (1.0) 184.9 (0.9) 0.711
TG (mg/dL) 149.8 (3.1) 103.2 (1.7) < 0.001
HDLC (mg/dL) 50.0 (0.3) 57.0 (0.3) < 0.001
FBS (mg/dL) 92.7 (0.2) 90.6 (0.2) < 0.001
Insulin (µIU/mL) 10.1 (0.1) 10.0 (0.1) 0.789
HOMA-IR 2.33 (0.1) 2.27 (0.1) 0.159
Energy (kcal/day) 2,394.0 (25.5) 1,684.8 (15.3) < 0.001 Blood mercury (μg/L) 5.88 (0.11) 4.11 (0.07) < 0.001 Smoking
Yes, n (%) 1,173 (46.5) 158 (5.9) < 0.001
Alcohol
Yes, n (%) 1,940 (76.9) 1,152 (43.3) < 0.001
Physical activity
Yes, n (%) 360 (14.3) 361 (13.6) 0.043
Values are presented as mean (standard error) after data weighting.
BMI, body mass index; WC, waist circumference; SBP, systolic blood pressure; DBP, dia- stolic blood pressure; TC, total cholesterol; TG, triglycerides; HDLC, high-density lipopro- tein cholesterol; FBS, fasting blood sugar; HOMA-IR, homeostasis model assessment for insulin resistance; Energy, total daily energy intake; Blood mercury, methyl-mercury.
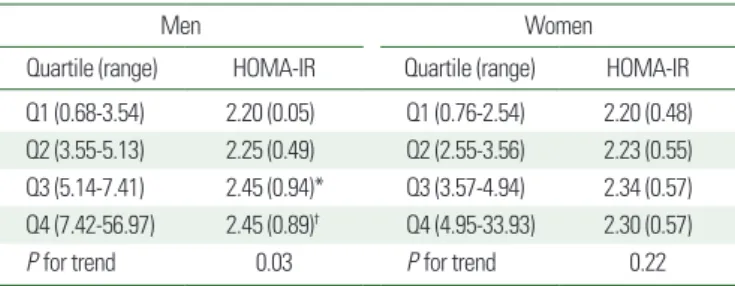
vided it into quartiles (Table 2). HOMA-IR score showed a gradu- al increase as blood mercury quartile increased in men after adjust- ing for age, moderate physical activity, smoking status, alcohol in- take, and daily total energy intake. In men, the average HOMA-IR score increased by 0.25 when the highest blood mercury quartile was compared to the lowest blood mercury quartile. In women, af- ter adjusting for covariates, there was no significant difference in HOMA-IR score between quartiles.
The area under the curve (AUC) value of mercury associated with increased HOMA-IR score in men was 0.534 (95% CI, 0.511- 0.558) (Table 3). The cut-off value of blood mercury concentra- tion corresponding to the AUC associated with an increased HOMA-IR score was 4.71 μg/L (Fig. 2).
DISCUSSION
This cross-sectional study examined blood mercury concentra- tion in relation to HOMA-IR score using KNHANES data from 2008 to 2010. In our study, we observed consistent increases in HOMA-IR score with increasing blood mercury. HOMA-IR score was significantly higher in the third and fourth quartiles of blood mercury than in the first quartile in men. A blood mercury level over 4.71 μg/L was significantly associated with a significant in- crease in HOMA-IR score; this could be a cut-off value for blood mercury concentration in Korean non-diabetic men.
Oxidative stress plays a role in the progression of pancreatic β-cell dysfunction and insulin resistance.
21Shenker et al.
22revealed
that mercury induces apoptosis in human T lymphocytes and hy- pothesized both that the target organelle is the mitochondrion and that inducing oxidative stress activates an apoptotic pathway. Their findings proposed that mercury induces oxidative stress-regulated pancreatic β-cell cytotoxicity through a mitochondrial apoptotic pathway that activates caspase-3 in response to mitochondrial re- lease of cytochrome c. Chen et al.
23showed that 2 or 4 weeks of oral exposure to low-dose mercury decreases plasma insulin level, increases plasma lipid peroxidation level, and elevates blood glu- cose and glucose intolerance. N-acetyl-l-cysteine (a ROS scaven- ger) prevented these mercury-induced responses. These findings demonstrate that mercury-induced oxidative stress and PI3K acti- vation cause Akt signaling-related pancreatic β-cell dysfunction, which indicates that oxidative stress is involved in the toxic mecha- nism in mercury-induced hyperglycemia.
In addition, several studies have revealed that blood heavy metal
Table 2. HOMA-IR score by serum logHg quartileMen Women
Quartile (range) HOMA-IR Quartile (range) HOMA-IR
Q1 (0.68-3.54) 2.20 (0.05) Q1 (0.76-2.54) 2.20 (0.48) Q2 (3.55-5.13) 2.25 (0.49) Q2 (2.55-3.56) 2.23 (0.55) Q3 (5.14-7.41) 2.45 (0.94)* Q3 (3.57-4.94) 2.34 (0.57) Q4 (7.42-56.97) 2.45 (0.89)† Q4 (4.95-33.93) 2.30 (0.57)
P for trend 0.03 P for trend 0.22
Values are presented as mean (standard error) after data weighting.
P for trend was obtained by a general linear model after adjustment for age, moderate physical activity, smoking status, alcohol intake, and total energy intake in men and fur- ther adjustment for menopausal status, intake of oral contraceptives, and hormone re- placement therapy in women.
*P< 0.05 in the comparison between Q1 and Q3.
†P< 0.05 in the comparison between Q1 and Q4.
HOMA-IR, homeostasis model assessment for insulin resistance.
Table 3. AUC and its cut-off value for blood mercury concentration according to an increase of HOMA-IR score in men
AUC (95% CI) Hg (μg/L) Sensitivity 1-Specificity P
HOMA-IR 0.534 (0.511-0.558) 4.71 0.608 0.547 0.004
Hg represents the blood mercury concentration corresponding to the cut-off value.
AUC, area under the curve; HOMA-IR, homeostasis model assessment for insulin resis- tance.
Figure 2. Receiver operating characteristic (ROC) curve of blood mercury concen- tration according to the presence of abnormal homeostasis model assessment for insulin resistance (HOMA-IR) score in men. This ROC curve shows the maximum association between blood mercury concentration (4.71 μg/L, P= 0.004) and HOMA-IR score at the point of sensitivity (0.608) and 1-specificity (0.547).
Sensitivity
1-specificity Cut-off point: 4.71 1.0
0.8
0.6
0.4
0.2
0 0.2 0.4 0.6 0.8 1.0