Vol.5,No.3,August2010.p.351~362
1)
The Effect of Water Exercise on Muscles of the Low-limbs depend on the Depth
Yeon-woo Jung, PT, PhD, Se-won Yoon, PT, PhD, Young-taek Doo, PhD Department of Physical Therapy, Kwangju Women University
수심차이에 따른 수중운동이 하지 근육에 미치는 영향
정연우ㆍ윤세원ㆍ두영택
광주여자대학교 물리치료학과
<Abstract>
연구목적:수심 깊이에 따른 수중운동이 하지근력에 미치는 영향을 알아보고자 하는데 목적이 있다.
연구방법:신경근골격계 질환이 없는 여자 10명을 대상으로 하였고, 무작위로 수심 0.7m 그룹과 1.4m 그룹으 로 배치하였다. 수중운동은 1회 40분, 주 3회 6주 동안 적용하였다. Ultrasound MyLab25(Esaote, Italy)를 이용 하여 하지근육의 우모각과 밀도를 실험전과 후에 측정하였다.
연구결과:골격근 구조의 역학적 특성을 나타내는 우모각 변화를 비교한 결과 0.7m 그룹의 오른쪽 넙다리곧
은근과 왼쪽 넙다리곧은근, 앞정강근 그리고 장딴지근에서, 1.4m 그룹의 오른쪽 앞정강근과 장딴지근, 왼쪽 넙 다리곧은근에서 통계학적으로 유의한 차이가 나타났으나(p<.05), 수심 깊이에 따른 유의한 차이는 없었다 (p>.05). 또한, 질적 특성을 나타내는 근육 영상 밀도 변화를 비교한 결과 0.7m 그룹의 오른쪽 넙다리곧은근, 장딴지근과 왼쪽 넙다리곧은근, 앞정강근, 장딴지근에서 1.4m 그룹의 양쪽 넙다리곧은근, 앞정강근, 장딴지근에 서 통계학적으로 유의한 차이가 나타났고(p<.05), 특히 1.4m 그룹에서 현저한 증가를 보였으나 수심 깊이에 따 른 유의한 차이는 없었다(p>.05).
결론:본 연구에서는 수심 차이에 관계없이 수중운동 후 근밀도와 우모각에 영향을 미치는 것을 확인할 수 있 었다.
Key Words:수중운동, 근력, 우모각, 근밀도
Ⅰ . Introduction
1. The necessity for researchRecently, because of busy life and task, modern people take exercise hardly to advance and keep up their health. As the generation entered the industrial 교신저자:정연우, E-mail: [email protected]
논문접수일:2010년06월07일 / 수정접수일:2010년08월11일 / 게재승인일:2010년08월16일
Group
t-value p
0.7m (n=5) 1.4m (n=5)
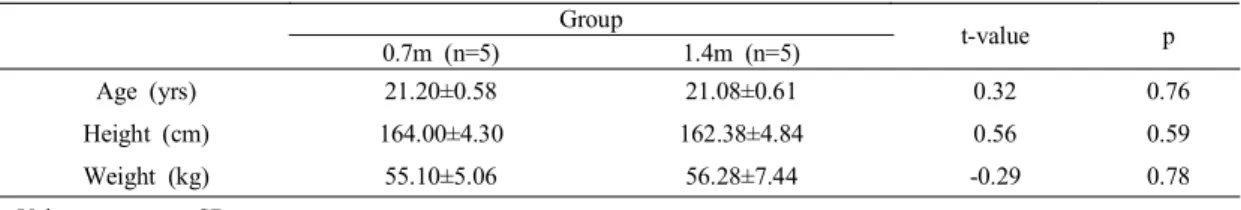
Age (yrs) 21.20±0.58 21.08±0.61 0.32 0.76
Height (cm) 164.00±4.30 162.38±4.84 0.56 0.59
Weight (kg) 55.10±5.06 56.28±7.44 -0.29 0.78
Values are mean±SD.
Table 1. General characteristics of subjects society, the range of obesity, cardiovascular disease, various musculoskeletal problems are increasing sharply because of lack of exercise. And woman get it 2~3times more than men due to weak and undeveloped muscle(Brotzman, 1996; Im, 1997). Not only these but also, the payment for medical problems increased as 0.3%, so it is regarded serious social problem(Ministry for Health, Welfare and Family affairs, 2007).
Muscles weakness is resulted from poor posture or habit. Because of spending much time to working at the office and computer operation, muscle weakness is prevalent in office workers (Jung, 2006). Muscle weakness increases the risk of back pain, damage, and the risk of falls, especially by the aging of the body, as well as degrade the overall function that causes muscle dysfunction is often the main cause of the muscle weakness(Mortell & Tucker, 1993).
Inactivates in the elderly facilities muscle weakness or promote bone density degradation(Sung et al., 2005). And to prevent muscle weakness, limited range of joint operations, joint shock limit, balance loss, and obesity, exercise is desirable to apply (Fitzsimmons et al., 1995).
Ground exercise and aquatic exercise is prevalently used for therapeutic method to compensate problems occurred by muscle weakness. Normal exercise can increase muscle strength exercise, walking, jogging, running, biking, hiking and other exercise or the exercise of high intensity exercise, which takes place on this ground with their legs to knee joint when run or jump, so the weight 2-3 times the impact of body weight is applied. Also, ground
exercise makes you tired easier. Because it make body use only one side of muscle. But, in water you can build up your hip and thigh muscles as well as other things in the same amount of times.
Ground exercise and water exercise seem to have similar dispositions and the same quality of Kinematics.
But, previous studies are not enough to explain water exercise utility due to using single method of investigation(Nakanishi et al., 1999). It is essential to study the change of the musculoskeletal system and physiological effects of long term water exercise application. Also, water temperature investigation is almost completely about factors that depends on physical changes such as cardiopulmonary function, muscle strength, balance and others things during water exercise(Fujisima et al., 2001; Hall, J. et al., 1998; Nakanishi et al., 1999). But, research about exercising in different depths of water is insufficiency.
Therefore, propose of this study to examine the water exercise which follows the depths difference affects on the muscular volume of the low-limbs.
Ⅱ . Method
1. Subject
Subjects were ten female volunteers from K University student in Kwang-Ju. This study is randomized control trials and all subjects was divided into 2 groups each 5 subject(Table 1).
Subject included non-smoking and non-drinking, recently didn't participated in regular exercise. Also,
Program Practice Method Application Time(minute) Total Warming-up The upper body and the lower body give a tension and relaxation with
each region by freely. 5
Water Walking 40 Exercise
Water WalkingⅠ The knee spreads and walks like kicking the ball.
And water flow identifies(1.4M raising hands up). 10 Intermediate
Exercise Ⅰ
Sits and does a leg dumping, to release the
muscle and the ligament. 5
Water Walking Ⅱ Equality with Water WalkingⅠ 10 Intermediate
Exercise Ⅱ Equality with Intermediate exercise Ⅰ 5 Arrangement
Motion
Becomes likewise the progress with warming-up exercise and gives a tension and relaxation with each region by freely. 5 Table 2. Water Exercise Program
didn't present symptoms of any disease(Lim et al., 2007). Exclusion criteria included contraindications on water exercise; heart disease, mental illness and light sense illness(Rho et al., 2005). The subjects who have an infectious dermatopathy and wrong with cardiopulmonary and having a preceding disease or taking a medicine were also excluded(Lee, 1998).
2. Experimental Process
1) Water exercise program
A water exercise programs performed walking exercise in water at a depth of 0.7m(about depth of the hip) and 1.4m(about depth of the chest), during the experiment, the period has maintained the same 5-6 p.m.
Water walking program was conducted 3 times a week for six weeks, 0.7m standard height of a pool of 7*15m(width*height), and 1.4m in height 13*
25m(width*height) was, water temperature is 29°, maintain the interior temperature was 30°. Before implementing a program to prevent injuries by warm-up stretching exercises performed 5-10 minutes to prepare, including the primary muscle group were performed static exercise(Seoul University, Exercise Physiology Lab, 1989).
Conducted this exercise after 30 minutes to walk
to the water, prepared by the same exercise and stretching exercises 5 minutes was conducted, configuration has a total 40 minutes(Table 2).
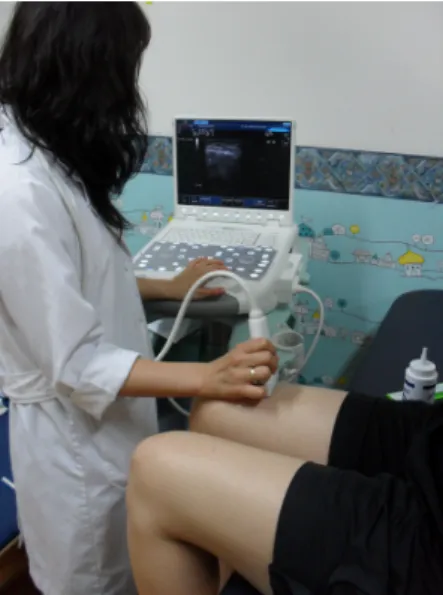
3. Measurement
We used Ultrasound MyLab25(Esaote, Italy) for gathering ultrasonic images to measure skeletal muscle architecture. This machine's Frequency Range is 12MHz. As well as, dynamic Range(13) and Density(High) are fixed price in all kind of test.
Then, we used Image Pro Plus 4.5(Media Cybernetics, USA) program for analysis of gathering images and measured that pre and post experiment each.
1) Measurement of rectus femoris
We measured the rectus femoris above 10cm from patella base by sitting position keeping flexion 90° knee. We are marked by oil-based pen to make sure measurement about same part before start the test(Fig. 1).
Pennation angle means a angle made by fascicles and deep aponeurosis(Kawakami et al., 1998). In this study, we measured images what gathering from muscle's sagittal plane. We measured pennation angle by fascicles in deep aponeurosis(Lee, 2007).
Density means average pixel value in a sphere
Fig. 1. Measurement of rectus femoris
Fig. 2. Measurement of tibialis anterior
Fig. 3. Measurement of gastrocnemius
echogenicity image by saved digital(Maurits et al., 2003). This experimentation, we got average pixel value in a circle sphere except aponeurosis after we obtain images from transverse plane of muscle. And we called it density. Pixel value is from 0 till 255.
The 0 means pure black and density's increase. As well as, the 255 means pure white and density's decrease.
2) Measurement of tibialis anterior
We measured below 10cm from patella base by
sitting position keeping flexion 90° knee. We are marked by oil-based pen to make sure measurement about same part before start the test(Fig. 2).
3) Measurement of gastrocnemius
We measured 13cm below from fossa posterior which between knee joint and condyle keeping prone position putting ankle joint on the edge of table. We are marked by oil-based pen to make sure measurement about same part before start the test(Fig. 3).
4. Statistical analyses
All data analyzed by using the SPSS version 12.0 statistical programs. The single- sample Kolmogorov-Smirnov test was conducted for find out normal distribution whether of general characteristics of subjects and each measurement items. The result has been recognized normal distribution, general characteristics of subjects for the group differences between independent sample test were analyzed.
Take the paired T-test for comparing to the angle and density from pre and post experimentation, take the dependent T-test for comparing to the average difference between groups. The post test was compared between groups of effect using ANCOVA test and the significance level was assumed 0.05.
Group Muscle Period (M±SE)
t-value p
Pre Post
0.7m(n=5)
RF 2.56±0.50 4.97±0.23 -4.34 0.01*
TA 1.69±0.41 3.09±0.69 -1.96 0.12
GA 8.25±1.99 8.84±1.58 -0.45 0.67
1.4m(n=5)
RF 3.85±0.39 5.38±0.87 -1.55 0.20
TA 1.87±0.69 3.87±1.01 -3.29 0.03*
GA 6.08±0.66 8.94±1.43 -2.89 0.05*
Values are mean±SE.
M : mean SE : standard error RF : rectus femoris TA : tibialis anterior GA : gastrocnemius *p<.05
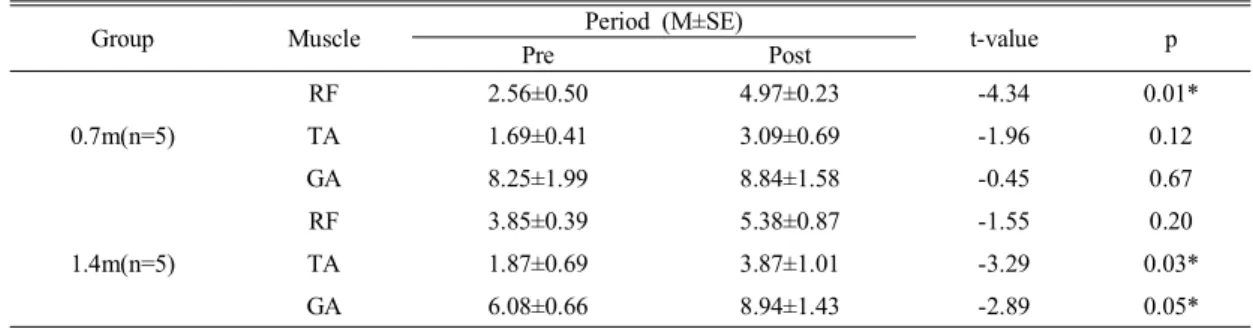
Table 3. Period t-test of pennation angle of right lower limbs within each group (°)
Fig. 4. Comparison of pennation angle at right lower limbs
Ⅲ. Result
1. Effects of the water exercise program on pennation angle
1) Comparison of pennation angle at right lower limbs
we compared water exercise before and after each group, before water exercise rectus femoris pennation angle was 2.56±0.50 in 0.7m depth and there were significant difference 4.97±0.23 by statistical after water exercise(p<.05). tibialis anterior and gastrocnemius pennation angle was increased, however there was no significant difference(p>.05).
Before water exercise tibialis anterior pennation angle was 1.87±0.69 in 1.4m depth and there were significant difference 3.87±1.01 by Statistical after water exercise(p<.05). Also, before water exercise gastrocnemius pennation angle was 6.08±0.66and there were significant difference 8.94±1.43 by statistical after water exercise(p<.05). rectus femoris pennation angle was increased, however there was no significant difference (p>.05)(Table 3)(Figure 4).
After we compared water exercise between groups,
all Ractus femoris, tibialis anterior and gastrocnemius more increase an average, however there was no significant difference(p>.05).
2) Comparison of pennation angle at left lower limbs
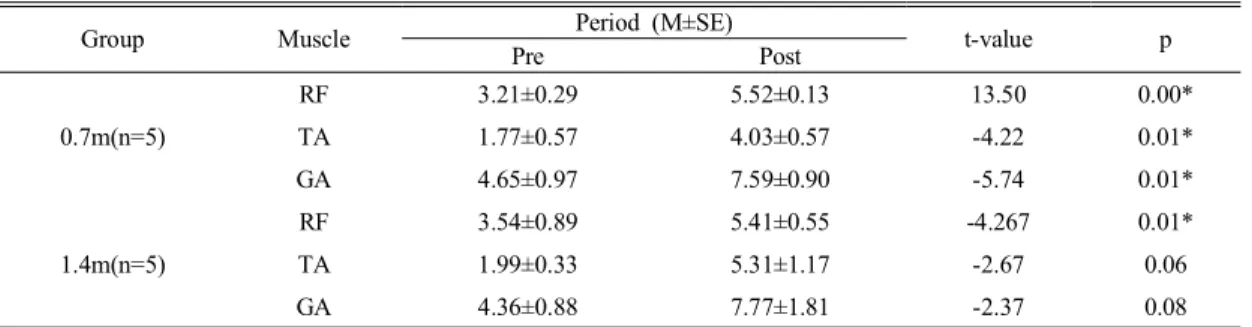
After we compared water exercise before and after each group, before water exercise rectus femoris pennation angle was 3.21±0.29 in 0.7m depth and there were significant difference 5.52±0.13 by statistical after water exercise(p<.05). Also, before water exercise tibialis anterior pennation angle was 1.77±0.57 and there were significant difference 4.03±0.57 by statistical after water exercise(p<.05).
Group Muscle Period (M±SE)
t-value p
Pre Post
0.7m(n=5)
RF 3.21±0.29 5.52±0.13 13.50 0.00*
TA 1.77±0.57 4.03±0.57 -4.22 0.01*
GA 4.65±0.97 7.59±0.90 -5.74 0.01*
1.4m(n=5)
RF 3.54±0.89 5.41±0.55 -4.267 0.01*
TA 1.99±0.33 5.31±1.17 -2.67 0.06
GA 4.36±0.88 7.77±1.81 -2.37 0.08
Values are mean±SE.
*p<.05
Table 4. Period t-test pennation angle of left lower limbs within each group (°)
Muscle Group Post t-value p
RF 0.7m 5.52±0.13
0.17 0.04*
1.4m 5.41±0.55
TA 0.7m 4.03±0.57
-0.99 0.07
1.4m 5.31±1.17
GA 0.7m 7.59±0.90
-0.09 0.37
1.4m 7.77±1.81
Values are mean±SE.
*p<.05
Table 5. Independent t-test of pennation angle of left lower limbs between groups (°)
Fig. 5. Comparison of pennation angle of left lower limbs
As well as, gastrocnemius pennation angle was 4.65±0.97 before water exercise and there were significant difference 7.59±0.90 by statistical after water exercise(p<.05). Before water exercise rectus femoris pennation angle was 3.54±0.89 in 1.4m depth and there were significant difference 5.41±
0.55 by Statistical after water exercise(p<.05). tibialis
anterior and gastrocnemius pennation angle was increased, however there was no significant difference (p>.05) (Table 4)(Fig. 5).
After we compared water exercise between groups, Ractus femoris pennation angle was significant difference 4.97±0.23 in 0.7m and 5.38±0.87 in 1.4m(p<.05). tibialis anterior and gastrocnemius more increase an average, however there was no significant difference(p>.05)(Table 5)(Fig. 5).
We analyze covariance to improve average difference in Ractus femoris. The analysis showed that there was no significant difference by water depth(p>.05).
2. Effects of the water exercise program on density
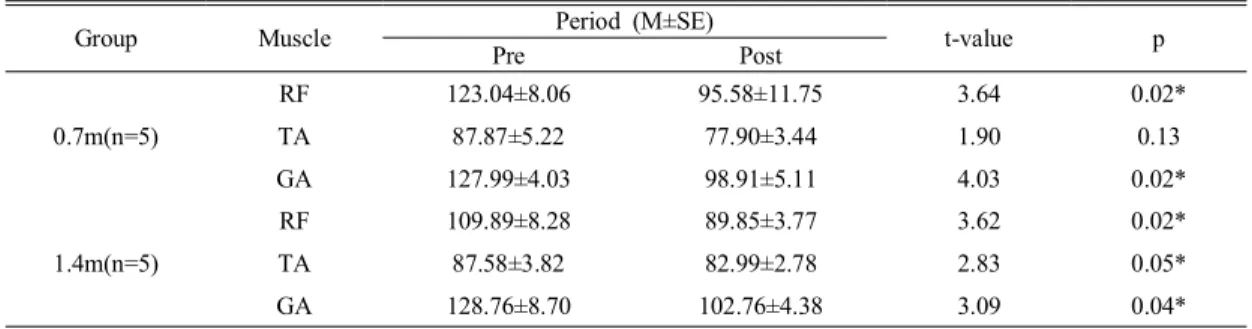
1) Comparison of density at right the lower limbs
Group Muscle Period (M±SE)
t-value p
Pre Post
0.7m(n=5)
RF 123.04±8.06 95.58±11.75 3.64 0.02*
TA 87.87±5.22 77.90±3.44 1.90 0.13
GA 127.99±4.03 98.91±5.11 4.03 0.02*
1.4m(n=5)
RF 109.89±8.28 89.85±3.77 3.62 0.02*
TA 87.58±3.82 82.99±2.78 2.83 0.05*
GA 128.76±8.70 102.76±4.38 3.09 0.04*
Values are mean±SE.
*p<.05
Table 6. Period t-test of density of right lower limbs within each group
Muscle Group Post t-value p
RF 0.7m 95.58±11.75
0.46 0.02*
1.4m 89.85±3.77
TA 0.7m 77.90±3.44
-1.15 0.38
1.4m 82.99±2.78
GA 0.7m 98.91±5.11
-0.57 0.73
1.4m 102.76±4.38
Values are mean±SE.
*p<.05
Table 7. Independent t-test of density of right lower limbs between groups
Fig. 6. Comparison of density of right lower limbs After we compared water exercise before and after each group, before water exercise rectus femoris density was 123.04±8.06 in 0.7m depth and there were significant difference 95.58±11.75 by statistical after water exercise(p<.05). Also, gastrocnemius density was 127.99±4.03 before water exercise and there were significant difference 98.91±5.11 by statistical after water exercise(p<.05). tibialis anterior density
was increased, however there was no significant difference(p>.05). Before water exercise rectus femoris density was 109.89±8.28 in 1.4m depth and there were significant difference 89.85±3.77 by Statistical after water exercise(p<.05). As well as, tibialis anterior density was 87.58±3.82 and there were significant difference 82.99±2.7 by Statistical after water exercise(p<.05). As well as, gastrocnemius
density was 128.76±8.70 before water exercise and here were significant difference 102.76±4.38 by statistical after water exercise(p<.05)(Table 6)(Fig. 6).
After we compared water exercise between groups, Ractus femoris gastrocnemius density was significant difference 95.58±11.75 in 0.7m and 89.85±3.77 in 1.4m(p<.05). tibialis anterior and gastrocnemius more increase an average, however there was no significant difference(p>.05)(Table 7)
Group Muscle Period (M±SE)
t-value p
Pre Post
0.7m(n=5)
RF 118.59±2.51 99.36±3.74 4.07 0.02*
TA 92.50±4.07 78.67±1.82 2.83 0.05*
GA 127.78±6.96 93.97±2.84 3.71 0.02*
1.4m(n=5)
RF 113.17±6.77 97.12±6.93 3.84 0.02*
TA 96.54±5.89 89.47±5.12 2.93 0.04*
GA 128.67±7.22 100.38±6.31 6.51 0.00*
Values are mean±SE.
*p<.05
Table 8. Period t-test density of left lower limbs within each group
Muscle Group Post t-value p
RF 0.7m 99.36±3.74
0.29 0.13
1.4m 97.12±6.93
TA 0.7m 78.67±1.82
-1.99 0.06
1.4m 89.47±5.12
GA 0.7m 93.97±2.84
-0.93 0.04*
1.4m 100.38±6.31
Values are mean±SE.
*p<.05
Table 9. Independent of density of left lower limbs between groups
Fig. 7. Comparison of density of left lower limbs (Fig. 6).
We analyze covariance to improve average difference in rectus femoris. The analysis showed that there was no significant difference by water depth(p>.05).
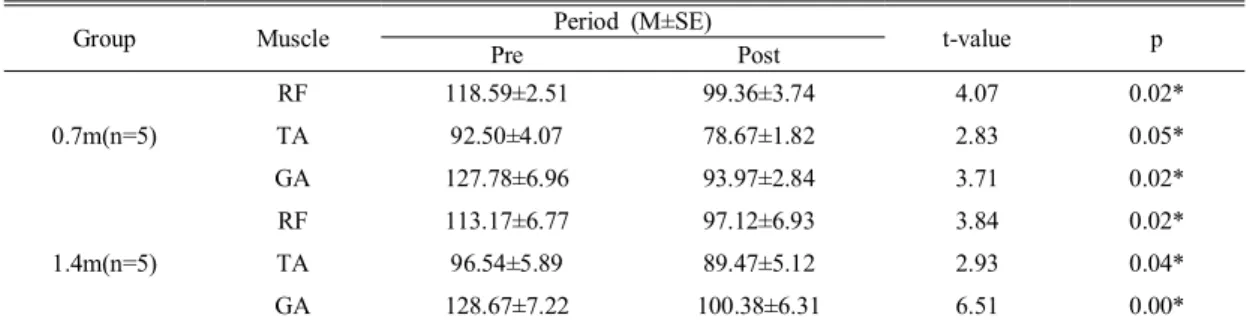
2) Comparison of density at left the lower limbs After we compared water exercise before and after each group, before water exercise rectus
femoris density was 118.59±2.51 in 0.7m depth and there were significant difference 99.36±3.74 by statistical after water exercise(p<.05). Also, before water exercise tibialis anterior density was 92.50
±4.07 and there were significant difference 78.67±
1.82 by statistical after water exercise(p<.05). As well as, gastrocnemius density was 127.78±6.96 before water exercise and there were significant
difference 93.97±2.84 by statistical after water exercise(p<.05). Before water exercise rectus femoris density was 113.17±6.77 in 1.4m depth and there were significant difference 97.12±6.93 by Statistical after water exercise(p<.05). As well as, tibialis anterior density was 96.54±5.89 and there were significant difference 89.47±5.12 by Statistical after water exercise(p<.05). As well as, gastrocnemius density was 128.67±7.22 before water exercise and
here were significant difference 128.67±7.22 by statistical after water exercise(p<.05)(Table 8)(Fig. 7).
After we compared water exercise between groups, gastrocnemius density was significant difference 93.97±2.84 in 0.7m and 100.38±6.31 in 1.4m(p<.05).
Ractus femoris and tibialis anterior more increase an average, however there was no significant difference(p>.05)(Table 9)(Fig. 7).
We analyze covariance to improve average difference in gastrocnemius. The analysis showed that there was no significant difference by water depth(p>.05).
Ⅳ . Discussion
Muscle strength is a broad term that refers to the ability of contractile tissue to produce tension and a resultant force based on the demands placed upon the muscle. More specifically, muscle strength is the greatest measurable force that can be exerted by a muscle or muscle group to overcome resistance during a single, maximum effort. The development of muscle strength is an integral component of most rehabilitation or conditioning programs for individuals of all ages and all ability levels. Insufficient muscular strength can contribute to major functional losses of even the most basic activities of daily living. This decline in strength appears to occur later or at a slower rate in active adults versus those who are sedentary. The rate of decline in the torque-generating capacity of muscle in most cases accelerates to approximately 2 to 4% per year in men and women in their 60s, 70s, and beyond. However, the rate of decline may be significantly less(only 0.3% decreases per year) in elderly men and women who maintain a high level of physical activity (Kisner & Colby, 2002).
On this study we divided ten normal people into two groups, testing one with water exercise program by 3 times a week for 6 weeks, the other with an
hour exercise including stretching. As the result, we found out there wasn't any difference of muscle strength between each groups. While on the researches of Kim(2006) and the others they divided two groups into a water exercise group and an aerobic exercise group to exercise with three times a week for 12 weeks, after all it is found that the muscle strength was improved with same rate between each group. With related this, when Hunter and Treuth(1995) made an experiment on over 60-year-old ladies to test about a resistance training, they reported 60.3% increase of muscle power on lower limbs. It was similar on the researches of Scott et al(2002)., they tested over 70-year-old elderly for an increasing resistance training to report 45% increase of muscle power with same rate. We guess these similar results are caused by some differences between the first experimenters and us, that are while they spent 12 weeks, twice than the period of our experiment, and did longer exercise, but we made an experiment on healthy adult women.
On similar report written by Kim(2007), he tested 40-year-old women in the menopause by three times a week for 90 minutes doing several variety of water exercise as like walking, jumping, and running during 8 weeks. He reported the muscle power on lower limbs rub to increase more than before. But we guess this result caused by the lack of a variety of water exercise programs and enough resistance.
On this study we found the similar differences between rectus femories and tibialis anterior at 0.7m group and between tibialis anterior and gastrocnemius at 1.4m group on right pennation angle of lower limbs' muscle. There are also similar increase in rectus femoris, tibialis anterior, and gastrocnemius at 0.7m group, and rectus femoris at 1.4m group on lower limbs' muscle left pennation angle.
It also showed similar differences between rectus
femoris and gastrocnemius at 0.7m group, among rectus femoris and tibialis anterior, Gastrocenemius at 1.4m group in the density of right lower limbs.
It shows that group’s rectus femoris, tibialis anterior, and gastrocnemius all are increased with same rate in the density of left lower limbs. With similar doing first study by Jin hang-mi and the others shows water rehabilitation exercises work on the isometric extension muscle of quadriceps muscle strength of the old women with degenerative knee arthritis disease after strengthening the quadriceps muscle strength. It coincides with our study. This result appear because water exercise inclusive of aerobic exercise an augmentation of the energy utilization of the muscle(Kisner & Colby, 2002), the improvement of the muscle's ability to use energy is a direct result of increased levels of oxidative enzymes in the muscles, as well as increased mitochondrial density and size, and an increase muscle fiber capillary supply.
Bates and Hanson(1996) reported that the muscle strength was improved by increase of muscle fiber, and the size or volume of muscle which was related with the increase of vessel density of muscle and protein mass. It shows that these various factors affect the increase of pennation angle and muscle density.
We could not find that the water exercise program according to the depth of water affects the increase of pennation and muscle density. However, we could find that increase of pennation and muscle density in water exercise program according to the passage of time. Especially we can see that some increase of rectus femoris at 0.7 group, and rectus femoris, tibialis anterior, and gastrocnemius at 1.4m. But we can't generalize this rule because it wasn't the blind test for 0.7m and 1.4m group, and there were lack of subjects and too short period of the study. Therefore to support this study more we have to have many subjects, and develop the study
of various two-way water exercise program and the combined water exercise with ground exercise. We need study to estimate and measure the effects of the long-term exercise programs. And more studies should be considered in all the realistic parts to progress as like cost-effectiveness and living standard with objectivity.
Ⅴ . Conclusion
We are studied the Effects of water exercise on the strength of the lower limbs, depend on the depth, June 18th ~July 31st 2009. It was need 10 subjects as two group-(0.7m & 1.4m), and it was handled 6 week each, the result of the study are below.
1. Before and after water exercise, right the lower limbs pennation angle change significantly increased in 0.7m group's rectus femoris and in 1.4m group's tibialis anterior and gastrocnemius, too.
There wasn't significant difference muscular strength increasing between two groups depends on water depth. But, the 1.4m group shows increasing their lower limbs muscular strength more.
2. Before and after water exercise, left the lower limbs pennation angle change significantly increased in 0.7m group's all groups. And in 1.4m group's rectus femoris, too.
There wasn't significant difference muscular strength increasing between two groups depends on water depth. But, the 1.4m group shows increasing their lower limbs muscular strength more.
3. Before and after water exercise, right the lower limbs density change significantly increased in 0.7m group's rectus femoris, tibialis anterior and gastrocnemius and in 1.4m group's femoris, tibialis anterior and gastrocnemius, too.
There wasn't significant difference muscular strength increasing between two groups depends on the water depth. But, the 1.4m group shows increasing
the lower limbs muscular strength more.
4. Before and after water exercise, left the lower limbs density change significantly increased in all rectus femoris, tibialis anterior and gastrocnemius between two groups.
There wasn't significant difference muscular strength increasing between two groups depends on the water depth. But, the 1.4m group shows that the lower limbs muscular strength more increase.
We find out the muscle strength increase with same rate but there are no any similar differences between two groups according to water depth.
Reference
Bates A, & Hanson N. Aquatic Exercise Therapy.
W. B. Saunders Company. 1996;1-28.
Brotzman S. Brent. Clinical Orthopaedic Rehabilitation.
Elsevier Science Health Science div. 1996.
Carolyn Kisner, Lynn Allen Colby. Therapeutic Exercise : Foundations and Techniques. Ed 4.
Philadephia. F. A. Davis Company. 2002.
Exercise Physiology Lab of Seoul University. Exercise Test and Prescription : Theory and Practice.
Bokyong publishin Company. Seoul. 1989;204-88.
Fitzsimmons A, Bonner F, & Lindsay R. Failure to diagnose osteoprosis Am. J. Phys. Med, Rehabil, 1995;74(3):240-2.
Fujisima K, Shimizu T, Ogaki T, Hotta N, Kanaya S, Shono T, & Ueda T. Thermoregulatory responses to Low-Intensity prolonged swimming in water at various temperatures and treadmill walking on land. Journal of Physiological Anthropology.
2001;20(3):199-206.
Hall J, Macdonald IA, Maddison PJ, O'Hare JP.
Cardiorespiratory responses to underwater treadmill walking in healthy females, European Journal of Applied Physiology and Occupational Physiology, 1998;77(3):278-84.
Hunter GR, & Treuth MS. Relative training
intensity and increases in strenght in older men.
Journal of Sthrength Conditioning Research, 1995;
9(3):188-91.
Im EO. Limitation of Research for Rheumatiod Arthrithis in Feministic Perspectives and the Suggestion for. The Journal of Rheumatology Health. 1997;4(1):101-14.
Jung YW. The Effects of Therapeutic Exercise on the Muscle Imbalance of Upper Crossed Syndromes.
Daegu University. 2006.
Kawakami Y, Ichinose Y, & Fukunaga T.
Architectural and functional features of human triceps surae muscles during contraction. Journal of Applied Physiology, 1998;85:398-404.
Kim HJ, Choi JH. Effect of 12-week aquatic exercise on the isokinetic muscular function of knee joint in the elderly women. The Korean Journal of Physical Education. 2006;45(1):655-64.
Kim SY. The Impacts of Weight-Bearing Exercise and Aquatic Exercise on Middle-Aged Women's Body Composition and IsoKinetic Muscle Strength and Bone Mineral Density. Han Yang University.
2007.
Lee JW. The Effect of Neural Adaptation and Change of Skeletal Muscle Architecture by Electrical Stimulation. DongShin University. 2007.
Lee YO, Choi MH, Kim JI, Lee TY. Effect of Aquatic Exercise Program on Lower Limbs, Muscle Strength, Knee Joint Flexion and Pain Changes of Arthritis Patients. Journal of Rhumatology Health. 1998;5(2):222-37.
Lim YE, Yang EY, Kim TY. Influence of Heat Stress Temperature on Sympathetic Nerver Activities.
Journal of the Korean Academy of Clinical Electrophysiology. 2007;5(2):11-21.
Maurits NM, Bollen AE, Windhausen A, De Jager AE, & Van Der Hoeven JH. Muscle ultrasound analysis: Normal values and differentiation between myopathies and neuropathies. Ultrasound in Medicine and Biology. 2003;29(2):215-25.
Ministry for health, welfare and family affairs. The national payment of medical an estimation primary result-may 27 a news. 2007.
Mortell R, Tucker L. Effects of a 12-week resistive training program in the home using the body bar on dynamic and absolute strength of middle-age women. Percept Mot Skills. 1993;76(3):1131-8.
Nakanishi Y, Kimura T & Yokoo Y. Maximal physiological responses to deep water running at thermoneutral temperature, Applied Human Science, 1999;18(2):31-5.
Rho KT, Choi JH, Kim HJ. Effects of the 12-weeks aquatic complex exercise on physical function and psychological function in the elderly. Journal of Physical Growth and Motor Development.
2005;13(4):63-73.
Scott T, David W, & Michael G. Maintenance of Whole Muscle Strength and Size Following Resistance Training in older Men. Biological Sciences and Medical Sciences, 2002;57:138-43.
Shono T, Fujishima K, Hotta N, Ogaki T. & Ueda T. Cardiorespiratory response to low-intensity walking in water and on land in elderly women, Journal of Physiology Anthropology. 2001;20(5):
269-74.
Sung HR, Yang JH, Kim MS, Kang MS, Kang JS.
Effects of Swiss Ball Exercise on Functional Fitness and Body Sway in Male Elderly Nursing Home Residents. Journal of Physical Growth and Motor Development. 2005;13(1):91-9.