Total Lesion Glycolysis Using
18F-FDG PET/CT as a Prognostic Factor for Locally Advanced Esophageal Cancer
Standardized uptake value (SUV), metabolic tumor volume (MTV), and total lesion glycolysis (TLG) have been considered prognostic factors for survival in many cancers.
However, their prognostic value for radiotherapy-treated squamous esophageal cancer has not been evaluated. In this study, SUV, MTV, and TLG were measured to predict their prognostic role in overall survival (OS) in 38 esophageal cancer patients who had undergone 18F-FDG PET/CT before radiotherapy. TLG demonstrated higher sensitivity and specificity for predicting OS than MTV and SUV; and a better OS was observed in patients with low TLG compared to those with high TLG in locally advanced disease (OS, 46.9 months; 95% confidence interval [CI], 33.50-60.26 vs. 25.3 months; 95% CI, 8.37- 42.28; P = 0.003). Multivariate analyses in these patients determined that TLG and the use of combination chemotherapy were the independent prognostic factors for OS (hazard ratio [HR], 7.12; 95% CI, 2.038-24.857; P = 0.002 and HR, 6.76; 95% CI, 2.149-21.248;
P = 0.001, respectively). These results suggest that TLG is an independent prognostic factor for OS and a better predictor of survival than MTV and SUV in patients with locally advanced esophageal cancer treated with radiotherapy.
Keywords: Total Lesion Glycolysis; Metabolic Tumor Volume; Esophageal Neoplasms,
18F-FDG PET/CT Ji Hyung Hong,1 Hyon Ho Kim,2
Eun Ji Han,3 Jae Ho Byun,1
Hong Seok Jang,4 Eun Kyoung Choi,5 Jin Hyoung Kang,2 and Ie Ryung Yoo6
1Department of Internal Medicine, Incheon St.
Mary’s Hospital, Incheon; 2Department of Internal Medicine, Seoul St. Mary’s Hospital, Seoul;
3Department of Nuclear Medicine, Daejeon St.
Mary’s Hospital, Daejeon; 4Department of Radiation Oncology, Seoul St. Mary’s Hospital, Seoul;
5Department of Nuclear Medicine, Incheon St.
Mary’s Hospital, Incheon; 6Department of Nuclear Medicine, Seoul St. Mary’s Hospital, The Catholic University of Korea, Seoul, Korea
Received: 6 June 2015 Accepted: 15 September 2015 Address for Correspondence:
Ie Ryung Yoo, MD
Department of Nuclear Medicine, College of Medicine, Seoul St.
Mary’s Hospital, The Catholic University of Korea, 222 Banpo- daero, Seocho-gu, Seoul 06591, Korea
Tel: +82.2-2258-1549, Fax: +82.2-2258-1575 E-mail: iryoo@catholic.ac.kr
http://dx.doi.org/10.3346/jkms.2016.31.1.39 • J Korean Med Sci 2016; 31: 39-46
INTRODUCTION
Esophageal cancer is the third most common malignancy of the digestive tract worldwide (1). In East Asia, the most com- mon type of esophageal cancer is squamous cell carcinoma, which is considered highly radiosensitive. Chemoradiotherapy (CRT) has become an accepted treatment for localized esopha- geal cancer because it can achieve the same survival benefit as surgical resection in a less invasive manner (2). However, the prognosis of esophageal cancer remains poor, despite recent improvements in the available treatment modalities. The iden- tification of pretreatment prognostic factors for esophageal cancer could improve the treatment strategies and aid in risk stratification.
Positron emission tomography (PET) with 2-deoxy-2-[fluorine- 18]fluoro-D-glucose (18F-FDG)/computed tomography (CT) is used for esophageal tumor staging before treatment and for the evaluation of tumor response, locoregional recurrence, and distant metastases after treatment. Pretreatment standardized uptake value (SUV) is commonly used as a relative measure of
18FDG uptake and is considered a prognostic factor for risk stratification; however, it does not reflect the heterogeneity of a
tumor (3). To overcome this drawback of SUV, metabolic tumor volume (MTV) and total lesion glycolysis (TLG), measures that reflect metabolic volume and activity, respectively, have been proposed as quantitative indexes of tumor metabolism. These indexes are prognostic factors for survival in various solid can- cers such as lung cancer, pleural mesothelioma, ovarian cancer, and head and neck cancer (4-7).
To date, a comparison of the abilities of pre-treatment TLG, MTV, and SUV to predict the outcome of radiotherapy in esophageal cancer patients has not been undertaken. Thus, the purpose of the present study was to assess the efficacy of these factors in predicting survival in patients with esophageal cancer treated with radiotherapy with or without chemotherapy as an initial treatment.
MATERIALS AND METHODS
Patient population, treatment, and response evaluation Eighty-nine patients with pathologically confirmed esophageal cancer, who did not show any evidence of distant metastasis, received radiotherapy with or without chemotherapy as an ini- tial treatment in Seoul St. Mary’s hospital, Incheon St. Mary’s Oncology & Hematology
hospital, and St. Vincent hospital between January 1, 2009 and December 31, 2013. Among them, 38 patients who were evalu- ated by pre-treatment 18F-FDG PET/CT were included in this study.
Radiation was delivered once daily, 5 days a week for 6-7 weeks. The total radiation dose and concomitant chemothera- py regimen were determined by the physician. Chemotherapy regimens were as follows: The weekly 5-fluorouracil (5-FU)/
cisplatin (FP) regimen consisted of an intravenous infusion of 30 mg/m2 cisplatin on day 1, followed by a 24-hr continuous in- fusion of 200 mg/m2 5-FU for 5 days every week. The tri-weekly FP regimen consisted of an intravenous infusion of 75 mg/m2 cisplatin on day 1, followed by a 24-hr continuous infusion of 800 mg/m2 5-FU for 4 days. The weekly cisplatin regimen con- sisted of an intravenous infusion of 30 mg/m2 cisplatin on day 1 every week. The weekly 5-FU regimen consisted of an intrave- nous 24-hr continuous infusion of 200 mg/m2 5-FU for 5 days every week.
Approximately 10-12 weeks after completion of therapy, pa- tient response was assessed by a clinical examination and a chest and abdomen/pelvis CT scan using the Response Evalua- tion Criteria in Solid Tumors (RECIST) version 1.1 criteria. The data regarding patient progression, recurrence, and death were collected from the patients’ medical records. Tumors with inva- sion to adjacent structures or nodal metastasis were defined as locally advanced disease, while tumors that lacked evidence of invasion to adjacent structures or nodal metastasis were de- fined as early disease.
18F-FDG PET/CT imaging and analysis
PET scanning was performed using routine clinical PET scan- ning protocols at the 3 participating institutions. The three insti- tutions shared the same methods for patient preparation, FDG preparation, and imaging procedure. All PET/CT images were centrally interpreted and quantitated using single workstation software, Mirada XD3 software (Mirada Medical, Oxford, Unit- ed Kingdom).
All patients fasted for at least 4-6 hr before evaluation by 18FDG PET/CT. A dose of 5.5-7.4 MBq/kg body weight of FDG was in- jected intravenously, and scanning began 60 min later. No pa- tient had a blood glucose level greater than 130 mg/dL before the injection. Studies were acquired on two combined PET/CT in-line systems (Biograph Duo; Siemens Medical Solutions, Knoxville, TN, USA or Discovery STE; GE Healthcare, Milwau- kee, WI, USA). The CT scan began at the orbitomeatal line and progressed to the proximal thigh (Biograph Duo; 130 kVp, 80 mA and 5 mm slice thickness; Discovery STE; 140 kVp, auto mA and 3.75 mm slice thickness). The PET scan followed immedi- ately over the same body region. The CT data were used for at- tenuation correction, and images were reconstructed using a standard ordered-subset expectation maximization algorithm.
The axial spatial intrinsic resolution was 6.5 or 5.0 mm at the centre of the field of view.
The images were closely reviewed by 2 nuclear medicine physicians. The maximum SUV (SUVmax) of the primary can- cer was measured by placing a volume of interest around the visible tumor, with careful attention to avoid inclusion of FDG- avid non-tumor tissue.
MTV was defined as the summed volume in cubic centime- tres (cm3) of the primary cancer and was measured using a semi-automated contouring program computed using Mirada XD3 software. To define the contouring margin of the primary tumor, we used a fixed SUV cut-off value of 2.5. Each identified tumor was then segmented semi-automatically in three dimen- sions. The tumor boundaries were drawn large enough to in- corporate target lesions, and in transaxial, coronal, and sagittal planes reduced to eliminate the confounding influence by physiologically glucose-avid tissues such as the myocardium.
Then, an isocontour connecting the outline of the target lesion with a cut-off value of the SUV was set automatically, and all voxels with an SUV over the cut-off value within the isocontour were included in the MTV calculation. After segmentation, the software quantified the final MTV. SUVmax, peak SUV (SUV- peak), and mean SUV (SUVmean) were also calculated. SUV- peak was defined as the average SUV within a circular region of interest 1.2 cm in diameter centered on the maximum value pixel. TLG was calculated as the product of MTV and SUV- mean.
Outcome endpoints
To determine the prognostic value of SUVs, MTV, and TLG, overall survival (OS) was used as the clinical endpoint. OS was defined as the time from therapy initiation to death or to the most recent inpatient or outpatient follow-up through May 01, 2014. Patient response to radiotherapy was also analysed. Treat- ment response was evaluated based on the RECIST v.1.1 (8).
Patients were identified as responders, having a partial response (PR) or complete response (CR), or non-responders in the case of stable disease (SD) and progressive disease (PD).
Statistical analysis
Statistical analyses were performed using SPSS software version 19.0 (SPSS, Chicago, IL, USA) and MedCalc version 15.6 (Med- Calc, Seoul, Korea). Receiver operating characteristic (ROC) curve analysis was performed to identify the optimal discrimi- nating cut-off values for TLG, MTV, and SUVs to evaluate the accuracy of each metabolic index as a prognostic parameter.
Cancer-related death was used as a dependent variable in ROC curve analysis. If the area under the curve (AUC) was not statis- tically significant, the median value of the metabolic parameter was selected as a cut-off value. A chi-square test and Mann-Whit- ney U-test were performed to analyse the differences in clinico-
pathological factors and metabolic parameters between re- sponders and non-responders. The log-rank test was used to assess the correlation between OS and TLG, MTV, and SUV. A Cox proportional hazard model was used for multivariate com- parisons, and the estimated hazard ratio (HR) and 95% confi- dence interval (CI) were calculated. All tests were two-sided and P values < 0.05 were considered statistically significant.
Ethics statement
This retrospective analysis was approved by the institutional re- view boards of The Catholic University of Korea, Seoul St.
Mary’s Hospital (No.KC14RISI0037), St. Vincent Hospital (No.
VC14OIMI0204) and Incheon St. Mary’s Hospital (No. OC14RI- SI0144). Because of the retrospective design of this study, the need for informed consent from the patients was waived.
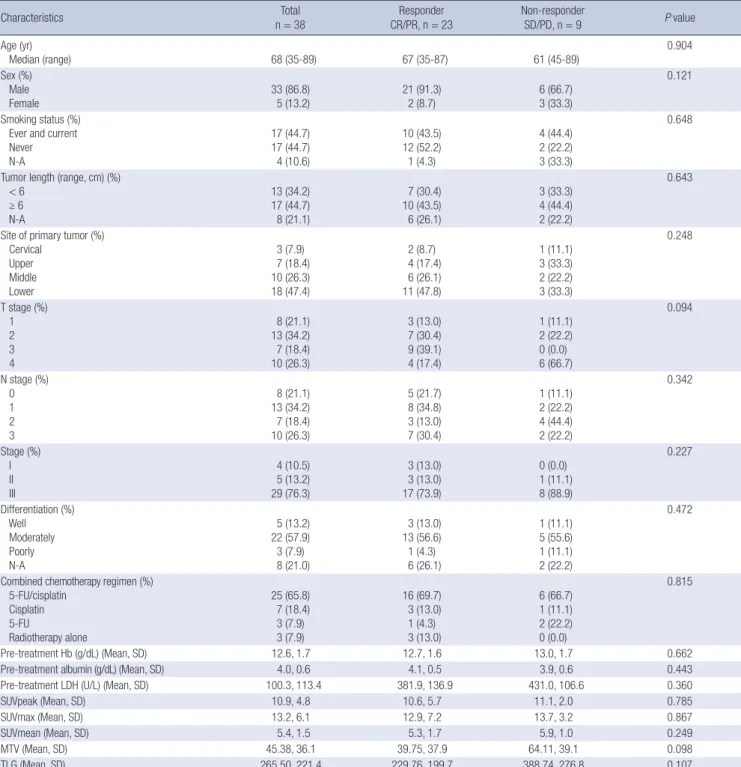
Table 1. Patient characteristics
Characteristics Total
n = 38 Responder
CR/PR, n = 23 Non-responder
SD/PD, n = 9 P value
Age (yr)
Median (range) 68 (35-89) 67 (35-87) 61 (45-89)
0.904 Sex (%)
Male Female
33 (86.8) 5 (13.2)
21 (91.3) 2 (8.7)
6 (66.7) 3 (33.3)
0.121
Smoking status (%) Ever and current Never N-A
17 (44.7) 17 (44.7) 4 (10.6)
10 (43.5) 12 (52.2) 1 (4.3)
4 (44.4) 2 (22.2) 3 (33.3)
0.648
Tumor length (range, cm) (%) < 6
≥ 6 N-A
13 (34.2) 17 (44.7) 8 (21.1)
7 (30.4) 10 (43.5) 6 (26.1)
3 (33.3) 4 (44.4) 2 (22.2)
0.643
Site of primary tumor (%) Cervical
Upper Middle Lower
3 (7.9) 7 (18.4) 10 (26.3) 18 (47.4)
2 (8.7) 4 (17.4) 6 (26.1) 11 (47.8)
1 (11.1) 3 (33.3) 2 (22.2) 3 (33.3)
0.248
T stage (%) 1 2 3 4
8 (21.1) 13 (34.2) 7 (18.4) 10 (26.3)
3 (13.0) 7 (30.4) 9 (39.1) 4 (17.4)
1 (11.1) 2 (22.2) 0 (0.0) 6 (66.7)
0.094
N stage (%) 0 1 2 3
8 (21.1) 13 (34.2) 7 (18.4) 10 (26.3)
5 (21.7) 8 (34.8) 3 (13.0) 7 (30.4)
1 (11.1) 2 (22.2) 4 (44.4) 2 (22.2)
0.342
Stage (%) I II III
4 (10.5) 5 (13.2) 29 (76.3)
3 (13.0) 3 (13.0) 17 (73.9)
0 (0.0) 1 (11.1) 8 (88.9)
0.227
Differentiation (%) Well Moderately Poorly N-A
5 (13.2) 22 (57.9) 3 (7.9) 8 (21.0)
3 (13.0) 13 (56.6)
1 (4.3) 6 (26.1)
1 (11.1) 5 (55.6) 1 (11.1) 2 (22.2)
0.472
Combined chemotherapy regimen (%) 5-FU/cisplatin
Cisplatin 5-FU
Radiotherapy alone
25 (65.8) 7 (18.4) 3 (7.9) 3 (7.9)
16 (69.7) 3 (13.0) 1 (4.3) 3 (13.0)
6 (66.7) 1 (11.1) 2 (22.2) 0 (0.0)
0.815
Pre-treatment Hb (g/dL) (Mean, SD) 12.6, 1.7 12.7, 1.6 13.0, 1.7 0.662
Pre-treatment albumin (g/dL) (Mean, SD) 4.0, 0.6 4.1, 0.5 3.9, 0.6 0.443
Pre-treatment LDH (U/L) (Mean, SD) 100.3, 113.4 381.9, 136.9 431.0, 106.6 0.360
SUVpeak (Mean, SD) 10.9, 4.8 10.6, 5.7 11.1, 2.0 0.785
SUVmax (Mean, SD) 13.2, 6.1 12.9, 7.2 13.7, 3.2 0.867
SUVmean (Mean, SD) 5.4, 1.5 5.3, 1.7 5.9, 1.0 0.249
MTV (Mean, SD) 45.38, 36.1 39.75, 37.9 64.11, 39.1 0.098
TLG (Mean, SD) 265.50, 221.4 229.76, 199.7 388.74, 276.8 0.107
N-A, non-assessable; SD, standard deviation; 5-FU, 5-fluoropyrimidine; Hb, hemoglobin; LDH, lactate dehydrogenase; SUV, standardized uptake value; MTV, metabolic tumor volume; TLG, total lesion glycolysis.
RESULTS
Patient characteristics
The patient characteristics are summarised in Table 1. All pa- tients were diagnosed with squamous cell carcinoma. Thirty- three patients (86.8%) exhibited locally advanced disease.
Three patients (7.9%) did not received chemotherapy during radiotherapy. The median follow-up time was 7.5 months (range, 2.6-87.9). After radiotherapy with or without chemo- therapy, CR was observed in 9 patients, PR in 14 patients, SD in 3 patients, and PD in 6 patients. Three patients, 2 with a PR and 1 with SD, underwent an esophagectomy with lymph node dis- section with curative intent. Six patients died before the evalua- tion. By the last follow-up date, 21 patients had died. In those patients who responded to therapy, baseline TLG and MTV were slightly, but not significantly higher than in non-respond- ers (P = 0.107 and 0.098, respectively), whereas no differences in SUVs were detected according to patient response.
ROC curve analysis, AUCs, and cut-off values
The AUCs of TLG, MTV, and SUVmean were 0.695 (P = 0.041, 95% CI, 0.522-0.867), 0.678 (P = 0.046, 95% CI, 0.507-0.820), and 0.609 (P = 0.252, 95% CI, 0.428-0.791), respectively (Fig. 1). The AUCs for SUVmax and SUVpeak were 0.563 (P = 0.509) and 0.583 (P = 0.386), respectively. The difference in the AUC be- tween TLG and MTV, TLG, and SUVmean, and MTV and SUV- mean were 0.017 (P = 0.559), 0.086 (P = 0.266), and 0.069 (P = 0.460), respectively. A ROC analysis of OS demonstrated that the AUC for TLG was greater than those for MTV or SUVs. Thus, the optimal cut-off value of TLG was 232.98 with 71.4% sensitiv- ity and 76.5% specificity for the dichotomized TLG ( ≤ 232.98 vs. > 232.98). The optimal cut-off value of MTV was 44.7 cm3 with 61.9% sensitivity and 82.4% specificity for the dichotomized MTV (≤ 44.7 vs. > 44.7). Because there was no statistically sig- nificant associations between the AUC of SUVmax, SUVmean, or SUVpeak and OS, the median (5.40, 5.70, and 11.0, respec- tively) were used as the cut-off values for dichotomization.
Metabolic parameters as prognostic factors for OS We compared the OS according to the clinicopathological vari- ables and metabolic parameters. The median OS did not signif- icantly differ between patients with early vs. advanced disease.
However, patients with advanced T stage tended to have short- er OS compared with those with early T stage (40.8 months, 95% CI, 21.56-60.10 vs. 32.3 months, 95% CI, 20.46-44.20; P = 0.385) (Fig. 2A). The median OS did not significantly differ be- tween patients who received CRT and those who received ra- diotherapy alone. Among the patients who received CRT, those receiving an FP combination exhibited longer OS than those with 5-FU or cisplatin alone (57.9 months, 95% CI, 40.07-75.75 vs. 14.0 months, 95% CI, 1.46-26.52; P = 0.012).
Next, the patients were dichotomized into two subgroups ac- cording to metabolic parameters. Among the total patients, the low TLG group showed a significantly longer OS (45.0 months, 95% CI, 32.98-56.94) compared with the high TLG group (25.3 months, 95% CI, 8.40-42.28; P = 0.004). None of MTV SUVmax, SUV peak, and SUVmean correlate significantly with the OS. In the subgroup analysis according to disease extent, the low TLG group with locally advanced disease exhibited a significantly longer OS compared to the high TLG group (46.9 months, 95%
CI, 33.50-60.26 vs. 25.3 months, 95% CI, 8.37-42.28; P = 0.003) (Fig. 2B), whilst the TLG in patients with early disease did not associate with OS. The low MTV group with locally advanced disease tended to have longer OS compared with the high MTV group, however, without statistical significance (39.0 months, 95% CI, 26.37-51.63 vs. 34.6 months, 95% CI, 15.10-54.01; P = 0.054) (Fig. 2C). The MTV in patients with early disease did not associate with OS. None of SUVmax, SUV peak and SUV mean correlated significantly with OS in patients with locally advanced or early disease (Fig. 2D).
Patients who received the combination chemotherapy showed longer OS than those who received a single regimen (54.4 months, 95% CI, 35.681-73.123 vs. 7.03 months, 95% CI, 4.061-9.992; P = 0.008). However, high TLG was significantly associated with re- duced OS in patients who received both the combination (P = Fig. 1. Receiver operating characteristic curve analysis of survival prediction accord- ing to metabolic parameters in the 38 patients (continuous variable). Area under the curve of total lesion glycolysis (TLG), metabolic tumor volume (MTV), mean standard- ized uptake value (SUVmean) were 0.695 (P = 0.041, 95% confidence interval [CI], 0.522-0.867), 0.678 (P = 0.046, 95% CI, 0.507-0.820), and 0.609 (P = 0.252, 95%
CI, 0.428-0.791), respectively. The differences in the AUC between TLG and MTV, TLG and SUVmean, and MTV and SUVmean were 0.017 (P = 0.559), 0.086 (P = 0.266), and 0.069 (P = 0.460), respectively. Thus, the optimal cut-off values of TLG and MTV were determined as 232.98 and 44.7. Sensitivity and specificity of the dichotomized TLG ( ≤ 232.98 vs. > 232.98) and MTV ( ≤ 44.7 vs. > 44.7) were 71.4/76.5% and 61.9/82.35%, respectively.
Sensitivity
1-Specificity
0 0.2 0.4 0.6 0.8 1.0
1.0
0.8
0.6
0.4
0.2
0
TLG MTV SUVmean Reference line
0.037) and single regimens (P = 0.014).
In the univariate analyses, high TLG was associated with poor OS (HR, 4.69; 95% CI, 1.540-14.281; P = 0.007) (Table 2).
The use of a 5-FU-based combination regimen was the second most significant prognostic factor for OS (HR, 3.41; 95% CI, 1.295-8.959; P = 0.013). In the multivariate analysis, TLG and the use of a combined chemotherapy regimen remained signif- icantly associated with OS in locally advanced esophageal can- cer patients (HR, 6.76; 95% CI, 2.149-21.248; P = 0.001, HR, 4.69;
95% CI, 1.540-14.281; P = 0.007, respectively). Representative examples of the relationship between TLG are OS are shown in Fig. 3.
Fig. 2. Overall survival. (A) Total patients; Upper line, T1,T2 (n = 18; 40.8 months, 95% confidence interval [CI], 21.56-60.10) and lower line, T3, T4 (n = 15; 32.3 months, 95% CI, 20.46-44.20). P = 0.385. (B) Patients with locally advanced esophageal cancer; Upper line, TLG ≤ 232.98 (n = 14; 46.9 months, 95% CI, 33.50-60.26) and lower line, TLG > 232.98 (n = 19; 25.3 months, 95% CI, 8.37-42.28). P = 0.003. (C) Patients with locally advanced esophageal cancer; Upper line, MTV ≤ 44.70 cm3 (n = 17; 39.0 months, 95% CI, 26.37-51.63) and lower line, MTV > 44.70 cm3 (n = 16; 34.6 months, 95,% CI 15.10-54.01). P = 0.054. (D) Patients with locally advanced esophageal can- cer; Upper line, SUVmean ≤ 5.70 (n = 16; 43.0 months, 95% CI, 21.11-64.80) and lower line, SUVmean > 5.70 (n = 17; 31.0 months, 95% CI, 17.10-44.89). P = 0.963.
Overall survival
0 20 40 60 80 100
0 20 40 60 80 100
0 20 40 60 80 100
0 20 40 60 80 100 Month
Month
Month
Month 1.0
0.8
0.6 0.4
0.2
0
P value = 0.385 T1, T2
T3, T4
Overall survival
1.0
0.8
0.6 0.4
0.2
0
P value = 0.003 TLG ≤ 232.98
TLG > 232.98
Overall survival
1.0 0.8
0.6
0.4
0.2 0
P value = 0.054 MTV ≤ 44.70
MTV > 44.70 Overall survival
1.0 0.8
0.6
0.4
0.2 0
P value = 0.963 SUVmean ≤ 5.70
SUVmean > 5.70
A B
C D
DISCUSSION
This study investigated the prognostic value of specific meta- bolic parameters determined from pre-treatment 18F-FDG PET/CT scans in patients with esophageal cancer treated with radiotherapy as the primary treatment. While MTV and SUV did not associate with OS, TLG was found to be an important independent prognostic factor for OS in locally advanced esophageal cancer.
SUV is frequently used to evaluate tumor response and sur- vival outcomes in various cancers such as breast, head and neck, and lung cancers (9-11). The SUV of primary esophageal cancer tumors has been reported to be significantly associated with OS, progression-free survival, local control, and response
to concurrent CRT (12,13). However, in contrast to prior stud- ies, we observed that the primary tumor SUVmax, SUVmean, and SUVpeak were not related to the OS or response to radio- therapy in this study. Song et al. (14) reported that the SUVmax after concurrent CRT was not associated with the pathologic response and Hyun et al. (15) also suggested that SUVmax was not a significant prognostic factor for OS in esophageal cancer.
SUVmax reflects only the most active part of the tumor, and therefore does not correlate with the actual tumor burden (16).
SUVmean, the mean value of metabolic activity in a chosen re- gion, and SUV peak, the average value within a small, fixed-size region of interest in the tumor, share many of the same limita- tions as SUVmax (17). Based on the weaknesses of SUV mea- surements as metabolic parameters of esophageal cancer, vol- ume-based metabolic parameters such as MTV and TLG have been investigated.
MTV and TLG have been reported to be better prognostic factors for survival than SUVs in lung, ovarian, and head and neck cancers, and in pleural mesothelioma (4-7). However, in our study, MTV exhibited a lower AUC than TLG and was not an independent prognostic factor for OS in the multivariate Cox
(A) (B)
Figure 3
(A) (B)
A
B
Fig. 3. Representative examples of the relationship between metabolic parameters and overall survival. (A) Representative 18F-FDG PET/CT images of a 52-yr-old female patient with middle esophageal cancer (T3N0, stage IIB) exhibiting a TLG of 673.92, an MTV of 93.6 cm3, and a SUVmax of 21.7. She exhibited progressive disease after 5-fluorouracil/cisplatin chemoradiotherapy and lived for 5.6 months after the diagno- sis. (B) Representative 18F-FDG PET/CT images of a 79-yr-old male patient with lower esophageal cancer (T2N1, stage IIB) exhibiting a TLG of 68.64, an MTV of 15.6 cm3, and a SUVmax of 10.5. He exhibited stable disease after radiotherapy alone and lived for 61.8 months after the diagnosis.
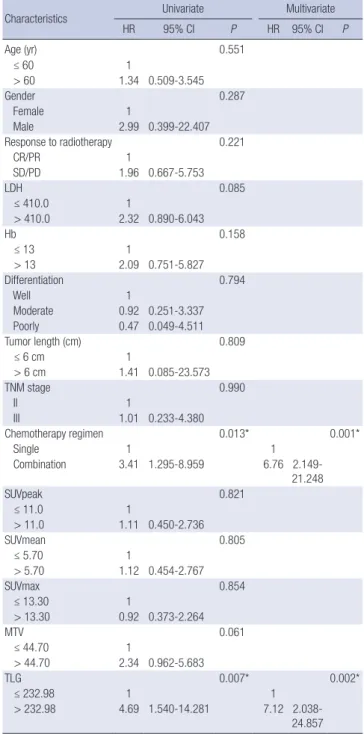
Table 2. Cox regression analysis of overall survival in locally advanced esophageal cancer patients (n = 33)
Characteristics Univariate Multivariate
HR 95% CI P HR 95% CI P
Age (yr) 0.551
≤ 60 1
> 60 1.34 0.509-3.545
Gender 0.287
Female 1
Male 2.99 0.399-22.407
R esponse to radiotherapy 0.221
CR/PR 1
SD/PD 1.96 0.667-5.753
LDH 0.085
≤ 410.0 1
> 410.0 2.32 0.890-6.043
Hb 0.158
≤ 13 1
> 13 2.09 0.751-5.827
Differentiation 0.794
Well 1
Moderate 0.92 0.251-3.337
Poorly 0.47 0.049-4.511
Tumor length (cm) 0.809
≤ 6 cm 1
> 6 cm 1.41 0.085-23.573
TNM stage 0.990
II 1
III 1.01 0.233-4.380
C hemotherapy regimen 0.013* 0.001*
Single 1 1
Combination 3.41 1.295-8.959 6.76 2.149- 21.248
SUVpeak 0.821
≤ 11.0 1
> 11.0 1.11 0.450-2.736
SUVmean 0.805
≤ 5.70 1
> 5.70 1.12 0.454-2.767
SUVmax 0.854
≤ 13.30 1
> 13.30 0.92 0.373-2.264
MTV 0.061
≤ 44.70 1
> 44.70 2.34 0.962-5.683
TLG 0.007* 0.002*
≤ 232.98 1 1
> 232.98 4.69 1.540-14.281 7.12 2.038-
24.857
*Statistically significant. HR, hazard ratio; CI, confidence interval; CR, complete re- sponse; PR, partial response; SD, stable disease; PD, progressive disease; LDH, lac- tate dehydrogenase; Hb, haemoglobin; MTV, metabolic tumor volume; TLG, tumor gly- colysis.
analysis. Consistent with our results, recent studies have re- ported that TLG is a more accurate predictor of survival than MTV in lung, head and neck, and gall bladder cancers and in soft tissue sarcoma (16,18-21). TLG, the product of the MTV and SUVmean, simultaneously represents the degree of 18F- FDG uptake and the size of the metabolically active tumor mass. Our study supports TLG as an ideal metabolic parameter for tumor burden, especially in locally advanced esophageal cancer.
Nevertheless, the comparison between TLG and MTV as prognostic factors in esophageal cancer remains controversial.
Hatt et al. (22) reported that MTV and TLG are both accurate predictive volumetric parameters for OS. Li et al. (23) also re- ported that pre-treatment MTV and TLG are useful prognostic factors in non-surgical esophageal cancer. However, it should be noted that 28% (14/50) of the esophageal cancer patients in Hatt et al. study and 100% of the patients in Li et al. study were diagnosed with adenocarcinoma. The differences in SUV, MTV, and TLG between tumor histologies have not yet been investi- gated in esophageal cancer. In lung cancer, the SUV of tumors with squamous cell histology was higher than that of adenocar- cinomas (24). Similarly, in our study, the mean ( ± standard de- viation) SUVmax (13.16 ± 6.1) was higher than that reported by the Hatt et al. (8.0 ± 3.3). However, differences in the SUV do not always equate to differences in MTV and TLG. The differ- ences in tumor histology between these three studies may af- fect the different prognostic roles of MTV and TLG. Further large-scaled population-based analyses are warranted, includ- ing on the effect of tumor histology on metabolic parameters in esophageal cancer.
This study had some limitations. Because 18F-FDG PET/CT for esophageal cancer staging was not performed routinely in our institution, only 38 patients were included in our analysis.
This could exert potential selection bias and might induce in- significant survival differences or prognostic roles according to different stages and differentiation. However, because other studies evaluated a more heterogeneous population of patients with respect to tumor stage and histology and the initial treat- ment modality (12,13,15), the relatively homogeneous patient population with respect to the administration of radiotherapy and tumor histology in the current study compensates for this limitation. Moreover, we measured all intrathoracic tumors with visibly increased 18FDG uptake, not differentiating nodal metastases from the primary tumor, because small lymph nodes adjacent to the primary tumor cannot be measured sep- arately in 18F-FDG PET/CT. Patients with lymph node metasta- sis accounted for 79% of the patients examined. In a recent study of lung cancer, the TLG and MTV of the primary tumor, as well as nodal and distant metastases were associated with OS (7). Further research to define the prognostic roles of TLG within the primary tumor and lymph nodes is on going.
In conclusion, the present study suggests that TLG is an in- dependent prognostic factor for OS and a better predictor of survival than MTV and SUV in patients with locally advanced esophageal cancer treated with radiotherapy as the initial treat- ment. A new prognostic stratification based on conventional clinicopathological parameters combined with TLG may pro- vide more optimised prognostic information.
DISCLOSURE
The authors have no conflicts of interest to disclose.
AUTHOR CONTRIBUTION
Design of the study: Hong JH, Yoo IR. Investigation of the clini- cal data: Hong JH, Kim HH. Measurement of the metabolic pa- rameters: Han EJ, Choi EK, Yoo IR. Data analysis: Hong JH, Kim HH. Wroting the manuscript: Hong JH, Yoo IR. Final decision to submit and approval of the final manuscript: all authors.
ORCID
Ji Hyung Hong http://orcid.org/0000-0002-0492-3959
REFERENCES
1. Parkin DM, Bray F, Ferlay J, Pisani P. Global cancer statistics, 2002. CA Cancer J Clin 2005; 55: 74-108.
2. Stahl M, Stuschke M, Lehmann N, Meyer HJ, Walz MK, Seeber S, Klump B, Budach W, Teichmann R, Schmitt M, et al. Chemoradiation with and without surgery in patients with locally advanced squamous cell carcinoma of the esophagus. J Clin Oncol 2005; 23: 2310-7.
3. Chan SC, Chang JT, Lin CY, Ng SH, Wang HM, Liao CT, Chang CJ, Lin SY, Yen TC. Clinical utility of 18F-FDG PET parameters in patients with advanced nasopharyngeal carcinoma: predictive role for different sur- vival endpoints and impact on prognostic stratification. Nucl Med Com- mun 2011; 32: 989-96.
4. Lee HY, Hyun SH, Lee KS, Kim BT, Kim J, Shim YM, Ahn MJ, Kim TS, Yi CA, Chung MJ. Volume-based parameter of 18)F-FDG PET/CT in ma- lignant pleural mesothelioma: prediction of therapeutic response and prognostic implications. Ann Surg Oncol 2010; 17: 2787-94.
5. Chung HH, Kwon HW, Kang KW, Park NH, Song YS, Chung JK, Kang SB, Kim JW. Prognostic value of preoperative metabolic tumor volume and total lesion glycolysis in patients with epithelial ovarian cancer. Ann Surg Oncol 2012; 19: 1966-72.
6. Dibble EH, Alvarez AC, Truong MT, Mercier G, Cook EF, Subramaniam RM. 18F-FDG metabolic tumor volume and total glycolytic activity of oral cavity and oropharyngeal squamous cell cancer: adding value to clinical staging. J Nucl Med 2012; 53: 709-15.
7. Liao S, Penney BC, Wroblewski K, Zhang H, Simon CA, Kampalath R, Shih MC, Shimada N, Chen S, Salgia R, et al. Prognostic value of meta- bolic tumor burden on 18F-FDG PET in nonsurgical patients with non- small cell lung cancer. Eur J Nucl Med Mol Imaging 2012; 39: 27-38.
8. Eisenhauer EA, Therasse P, Bogaerts J, Schwartz LH, Sargent D, Ford R, Dancey J, Arbuck S, Gwyther S, Mooney M, et al. New response evalua- tion criteria in solid tumours: revised RECIST guideline (version 1.1).
Eur J Cancer 2009; 45: 228-47.
9. Zhang J, Jia Z, Ragaz J, Zhang YJ, Zhou M, Zhang YP, Li G, Wang BY, Wang ZH, Hu XC. The maximum standardized uptake value of 18 F- FDG PET scan to determine prognosis of hormone-receptor positive metastatic breast cancer. BMC Cancer 2013; 13: 42.
10. Lin SC, Liao CY, Kao CH, Yen KY, Yang SN, Wang YC, Liang JA, Chen SW. Pretreatment maximal standardized uptake value of the primary tumor predicts outcome to radiotherapy in patients with pharyngeal cancer. J Radiat Res (Tokyo) 2012; 53: 462-8.
11. Davies A, Tan C, Paschalides C, Barrington SF, O’Doherty M, Utley M, Treasure T. FDG-PET maximum standardised uptake value is associat- ed with variation in survival: analysis of 498 lung cancer patients. Lung Cancer 2007; 55: 75-8.
12. Atsumi K, Nakamura K, Abe K, Hirakawa M, Shioyama Y, Sasaki T, Baba S, Isoda T, Ohga S, Yoshitake T, et al. Prediction of outcome with FDG- PET in definitive chemoradiotherapy for esophageal cancer. J Radiat Res (Tokyo) 2013; 54: 890-8.
13. Palie O, Michel P, Ménard JF, Rousseau C, Rio E, Bridji B, Benyoucef A, Meyer ME, Jalali K, Bardet S, et al. The predictive value of treatment re- sponse using FDG PET performed on day 21 of chemoradiotherapy in patients with oesophageal squamous cell carcinoma. A prospective, mul- ticentre study (RTEP3). Eur J Nucl Med Mol Imaging 2013; 40: 1345-55.
14. Song SY, Kim JH, Ryu JS, Lee GH, Kim SB, Park SI, Song HY, Cho KJ, Ahn SD, Lee SW, et al. FDG-PET in the prediction of pathologic response af- ter neoadjuvant chemoradiotherapy in locally advanced, resectable eso- phageal cancer. Int J Radiat Oncol Biol Phys 2005; 63: 1053-9.
15. Hyun SH, Choi JY, Shim YM, Kim K, Lee SJ, Cho YS, Lee JY, Lee KH, Kim BT. Prognostic value of metabolic tumor volume measured by 18F-fluo- rodeoxyglucose positron emission tomography in patients with esopha- geal carcinoma. Ann Surg Oncol 2010; 17: 115-22.
16. Choi ES, Ha SG, Kim HS, Ha JH, Paeng JC, Han I. Total lesion glycolysis by 18F-FDG PET/CT is a reliable predictor of prognosis in soft-tissue sar- coma. Eur J Nucl Med Mol Imaging 2013; 40: 1836-42.
17. Moon SH, Hyun SH, Choi JY. Prognostic significance of volume-based PET parameters in cancer patients. Korean J Radiol 2013; 14: 1-12.
18. Chen HH, Chiu NT, Su WC, Guo HR, Lee BF. Prognostic value of whole- body total lesion glycolysis at pretreatment FDG PET/CT in non-small cell lung cancer. Radiology 2012; 264: 559-66.
19. Arslan N, Tuncel M, Kuzhan O, Alagoz E, Budakoglu B, Ozet A, Ozgu- ven MA. Evaluation of outcome prediction and disease extension by quantitative 2-deoxy-2-[18F] fluoro-D-glucose with positron emission tomography in patients with small cell lung cancer. Ann Nucl Med 2011;
25: 406-13.
20. Moon SH, Choi JY, Lee HJ, Son YI, Baek CH, Ahn YC, Park K, Lee KH, Kim BT. Prognostic value of 18F-FDG PET/CT in patients with squa- mous cell carcinoma of the tonsil: comparisons of volume-based meta- bolic parameters. Head Neck 2013; 35: 15-22.
21. Yoo J, Choi JY, Lee KT, Heo JS, Park SB, Moon SH, Choe YS, Lee KH, Kim BT. Prognostic significance of volume-based metabolic parameters by (18)F-FDG PET/CT in gallbladder carcinoma. Nucl Med Mol Imag- ing 2012; 46: 201-6.
22. Hatt M, Le Pogam A, Visvikis D, Pradier O, Cheze Le Rest C. Impact of partial-volume effect correction on the predictive and prognostic value of baseline 18F-FDG PET images in esophageal cancer. J Nucl Med 2012;
53: 12-20.
23. Li YM, Lin Q, Zhao L, Wang LC, Sun L, Dai MM, Luo ZM, Zheng H, Wu H. Pre-treatment metabolic tumor volume and total lesion glycolysis are useful prognostic factors for esophageal squamous cell cancer patients.
Asian Pac J Cancer Prev 2014; 15: 1369-73.
24. Aquino SL, Halpern EF, Kuester LB, Fischman AJ. FDG-PET and CT features of non-small cell lung cancer based on tumor type. Int J Mol Med 2007; 19: 495-9.
![Fig. 2. Overall survival. (A) Total patients; Upper line, T1,T2 (n = 18; 40.8 months, 95% confidence interval [CI], 21.56-60.10) and lower line, T3, T4 (n = 15; 32.3 months, 95% CI, 20.46-44.20)](https://thumb-ap.123doks.com/thumbv2/123dokinfo/5139388.93158/5.892.94.799.100.723/overall-survival-total-patients-upper-confidence-interval-months.webp)