†
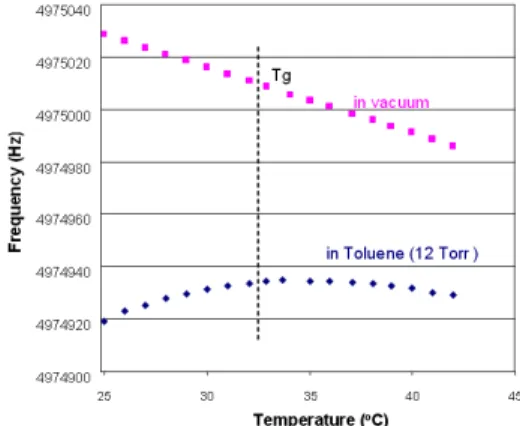
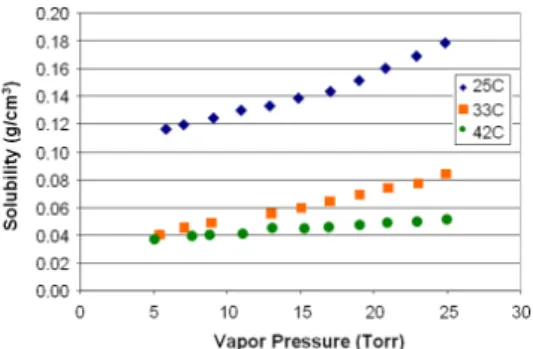
Measurement of Toluene Solubility in PVAc Using a Quartz Crystal Microbalance
7
0
0
전체 글
(2)
(3)
(4)
(5)
(6)
(7)
수치


관련 문서
Transmittance values of hexane/toluene solutions containing heavy oil with/without the PSMAA copolymers of various acid contents as a function of revolution time....
- All single-crystal grains within the aggregate experience the same state of deformation (strain);. experience the same state
A crystal plane at an angle θ to the close-packed plane will contain broken bonds in excess of the close-packed plane due to the atoms at the steps..
a second phase forms because of the limited solubility of zinc in
– extra half-plane of atoms inserted in a crystal structure – b perpendicular (⊥) to dislocation line..
The slip system ( =Slip plane + Slip direction) depends on the crystal structure of the metal and is such that the atomic distortion that accompanies the motion of a dislocation
In sum-frequency generation, UV beam output power improved 1.4 times greater with walk-off compensator, and 2-crystal set as sum-frequency generation crystal improved
As a result we should improve the potential that HVPE with high growth rate can become a new AlN crystal growth method because the high-quality
