This is an Open Access article distributed under the terms of the Creative Commons Attribution Non-Commercial License (http: //creativecommons.org/licenses/by- nc/4.0/) which permits unrestricted non-commercial use, distribution, and reproduction in any medium, provided the original work is properly cited.
Copyright: © 2021 Korean Journal of Agrcultural Science
ENGINEERING
Quantitative analysis of glycerol concentration in red wine using Fourier transform infrared spectroscopy and chemometrics analysis
Rahul Joshi
1, Ritu Joshi
1, Hanim Zuhrotul Amanah
1, Mohammad Akbar Faqeerzada
1, Praveen Kumar Jayapal
1, Geonwoo Kim
2,*, Insuck Baek
2, Eun-Sung Park
3, Rudiati Evi Masithoh
4, Byoung-Kwan Cho
1,3,*1
Department of Bio-systems Machinery Engineering, College of Agricultural and Life Science, Chungnam National University, Daejeon 34134, Korea
2
Environmental microbial and Food Safety Laboratory, Agricultural Research Service, United States Department of Agriculture, Beltsville, MD 20705, USA
3
Department of Smart Agriculture Systems, College of Agricultural and Life Science, Chungnam National University, Daejeon 34134, Korea
4
Department of Agricultural and Biosystems Engineering, Faculty of Agricultural Technology, Gadjah Mada University, Yogyakarta 55281, Indonesia
*
Corresponding authors: [email protected], [email protected]
Abstract
Glycerol is a non-volatile compound with no aromatic properties that contributes significantly to the quality of wine by providing sweetness and richness of taste. In addition, it is also the third most significant byproduct of alcoholic fermentation in terms of quantity after ethanol and carbon dioxide. In this study, Fourier transform infrared (FT-IR) spectroscopy was employed as a fast non-destructive method in conjugation with multivariate regression analysis to build a model for the quantitative analysis of glycerol concentration in wine samples. The samples were prepared by using three varieties of red wine samples (i.e., Shiraz, Merlot, and Barbaresco) that were adulterated with glycerol in concentration ranges from 0.1 to 15% (v·v
-1), and subjected to analysis together with pure wine samples. A net analyte signal (NAS)-based methodology, called hybrid linear analysis in the literature (HLA/GO), was applied for predicting glycerol concentrations in the collected FT-IR spectral data. Calibration and validation sets were designed to evaluate the performance of the multivariate method.
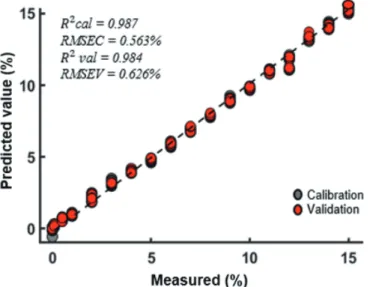
The obtained results exhibited a high coefficient of determination (R
2) of 0.987 and a low root mean square error (RMSE) of 0.563% for the calibration set, and a R
2of 0.984 and a RMSE of 0.626% for the validation set. Further, the model was validated in terms of sensitivity, selectivity, and limits of detection and quantification, and the results confirmed that this model can be used in most applications, as well as for quality assurance.
Keywords: fourier transform infrared (FT-IR) spectroscopy, glycerol, hybrid linear analysis, net analyte signal, wine adulteration
OPEN ACCESS
Accepted: May 13, 2021 Revised: May 11, 2021 Received: March 09, 2021
Citation: Joshi R, Joshi R, Amanah HZ, Faqeerzada MA, Jayapal PK, Kim G, Baek I, Park ES, Masithoh RE, Cho BK.
2021. Quantitative analysis of glycerol concentration in red wine using Fourier transform infrared spectroscopy and chemometrics analysis. Korean Journal of Agricultural Science 48:299-310.
https://doi.org/10.7744/kjoas.20210023
Introduction
The wine is a common consuming food product in our daily life and its quality measurement is of critical significance for wine classification and target marketing. The quality of wine influences several major aspects, including the wine quality rating, the reputation of the winery, and its profitability (Schamel and Anderson, 2003). The medicinal use of red wine has been estimated to dates back to 2200 BC, making it the oldest known medicine (Robinson, 2014).
Glycerol (C
3H
8O
3), which is a by-product of alcoholic fermentation in wines, is a non-volatile compound that has no aromatic properties but contributes significantly to wine quality by providing sweetness and fullness. Glycerol influences the sensory characteristics of wine by contributing richness of taste (Nieuwoudt et al., 2002) and aroma perception (Lubbers et al., 2001). Several European countries already use glycerol content in wine for quality scaling. Generally, glycerol concentration in wine varies between 1 and 10 g·L
-1(Rankine and Bridson, 1971; Ough et al., 1972), although glycerol levels in red wine are higher when compared to white wines. The glycerol content in wine is set to be within a limit of 6 - 10 g per 100 g of alcohol, in accordance with the level of alcohol in wine (Popescu-Mitroi et al., 2014). Wines containing glycerol/
alcohol below 6.5% are considered as fortified, while wines with a ratio exceeding 10% most likely contain artificially added glycerol (Beleniuc et al., 2013). The glycerol present in wine plays a very important physiological role in the human body, in that it esterifies blood-free fatty acids. Consequently, it can cause a decrease in cholesterol, which thickens blood vessel walls.
In addition, the consumption of wines rich in glycerol favors the formation of prostacyclins, which are agents responsible for the dilation of blood vessels (i.e., reducing blood pressure) (Popescu-Mitroi et al., 2014). Thus, the quantification of glycerol in wines represents an important step in providing and facilitating wine quality certification.
Numerous analytical methods, including gas chromatography (Csutorás et al., 2014), electronic (Buratti et al., 2004) nose, high-performance liquid chromatography (Parpinello and Versari, 2000), gas chromatography-combustion-isotope ratio mass spectrometry (Calderone et al., 2004), have been commonly applied to the detection and quantification of glycerol concentration in wines to date. Further, analytical approaches employing immobilized enzymes in combination with various analytical techniques have been used for the determination of glycerol in wines (Nunes Fernandes et al., 2004). These conventional methods are very useful and reliable, however, they are also invasive, time-consuming, and not suitable for the increasing demands of real-time and on-line analyses of large quantities of samples. Thus, it is necessary to develop a method that would permit efficient and quantitative detection of glycerol concentration in red wines.
In the past, Raman spectroscopy (Martin et al., 2015) and near-infrared (NIR) spectroscopy (Ferrari et al., 2011) was used as a screening tool for the quality measurement of wines. Though, the following spectroscopic techniques have several analytical applications in the food and agriculture sectors (Hong et al., 2013; Amanah et al., 2020; Joshi et al., 2020, Faqeerzaada et al., 2020), still they suffered from certain limitations while dealing with fluorescence and overtones- combinations bands generating during spectral acquisitions. Thus, Fourier transform infrared spectroscopy is one of key solution while dealing with the former issues, by measuring fundamental vibrations of molecules. Fourier transform infrared (FT-IR) spectroscopy, is a non-destructive and label-free method used for the analysis of gases, liquids, and solids.
In principle, infrared (IR) spectroscopy offers several advantages such as real-time monitoring and low maintenance when
compared to gas chromatography. In addition, it is less expensive and provides more specific structural information than
mass spectrometry (Doyle, 1992). The utility of FT-IR spectroscopy for the determination of glycerol concentration in wines
was demonstrated in several studies employing immobilized enzymes in combination with various analytical techniques
(Nunes Fernandes et al., 2004).
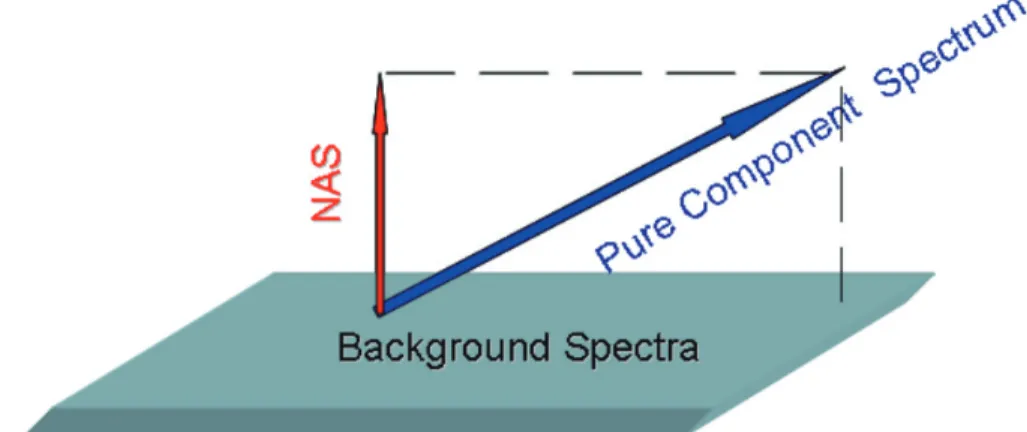
Although FT-IR spectroscopy has numerous applications in food quality measurement i.e benzene in edible oils (Joshi et al., 2019), protein and glucose of tubor and root flours determination using NIR and MIR spectroscopy (Masithoh et al., 2020) etc, the application of this technique to quality and authenticity measurements and the subsequent visual examination of the collected spectra do not provide sufficient information. Thus, it is necessary to exploit multivariate data analysis for extracting significant information from the obtained spectral data. In analytical chemistry, the purpose of multivariate analysis is data reduction, grouping, and classification, with the objective to develop a model that would specify the relationships that exists between variables (Seo et al., 2019). To this end, Lorber (1986) proposed the concept known as the net analyte signal (NAS), which describes the portion of the spectrum of a pure target analyte that is orthogonal to the background spectrum, which contains all the spectral components with the exception of the analyte. For dimensional reduction of the background spectra, combination of principal component analysis (PCA or PLS) is applied typically with NAS to reduce time and enhance performance (Lorber, 1986; Lorber et al., 1997).
The main objective of the present work is to demonstrate that the combination of FT-IR spectroscopy with NAS multivariate analysis can serve as a rapid, non-invasive, and high-throughput system for the quantitative determination of glycerol concentration in red wines non-destructively.
Materials and Methods
Sample preparation
Glycerol (> 98%) was purchased from Sigma Aldrich (St. Louis, MO, USA). Red wine with different brands (3 bottles from each brand) such as Shiraz, Merlot and Barbaresco from Australia, Chile and Italy were purchased from local wine shops in Korea and the samples were adulterated with different compositions of glycerol concentrations (0.1, 0.5, 1, 2, 3, 4, 5, 6, 7, 8, 9, 10, 11, 12, 13, 14, and 15% v·v
-1) in a total volume of 40 mL. Further, the adulterated wine samples were transferred to individual snap-cap vials; then, the vortex mixer high-speed Vortex Gene2 (Scientific Industries, Inc., N.Y., USA) was used for 40 s to achieve the uniform solution. These ranges were selected in order to determine the adulterant detection limit in red wine. Ten replicates of each samples were selected from each of the eighteen adulterated groups with different amount of adulterant present. A total of 180 samples spectra were collected for each variety of wine (i.e., Shiraz, Merlot, and Barbaresco) from different countries, i.e., 540 samples were prepared for FT-IR spectroscopic measurement.
FT-IR spectroscopy
The collection of infrared spectra was performed using a Nicolet 6700 FT-IR spectrometer (Thermo Scientific Co., Waltham, MA, USA) configured in the attenuated total reflectance (ATR) sampling mode, and equipped with, a deuterated
triglycine sulfate (DTGS) detector, and KBr beam splitter controlled by OMNIC software (Nicolet 6700, Thermo Fisher Scientific, Seoul, Korea). The spectra were collected separately for each sample at a wavelength range from 4,000 to 650 cm
-1