Introduction
As the interest in precision agriculture and in maintenance of a safe and healthy environment increases, so does the need for direct and fast monitoring methods for nutrients in soils (Shaviv et al., 2003; Linker et al., 2005; Linker et al., 2006). For direct and rapid measurement of nitrate, several promising sensing devices have been developed, including ion selective electrodes, ion sensitive field effect transistors, and near- (NIR) and mid-infrared (MIR) spectroscopy (Linker, 2004). In particular, mid-infrared spectroscopy, namely Fourier transform infrared spectroscopy (FTIR), has emerged as an important analytical tool in both quantification and identification of multi-atomic inorganic ions such as nitrate (Verma and Deb, 2007).
Specific spectral signatures of many chemicals of interest, including nitrate, have been identified in the MIR range due to t he fundamental absorption peaks and make a unique calibration curve possible (Ehsani et al., 2001).
Attenuated total reflectance (ATR) of FTIR has been
used for measurement of liquid, paste, and powder type of samples. For ATR-FTIR measurement of soils, moist samples have been used in order to enhance adhesion between a sample and ATR crystal that holds it. A less treated sample is preferred to direct and rapid determination. In order to minimize sample preparation procedures for FTIR measurement and to directly use dry soils, diffuse reflectance Fourier transform infrared spectroscopy (DRIFTS) approaches have been widely accepted (van Groenigen et al., 2003). There are several studies on DRIFTS for characterizing and quantifying soil components as well as aerosol. Niemeyer et al.
(1992) estimated relative concentrations of organic matter functional groups using DRIFTS rather than absolute concentrations because of extreme sensitivity of the equipment to homogeneity of the soil/matrix material mixture used. Verma and Deb (2007) quantitatively measured nitrate in soil and aerosol samples via DRIFTS technique and showed the applicability in wide concentration ranges of nitrate because of the limit of detection (LOD) of the method, 0.07 mg kg
-1.
For soil nitrate determination with the least sample treatment (drying and grinding), DRIFTS spectra was
Received : June 20. 2008 Accepted : August 3. 2008*Corresponding author: Phone : +82629702442, E-mail : [email protected]
Direct Determination of Soil Nitrate Using Diffuse Reflectance Fourier Transform Spectroscopy (DRIFTS)
Eunyoung Choe
1, Kyoung-Woong Kim
2,
*Suk Young Hong
1, and Ju-Yong Kim
21
Soil & Fertilizer Management Division, National Academy of Agricultural Science, RDA, 150 Suinro, Gwonseon-gu, Suwon 441-707, Republic of Korea
2
Department of Environmental Science and Engineering, Gwangju Institute of Science and Technology, 261 Cheomdan-gwagiro, Buk-gu, Gwangju 500-712, Republic of Korea
Mid-infrared (MIR) spectroscopy, particularly Fourier transform infrared spectroscopy (FTIR), has emerged as an important analytical tool in quantification as well as identification of multi-atomic inorganic ions such as nitrate. In the present study, the possibility of quantifying soil nitrate via diffuse reflectance infrared Fourier transform spectroscopy (DRIFTS) without change of a sample phase or with least treated samples was examined. Four types of soils were spectrally characterized in terms of unique bands of soil contents and interferences with nitrate bands in the range of 2000-1000 cm
-1. In order to reduce the effects of soil composition on calibration model for nitrate, spectra transformed to the 1st order derivatives were used in the partial least squared regression (PLSR) model and the classification procedure associated with input soil types was involved in calibration system. PLSR calibration models for each soil type provided better performance results (R
2>0.95, RPD>6.0) than the model considering just one type of soil as a standard.
Key words: DRIFTS, Mid-infrared, Quantification, Soil nitrate
used to the prediction of soil nitrate in this study. This paper presents the characterization of spectral absorption peaks of nitrate in the MIR range and the feasibility of a calibration soil nitrate contents in solid samples using DRIFTS. The calibration was based on a partial least square regression (PLSR) model and included an identification of soil types (thus differently applied depending on soil types) to reduce spectral interferences from soil CaCO
3and organic matter (OM).
Materials and Methods
Experimental samples Farmland soils (FS) and three kinds of typical agricultural field soils(sand (AH), clay (WA), and peat (ZE)) were used in the spectral measurement. Soils were dried and sieved to less than 120 mm (80 mesh). The soil characteristics of soils were described in Table 1. Soils initially contained relatively low concentrations of nitrate (0.04-48.6 mg [N] L
-1).
Forthe calibration,0, 15, 32, 68, 149, 270, 547, 776, and 1923 mg [N] L
-1of KNO
3solution was spiked into soils.
Two-gram samples of air-dried farmland soil (< 2 mm) and 2 mL of KNO
3solution, of which pH was adjusted to approximately 4, were added to 15 mL plastic centrifuge tubes. The pH in solution was adjusted because acidic soil is known to be able to retain NO
3-(Cahn et al., 1992) even though nitrate is considered to be mobile in saturated soil-water systems (Roy and Krapac, 2006).
Samples were agitated for 10 h with irregularly stirring and then dried in the oven at 50℃ for 24 h. The concentration of nitrate was analyzed by ion chromatography (Dionex, ICS-2000, USA). For ATR- FTIR measurements, a saturated soil paste was prepared by adding KNO
3solution including 1923 mg [N] L
-1nitrate to soil samples (ratio 0.8) in order to increase adhesion between the sample and the ATR crystal.
Spectral measurement DRIFTS spectra of 45 soil samples were measured in the range of 4000-700 cm
-1using a FTIR spectrometer (FT-IR 4000, JASCO inc., Japan) equipped with a triglycine sulfate (TGS) detector and a diffuse reflectance (DR) accessory (EasiDiff, Pike Technologies, Madison, Wisc.). A ZnSe horizontal crystal was used for ATR-FTIR spectrometer. The average of 100 successive scans was recorded. The DR accessory features downward-looking optics containing advantages of high throughput, constant optical path with all mirrors positioned above the sampling area.
Absorbance signals of solution and soil paste samples were measured using FTIR spectrometer.
The measured spectra were smoothed by means of a 21-points Savitzky-Golay (1964) smoothing filter and their first order derivatives were obtained by calculating polynom. The spectral characterization was carried out by means of peak searching with FTIR spectral library (IR Mentor Pro 6.5, Bio-Rad Laboratories Inc., USA).
Calibration procedure Prior to a calibration procedure, the absorption peaks in the spectra were identified using spectral library. Based on soil types, different calibration equations were developed to minimize spectral interferences of nitrate caused by soil composition such as minerals and organic matter. The suitable range of wavenumber for calibration model was selected by means of the Pearson’s correlation coefficient (r) between absorbance spectrum and wavenumber.
Partial least square regression (PLSR) model was used in estimate of soil nitrate. In order to assess the performance of calibration models, the training set was cross-validated using some parameters such as determination coefficient (R
2), root mean square errors (RMSE), and ratio of prediction to deviation (RPD) values.
Results and Discussion
Qualitative analysis of spectra The nitrate absorption peaks in the mid-infrared range were obtained by DRIFTS and ATR-FTIR spectra of soil samples containing 1923 mg [N] kg
-1nitrate (Fig. 1). Both DRIFTS and ATR-FTIR spectra showed unique nitrate bands in a range of 1500-1200 cm
-1. While the ATR- FTIR spectrum of the moist sample (paste phase) had strong and broad peaks of water that reduce signals of minerals and organic matters, the DRIFTS spectrum of the dry soil showed various absorption peaks of soil constituents.
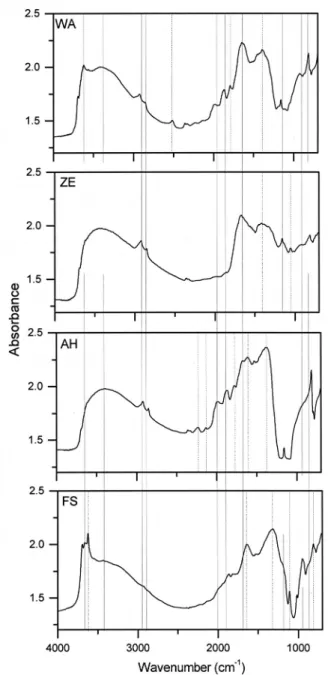
In Fig. 2, the DRIFTS spectra of four soil types
indicated different unique peaks for various soil
compositions in the range of 2000-500 cm
-1. The
observed peak bands in the MIR range are interpreted in
Table 2. The common peaks of each soil at 3636, 3395,
2931, 1878, 1662, and 1170 cm
-1were associated with
OH, CH, CO functional groups. Their different peak
assignments were shown at 1317, 1418, 1392, and 1613,
1522.5, and 1374 cm
-1, respectively. The peat type of soil
(ZE), which included 46-56.7% of organic matter (Table
1), had a spectral evidence of carbo-acid O-H. The unique bands of each soil type in the range 2000-1000 cm
-1might have caused hiding or exaggerating the absorption peak at analyte bands (i.e. nitrate) and led to decrease in the prediction quality.
Quantitative determination of soil nitrate using DRIFTS spectra The spectra transformed to first order derivatives, shown in Fig. 3, indicate discrete responses to the amount of nitrate in soils in the range of 1550-1200 cm-1 without spectral preprocessing such as background removal. The transformed spectra within the range of 1510-1280 cm
-1were used in the calibration model.
Initially, FS samples were applied to partial least square regression (PLSR) calibration as a standard for prediction of other samples. The cross validation of training set, FS samples, showed a high quality of performance with a determination coefficient of 0.981, as shown in Fig. 4.
However, the prediction performance of other types of soil samples based on the standard calibration equation was unsatisfactory (the result not shown). As mentioned above, nitrate peak bands of dry soil samples might have been exaggerated or hidden by spectral interference of soil components such as minerals and organic matters
(including carbonate, carboxyl group, and alkanes).
Hence, the spectral intensity of nitrate peaks without proper pretreatments may result in decrease in prediction quality. In order to minimize the interferences from soil components, the representative soil types were
Fig. 1. The nitrate peak bands in ATR-FTIR and DRIFTSspectra of soil samples containing 1923 mg [N] kg-1nitrate;
absorption peaks in ATR-FTIR spectra of moist soils (solid line) and in DRIFTS spectra of dry soils (dotted line).
Fig. 2. Typical spectra of four soil types, clay (WA), peat (ZE), sand (AH), and sandy loam (FS), measured by diffuse reflectance infrared Fourier transform spectroscopy (DRIFTS).
Sample ID Texture or Soil type pH OM C CaCO3 Native NO3-N
Sandy Loam Sand Clay Peat
6.8 5.4 7.3 5
5.6 3.9 8.6 51.5
3.3 2.0 3.9 25.8
0 0.1 7.1 0.2
10.04 18.4 21.1 50.0 FS
AH WA ZE
mg kg-1 --- % ---
Table 1. Summary of soil properties.
characterized against the major interfering soil components to the unique spectral bands of nitrate. Each soil type had a different wavenumber highly related with the nitrate peak: 1350 and 1500 cm
-1for FS, 1490-1425 and 1320-1290 cm
-1for ZE, 1450 cm
-1for AH, and 1300- 1250 cm
-1for WA. The suitable wavenumbers for nitrate determination in association with soil types were used in
each calibration procedure. The results of each calibration are described in Table 3. The validation parameters indicated a good performance of the calibration system including classification procedure in association with soil type (sandy loam, sand, peat, and clay). The prediction of FS, AH, WA, and ZE showed a reliable results with R
2>
0.94 and RPD > 6.5, indicating a strong statistical
Fig. 3. The 1stderivative spectra of FS soils used in PLSRcalibration; Arrows indicate an increasing direction of nitrate
concentrations. Fig. 4. Predicted vs. measured NO3concentrations in the FS
soil.
Sample ID
Common bands in soil spectra
Common bands in soil spectra
Wavenumber (cm-1)
3636 3395 2931.3 1878.3 1662.3
1170 FS,AH,
ZE, WA
Assignment
Water vapor OH stretching mode Silicon O-H stretching mode Alkanes CH asymmetry stretching mode
Sulfur H3O
Aldehydes C=O stretching mode, Carbo-acid C=O stretching mode Alcohols C-O stretching mode
1323.7 1382.7 1624.7 1428 2529 FS
AH
ZE WA
Amides C-N stretching mode Alkanes CH deformation mode Amides NH2deformation mode Carbo-acid O-H deformation mode
Sulfur O-H stretching mode Table 2. Wavenumbers of the observed bands and the assigned functional groups in the MIR range.
Sample ID
"
standard deviation of prediction
‡root mean square errors ratio of prediction to deviation
RPD RMSE‡
SDP"
R2 0.96 0.96 0.95 0.95 FS
AH WA ZE
613.16 234.48 288.04 696.65
84.13 33.90 40.54 106.50
7.36 7.00 7.19 6.63 Table 3. Performance results of the calibration system which combined with soil type classification for FS, AH, ZE, and WA.
correlation between measured and predicted values.
However, the prediction results for ZE were relatively poorer than others, giving lower RPD (=6.6) and R
2(=0.95) and higher RMSE (>100). Though these parameters still indicated a high quality of prediction, the poor prediction result of peat type soil (ZE) might have been caused by interferences of OM (46.3-56.7%) including carboxyl group that has peak band at 1428 cm
-1.
Conclusions
This study focused on the feasibility to apply diffuse reflectance infrared Fourier transform spectroscopy (DRIFTS) to quantitative determination for nitrate in dry soils, less treated and almost raw samples which are available to real-time sensing. Four different types of soils were spectrally characterized in terms of unique bands of soil contents and interferences with nitrate bands in the range of 2000-1000 cm
-1. The use of transformed spectra to first order of derivatives and classification procedure for input soil types in the partial least squared regression (PLSR) model in calibration system provided better performance results than model considering just one type of soil as a standard. Each prediction result showed reliable values (R
2>0.94 and RPD>6.6). Through DRIFTS measurement using less treated soil samples, soil nitrate determination would be faster and closer to real-time sensing while the complicated spectral signatures in those samples could interfere with nitrate peak bands. For the expanded application, more soil types should be spectrally characterized as a spectral library for the classification procedure.
Acknowledgements
The authors would like to acknowledge Laboratory for Environmental-oriented Electrochemical Engineering (LEEE), Gwangju Institute of Science and Technology (GIST), for supporting FTIR measurements. Dr. Caroline van der Salm of Wageningen University is acknowledged for providing field soil samples.
References
Cahn, M.D., D.R. Bouldin, and M.S. Cravo. 1992. Nitrate sorption in the profile of an acid soil. Plant and Soil, 143: 179-183.
Ehsani, M.R., S.K. Upadhyaya, W.R. Fawcett, L.V. Protsailo, and D. Slaughter. 2001. Feasibility of detecting soil nitrate content using a mid-infrared technique. American Society of Agricultural Engineers 44(6) 1931-1940.
Linker, R. 2004. Waveband selection for determination of nitrate in soil using mid-infrared attenuated total reflectance spectroscopy.
Applied Spectroscopy 58(11): 1277-1281.
Linker, R., I. Shmulevich, A. Kenny, and A. Shaviv. 2005. Soil identification and chemometrics for direct determination of nitrate in soils using FTIR-ATR mid-infrared spectroscopy. Chemosphere 61(5): 652-658.
Linker, R., M. Weiner, I. Shmulevich, and A. Shaviv. 2006. Nitrate Determination in Soil Pastes using Attenuated Total Reflectance Mid-infrared Spectroscopy: Improved Accuracy via Soil Identification. Biosystems Engineering 94(1): 111-118.
Niemeyer, J., Y. Chen, and J.-M. Bollag. 1992. Characterization of humic acids, composts, and peat by diffuse reflectance Fourier- transform infrared spectroscopy. Soil Science Society of America Journal 56(1): 135-140.
Roy, W.R., and I.G. Krapac. 2006. Potential soil cleanup objectives for nitrogen-containing fertilizers at agrichemical facilities. Soil &
Sediment Contamination 15: 241-251.
Savitzky, A., and M.J.E. Golay. 1964. Smoothing and differentiation of data by simplified least squares procedures. Analytical Chemistry 36 (8): 1627-1639.
Shaviv, A., A. Kenny, I. Shmulevitch, L. Singher, Y. Raichlin, and A. Katzir. 2003. Direct monitoring of soil and water nitrate by FTIR based FEWS or membrane systems. Environmental Science and Technology 37(12): 2807-2812.
Van Groenigen, J.W., C.S. Mutters, W.R. Horwath, and C. Van Kessel. 2003. NIR and DRIFT-MIR spectrometry of soils for predicting soil and crop parameters in a flooded field. Plant and Soil, 250(1): 155-165.
Verma, S.K., and M.K. Deb. 2007. Nondestructive and rapid determination of nitrate in soil, dry deposits and aerosol samples using KBr-matrix with diffuse reflectance Fourier transform infrared spectroscopy (DRIFTS). Analytica Chimica Acta 582 (2):
382-389.
현장에서의 토양 측정을 위해서는 전처리 과정이 짧을수록 유리하므로 최대한 처리를 하지 않은 토양 시료에 대해 질산태 질소의 측정과 그에 맞는 정량화 방법을 제안하였다. 건조 토양을 분광분석에 그대로 사용하는 경 우 산란, 분산되는 빛의 양이 많고 노이즈도 증가하므로 Diffuse reflectance 모드 (Diffuse reflectance infrared Fourier transform spectroscopy: DRIFTS)로 측정하였다. 토양 자체가 나타내는 분광 피크에 의해 질산염의 피 크가 가려지는 간섭효과를 보완하기 위해 DRIFTS 스펙트럼에 1차 도함수를 적용하였으며, 1500-1200 cm-1 영 역에서 질산염에 의한 신호의 향상이 확인되었고, 이를 이용해 다변량 회귀분석 모델 (PLSR)을 적용하여 정량 화를 수행하였다. 1차 도함수를 이용한 분석모델에서도 각기 다른 종류의 토양을 적용하였을 때 결과치의 신뢰 도가 감소하는 결과가 나타났다. 대표적인 토양으로 사질 (sand), 미사질 (sandy loam), 토탄질 (peat), 점토질 (clay) 토양에 대해 각각의 스펙트럼을 특성화하여 해당되는 정량모델을 적용하였다. 그 결과 다양한 종류의 토양에 대한 정량분석의 신뢰도가 향상되었다 (R2
>0.95, RPD>6.0). 스펙트럼의 신호처리와 토양 특성별 정량모 델의 적용을 통해 현장 시료에 가까운 상태의 토양 질산염을 보다 빠르고 간단하게 평가할 수 있을 것으로 기 대되며, 향후에 보다 다양한 조건의 토양에 대해 분광학적 분석을 수행하여 라이브러리가 구축된다면 이러한 기술의 확대 적용이 가능할 것으로 사료된다.
중적외선 분광학을 이용한 토양 내의 질산태 질소 정량분석
최은영1·김경웅2,*·홍석영1·김주용2
1