농촌지역 여중생의 골밀도와 신체활동*
신영호1), 김판수2)
경북대학교 대학원 체육학과1), 용인대학교 무도대학 유도학과2)
Bone Mineral Density of Middle School Female Students with Three Level of Physical Activity in Rural Area
Young-Ho Shin1), Pan-Soo Kim2)
Department of Physical Education, Graduate School, KyungPook National University
1)College of Martial Arts, Department of Judo, YongIn University
2)= 국문초록 =
이 연구의 목적은 농촌지역 여중생의 골밀도와 신체활동량을 비교하는 것이다. 연구 대상자는 경상북도 달성군 D 중학교 여중생 65명이었으며, 이들을 일일 도보수에 따라 하루에 4,800 미만은 저활동군 (Low PA), 4,800 - 6,300 미만은 중간활동군 (Moderate PA) 그리고 6,300 이상은 고활동군 (High PA) 으로 분류하였다. 그룹 간 요추, 대퇴부, 전완에서의 골밀도는 유의한 차이가 없었다. 하지만, 높은 신체 활동 집단에서는 우세손과 비우세손의 전완 골밀도 차이가 없었으나, 중간 및 낮은 신체활동 집단에서는 우세손과 비우세손의 전완 골밀도에서 유의한 차이가 나타났다. 신체활동이 적은 여자 청소년들이 우세 손과 비우세손의 골밀도 차이가 나타난다는 것은 보고된 적이 없다. 비록 해부학적으로 전완의 경우 중 력부하를 받는 뼈가 아닐지라도, 높은 신체활동은 비우세손의 골밀도까지 강화시킬 수 있다는 것을 보 여주었다. 따라서 향후 비교적 큰 표본과 장기간 연구를 통해 낮은 강도의 신체활동 효과에 대해 더 연 구할 필요가 있다고 사료된다.
주제어: 골밀도, 신체활동, 청소년
* 접수일(2014년 11월 7일), 수정일(2014년 12월 8일), 게재확정일(2014년 12월 19일)
* Corresponding author: 김판수, 경기도 용인시 처인구 용인대학로 134 용인대학교(우 449-714) 무도대학 유도학과
Pan-Soo Kim, Department of judo, College of Martial Arts, YongIn University, 134, Yongindaehak-ro, Cheoin-gu, Yongin-si, Gyeonggi-do, 449-714, Korea
Tel: +82-31-8020-2624, Fax: +82-31-8020-2882, Email: [email protected]
INTRODUCTION
Osteoporosis is a skeletal disease characterized by low bone density, resulting in an increased risk for bone fracture. This disease is a major public health problem worldwide [1-3]. Although there are effective treatments for primary prevention, mostly based on lifestyle changes, remains an essential goal to prevent both osteoporosis and its most serious consequence, namely, bone fractures. Lifestyle changes include keeping an appropriate nutritional intake, low alcohol intake, maintaining adequate calcium, and vitamin D consumption, and, last but not least, increasing physical activity [4,5].
In postmenopausal women, regular physical activity is useful for improving muscle strength and preventing falls, which is important because most fragility fractures are related to falls [6].
Regularly performing weight-bearing and resistance exercises is a major lifestyle measure for osteoporosis prevention [7]. Although the importance of physical activity is clearly emphasized by most guidelines, some of these fail to address what its desirable frequency and duration are [8]. The International Osteoporosis Foundation gives several examples of exercise schedules, one of which is “45 to 60 minutes of weight-bearing aerobic exercise three days per week (i.e., brisk walking)” [6].
Achieving an optimal peak bone mass (PBM), which is the highest potential bone mineral density (BMD) achieved during young adult life, is critical strategy for preventing osteoporosis [9]. Peak bone mass is attained through skeletal maturation and thus occurs in the third decade of life [10]. In general, before the age 20, the bone mass accrual is mostly marked between 11 and 14 years of age in girls. If an individual does not reach optimal PBM, they are at greater risk for osteoporosis
related bone fracture during both young and elderly life period. However, the previous study shows that a 3–5% increase in bone mass retained through adulthood may decrease future bone fracture risk by 20–30% [11]. Because lifestyle factors such as diet and weight-bearing exercise have been shown to affect BMD by up to 40%, it is important to examine various exercise types to determine effective methods of attaining optimal PBM [12]. healthy diet, mechanical loading, including performing resistance training, have shown to be effective at increasing BMD in young adults and thereby lowering risk of osteoporosis [13]. However, it is not yet clear whether physical activity addressed by daily steps may be associated with bone health, particularly in female adolescents.
Although physical activity may increase peak bone mass in children and adolescents [14], the role of physical activity in adolescent girls has been less explored [15].
Thus, it is necessary to determine the effectiveness of physical activity in adolescent girls. To address this area of uncertainty, the present study compared bone mineral density (BMD) in female adolescents with three levels of physical activity.
MATERIALS AND METHODS
1. Research Subjects
This cross-sectional, observational study included 65 adolescent female students divided in three groups, namely, low activity student (under 4,800 steps per day, n=22), moderate activity student between over 4,800 and under 6,300 steps per day (n=21), and high activity student (over 63,000 steps per day, n=22) after the physical activity was assessed by pedometer for 1 week and then determined the daily steps [16]. The dominant hand and leg
were determined by questionnaire. All subjects were female middle school students and also lived in rural area of Gyungsangbuk-do province.
The study was planned and conducted in compliance with the KyungPook National University (KNU) ethic committee. The purpose of the study was explained both orally and through a written document to each student, who then signed an informed consent if she agreed to participate.
2. Data collection for height, weight, physical activity and 1,200m running time
We used student physical examination data for height, weight of subjects. Physical activity was measured using the pedometer. We measured number of steps per day of subjects putting on the pedometer during a week and calculated average number of steps per day.
Subjects runned 1,200m and running time was measured by stop-watch.
3. Assessment of Bone Mass
We conducted the health examinations for this study in the autumn of 2012. The forearm BMD in both dominant and non-dominant hands determined by questionnaire, lumbar spine and femur BMD were measured using dual-energy X-ray absorptiometry (Hologic, Bedford, MA, USA). Measurement precision, which is expressed as the coefficient of
variation (CV), of the BMD measurements was 1.26% for the ulna, 1.73% for the radius, 0.89%
for the lumbar spine and 1.97% for the femur.
4. Statistical Analysis
Data are expressed as mean ± SD.
Two-way analysis of variance (ANOVA) was used to test the mean difference among groups. The paired t-test was used to test the mean difference between the dominant and non-dominant hands and legs. The p-values less than 0.05 were considered to be statistically significant.
RESULTS
1. Characteristics of participating subjects
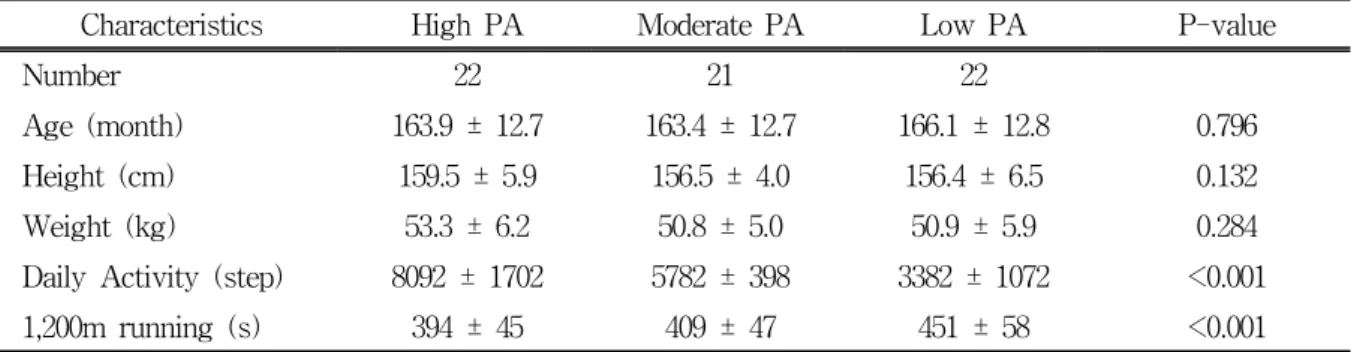
All subjects were female middle school students. Age, height, weight were not significantly different among high, moderate and low physical activity groups. Daily activity (steps per day) of high, moderate and low physical activity group was 8,092, 5,782 and 3,382 steps, respectively. The time (seconds) for 1,200 m running of high, moderate and low physical activity group was 394, 409 and 451 seconds, respectively. Daily activity (steps per day) and 1,200m running time (seconds) were significantly different among PA groups (p<0.01) (Table 1).Table 1. Characteristics of the Subjects
Characteristics High PA Moderate PA Low PA P-value
Number 22 21 22
Age (month) 163.9 ± 12.7 163.4 ± 12.7 166.1 ± 12.8 0.796
Height (cm) 159.5 ± 5.9 156.5 ± 4.0 156.4 ± 6.5 0.132
Weight (kg) 53.3 ± 6.2 50.8 ± 5.0 50.9 ± 5.9 0.284
Daily Activity (step) 8092 ± 1702 5782 ± 398 3382 ± 1072 <0.001
1,200m running (s) 394 ± 45 409 ± 47 451 ± 58 <0.001
Data are means ± SD.
2. BMD in the lumbar spine
BMDs of L1 were 1.050±0.120 g/cm2, 1.048±0.109 g/cm2, 1.045±0.114 g/cm2 in high PA, moderate PA, low PA, respectively. All BMD values of the lumbar spine were not significantly different among high, moderate and low physical activity groups (Table 2).
3. BMD in the femur
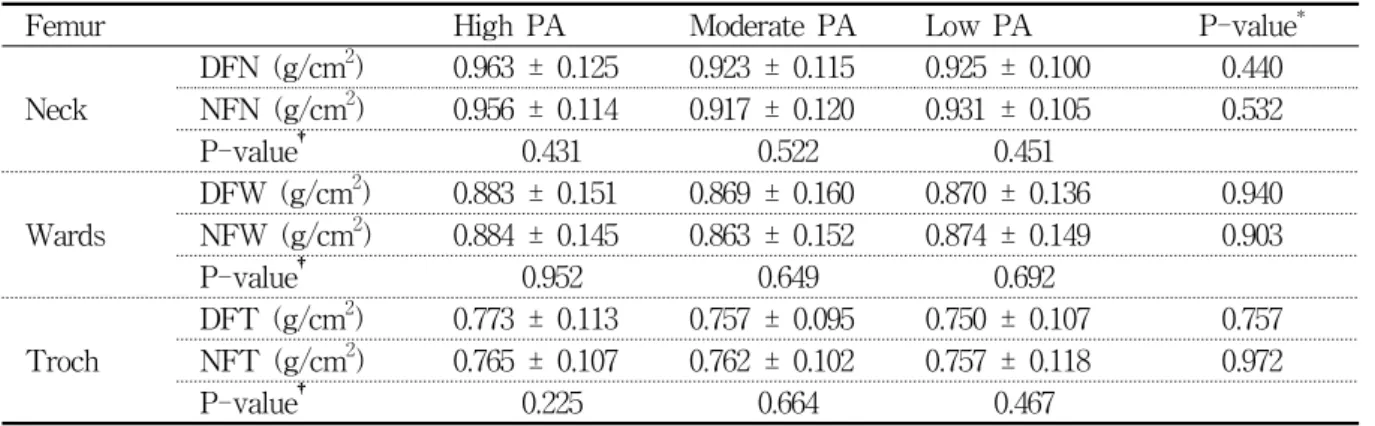
BMD values of neck, wards, and torch area in femur were not significantly different among high, moderate and low physical activity groups.
Also the BMD values of neck, wards, and torch area between the dominant and non-dominant leg were not significantly different among the high, moderate and low physical activity groups, respectively (Table 3).
4. BMD in the forearm
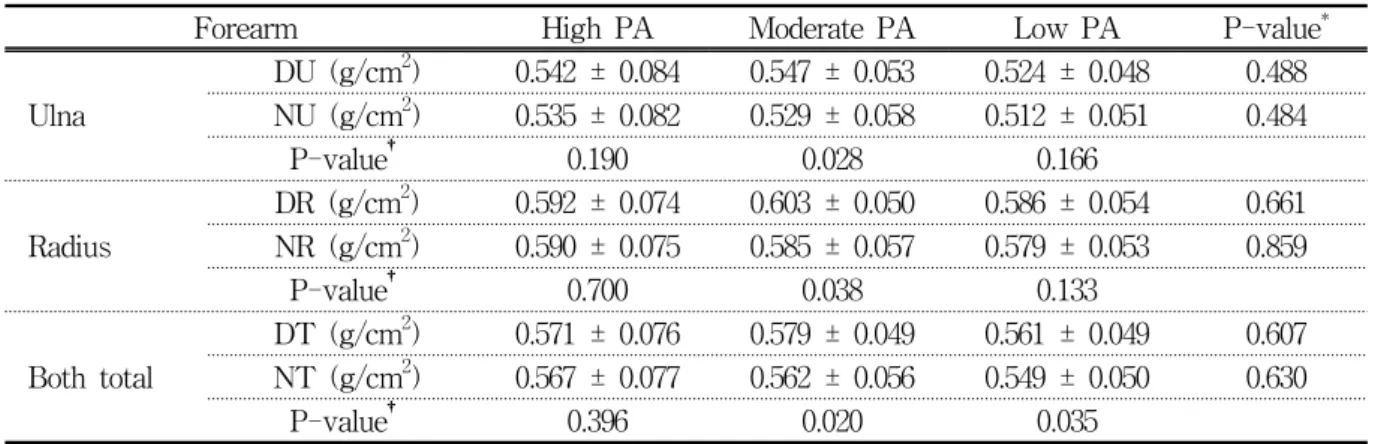
BMD values in the ulna, radius and total of
forearm were not significantly different among high, moderate and low physical activity groups.
In the comparison between dominant hand and non-dominant hand, the BMD values of the ulna (0.542 ± 0.084 vs. 0.535 ± 0.082 g/cm2), radius (0.592 ± 0.074 vs. 0.590 ± 0.075 g/cm2) and total (0.571 ± 0.076 vs. 0.567 ± 0.077 g/cm2) in the high physical activity group were not statistically different but those of the ulna, radius, and both total (total of the forearm) in the moderate (0.547 ± 0.053 vs. 0.529 ± 0.058 g/cm2, p<0.05; 0.603 ± 0.050 vs. 0.585 ± 0.057 g/cm2, p<0.05; 0.579 ± 0.049 vs. 0.562 ± 0.056 g/cm2, p<0.05, respectively) were statistically different between the non-dominant hand and the dominant hand and the BMD values of the both total (total of the forearm) in low physical activity group (0.561 ± 0.049 vs. 0.549 ± 0.050 g/cm2, p<0.05) was statistically different between the non-dominant hand and the dominant hand (Table 4).
Table 2. BMD of the lumbar spines (L1, L2, L3, L4)
Lumbar spine High PA Moderate PA Low PA P-value
L1 (g/cm2) 1.050 ± 0.120 1.048 ± 0.109 1.045 ± 0.114 0.990 L2 (g/cm2) 1.104 ± 0.124 1.098 ± 0.115 1.087 ± 0.118 0.890 L3 (g/cm2) 1.158 ± 0.131 1.136 ± 0.121 1.128 ± 0.123 0.711 L4 (g/cm2) 1.118 ± 0.124 1.099 ± 0.113 1.085 ± 0.125 0.652 Data are means ± SD. Lumbar 1, L1; Lumbar 2, L2; Lumbar 3, L3; Lumbar 4, L4.
Table 3. BMD of the femur neck, wards, troch
Femur High PA Moderate PA Low PA P-value*
Neck
DFN (g/cm2) 0.963 ± 0.125 0.923 ± 0.115 0.925 ± 0.100 0.440 NFN (g/cm2) 0.956 ± 0.114 0.917 ± 0.120 0.931 ± 0.105 0.532
P-value† 0.431 0.522 0.451
Wards
DFW (g/cm2) 0.883 ± 0.151 0.869 ± 0.160 0.870 ± 0.136 0.940 NFW (g/cm2) 0.884 ± 0.145 0.863 ± 0.152 0.874 ± 0.149 0.903
P-value† 0.952 0.649 0.692
Troch
DFT (g/cm2) 0.773 ± 0.113 0.757 ± 0.095 0.750 ± 0.107 0.757 NFT (g/cm2) 0.765 ± 0.107 0.762 ± 0.102 0.757 ± 0.118 0.972
P-value† 0.225 0.664 0.467
Data are means ± SD. Dominant femur neck, DFN; Dominant femur wards, DFW; Dominant femur troch, DFT; Non-dominant femur neck, NFN; Non-dominant femur wards, NFW; Non-dominant femur troch, NFT.
* Comparison among high, moderate, and low physical activity group by ANOVA
† Comparison between dominant and non-dominant by paired t-test
Table 4. BMD of the forearm(ulna, radius)
Forearm High PA Moderate PA Low PA P-value*
Ulna
DU (g/cm2) 0.542 ± 0.084 0.547 ± 0.053 0.524 ± 0.048 0.488 NU (g/cm2) 0.535 ± 0.082 0.529 ± 0.058 0.512 ± 0.051 0.484
P-value† 0.190 0.028 0.166
Radius
DR (g/cm2) 0.592 ± 0.074 0.603 ± 0.050 0.586 ± 0.054 0.661 NR (g/cm2) 0.590 ± 0.075 0.585 ± 0.057 0.579 ± 0.053 0.859
P-value† 0.700 0.038 0.133
Both total
DT (g/cm2) 0.571 ± 0.076 0.579 ± 0.049 0.561 ± 0.049 0.607 NT (g/cm2) 0.567 ± 0.077 0.562 ± 0.056 0.549 ± 0.050 0.630
P-value† 0.396 0.020 0.035
Data are means ± SD. Dominant ulna, DU; Dominant radius, DR; Dominant both total, DT; Non-dominant ulna, NU; Non-dominant radius, NR; Non-dominant both total, NT.
* Comparison among high, moderate, and low physical activity group by ANOVA
† Comparison between dominant and non-dominant by paired t-test
DISCUSSION
There was no significant difference in age, height, weight, or BMI among the three groups, while their physical activity level was significantly different. As the markers of cardiovascular fitness, the records of 1,200m running were significantly different among all three groups [17]. Thus, we verified the differences of physical activity level and cardiovascular fitness among three groups.
We observed that BMD in lumbar and femur regions were not significantly different among three groups. However, BMD values of ulna, radius and total of the forearm in high physical activity (H-PA) group were not significantly different between dominant and non-dominant hands, but those in moderate physical activity (M-PA) and total of the forearm in low physical activity (L-PA) groups were significantly different. While some studies reported significant influence of physical activity on BMD of lumbar and femur regions in adolescents [18,19], other studies have shown a no significant effect of physical activity on BMD at the lumbar spine, femoral neck, and
forearm [20,21]. VandenBergh [22] studied the relationship between physical activity, calcium intake, and bone mineral content (BMC) in children aged 7–11 years. They found increased BMC only in those with very high levels of physical activity, and the association was most pronounced in the more mature children. In this study, we did not observe that there were no significant different among three groups.
The reason that we did not observe the effect of physical activity in BMD of female adolescents in lumbar and femur regions might be due to the subject characteristics in this investigation. In general, the subjects whose BMD were significantly increased due to physical activity were mostly participated in somewhat high intensive sport programs compared to walking in this study [23,24].
Related to our above finding in which there was no significant different among three physical activity levels in the BMD of lumbar and femur regions, it has been suggested that the effects of physical activity and exercise may vary considerably depending on the developmental stage, or the Tanner stage, of the individual, but clear-cut data and evidence have not been
presented [22,25,26]. Despite this, it is interesting to review the findings and conclusions of these studies. Slemenda and Johnston [26] observed that in young female figure skaters the areal bone mineral densities (BMD) in the lower parts of the body were higher than in controls, but the difference was not evident until the midteens, despite the fact that all the girls had started training very early in life. In the current study, the differences of activity level among groups are relatively small in comparison with the previous studies and the physical condition of subjects is also still prior to midteens. In fact, limitations of this study include those inherent to cross-sectional comparison, a relatively small sample size, and the fact that physical activity was measured through the pedometer. Thus, we suggest that the further study is needed for the effects of relatively low intensity physical activity with the large sample size and long-term follow up research.
In the previous studies of tennis players, where the playing arm is compared with the non-dominant counterpart, the side-to-side differences have been up to 40% in favor of the playing arm, which quite indisputably proves the positive effect of physical loading on bone [27]. With adult female squash and tennis players the percentage side-to-side difference in bone mineral content between the dominant and non-dominant arms was about two times greater if females had started playing at or before menarche rather than after it [28,29].
Until now, the most of study were focused on BMD of elite players in side-to-side effects, but a few investigations have been performed for normal people [30,31]. In this study, we observed that the non-dominant hand BMD of moderate and low physical activity groups were significantly lower than those in dominant
hand, but did not in high activity group. In fact, it has never been reported that the difference of BMD in dominant and non-dominant hands was significant different in general sedentary female adolescents. Because the limited information was provided from the current study, we could not explain the difference of forearm BMD due to the levels of physical activity. In fact, limitations of the current study include those inherent to a relatively small sample size, and the fact that physical activity was measured through the pedometer.
Thus, we suggest that the further study is needed for the effects of physical activity levels with the large sample size and long-term follow up research.
In summary, there was no significant difference in lumbar spine, femur and forearm BMD among the three groups. However, the forearm BMD in M-PA and L-PA groups were significantly different between the dominant hand and non-dominant hand. Walking, a form of weight-bearing exercise, strongly recommended to improve bone health and prevent osteopenia in adolescents. Thus, we could suggest that the high-level daily walking could enhance the BMD of non-dominant hand even though anatomically speaking, the forearm bone is not a gravitational burden-bearing bone.
SUMMARY
There were no significant differences in lumbar spine, femur and forearm BMD values among the three groups. However, the forearm BMD in the moderate activity group and low activity group groups were significantly different when the dominant hand and non-dominant hand were compared (p<0.05). In addition, walking, a form of weight-bearing exercise, is strongly recommended to improve bone health
and prevent osteopenia in adolescents. Therefore we conclude that high amounts of daily walking could enhance the non-dominant hand BMD even though anatomically, the forearm bone is not a gravitational burden-bearing bone.
REFERENCES
1. Chun BY, Kam S, Lee YJ, Lee SW, Lee KE, Lee YS, Kim BK. Therapeutic compliance for calcium supplements and its related factors in rural osteoporotic women. Korean
J Rural Med 2001;26(2):111-132(Korean)
2. Park KY, Lee SG. The Association ofAsthma and Osteoporosis in the Residents of the Local Community. Korean J Rural
Med 2009;34(3):316-323(Korean)
3. Wang MC, Dixon, LB. Socioeconomic influences on bone health in postmenopausal women:
findings from NHANES III, 1988-1994.
Osteoporos Int 2006;17(1):91-98.
4. Gourlay ML, Brown SA. Clinical considerations in premenopausal osteoporosis. Arch Intern
Med 2004;164(6):603-614.
5. Mauck KF, Clarke BL. Diagnosis, screening, prevention, and treatment of osteoporosis.
Mayo Clin Proc 2006;81(5):662-672.
6. Bischoff-Ferrari HA. Three steps to unbreakabie bones: Vitamin D, calcium and exercise.
International Osteoporosis Foundation, Nyon,
Switzerland 2011.7. Thompson JL. Conference on "Multidisciplinary approaches to nutritional problems". Symposium on "Performance, exercise and health". Exercise in improving health v. performance. Proc
Nutr Soc 2009;68(1):29-33.
8. National Osteoporosis Foundation. Clinician’s Guide to Prevention and Treatment of Osteoporosis, National Osteoporosis Foundation, Washington, DC, USA, 2010.
9. Matkovic VK, Kostial KI, Simonovic IR, Buzina RA, Brodarec A, Nordin BE. Bone status and fracture rates in two regions of Yugoslavia. Am J Clin Nutr 1979;32(3):540-549.
10. Recker RR, Davies KM, Hinders SM, Heaney RP, Stegman MR, Kimmel DB. Bone gain in young adult women. JAMA 1992;268(17):
2403-2408.
11. Wasnich RD, Miller PD. Antifracture efficacy of antiresorptive agents are related to changes in bone density. J Clin Endocrinol
Metab 2000;85(1):231-236.
12. Pocock NA, Eisman JA, Hopper JL, Yeates MG, Sambrook PN, Eberl S. Genetic determinants of bone mass in adults. A twin study. J Clin Invest 1987;80(3):706-710.
13. Kohrt WM, Bloomfield SA, Little KD, Nelson ME, Yingling VR. American College of Sports Medicine Position Stand: physical activity and bone health. Med Sci Sports
Exerc 2004;36(11):1985-1996.
14. Karlsson MK, Rosengren BE. Training and bone - from health to injury. Scand J
Med Sci Sports 2013;22(4):e15-23.
15. Karlsson MK. Has exercise an antifracture efficacy in women. Scand J Med Sci
Sports 2004;14(1):2-15.
16. Tudor-Locke C, Hatano Y, Pangrazi RP, Kang M. Revisiting "how many steps are enough?". Med Sci Sports Exerc 2008;(7Suppl):
S537-543.
17. Tomkinson1 GR, Olds1 TS, Kang SJ, Kim DY. Secular Trends in the Aerobic Fitness Test Performance and Body Mass Index of Korean Children and Adolescents (1968 - 2000). Int J Sports Med 2007;28(4):314-320.
18. Hind K, Burrows M. Weight-bearing exercise and bone mineral accrual in children and adolescents: a review of controlled trials.
Bone 2007;40(1):14-27.
19. Vicente-Rodriguez G, Dorado C, Perez-Gomez J, Gonzalez-Henriquez JJ, Calbet JA.
Enhanced bone mass and physical fitness in young female handball players. Bone 2004;35(5):1208-1215.
20. Nichols JF, Palmer JE, Levy SS. Low bone mineral density in highly trained male master cyclists. Osteoporos Int 2003;14(8):644-649.
21. Kerschan K, Alacamlioglu Y, Kollmitzer J, Wober C, Kaider A, Hartard M, Ghanem AH, Preisinger E. Functional impact of unvarying exercise program in women after menopause. Am J Phys Med Rehabil 1998;77(4):326-332.
22. VandenBergh MF, DeMan SA, Witteman JC, Hofman A, Trouerbach WT, Grobbee DE. Physical activity, calcium intake, and bone mineral content in children in The Netherlands. J Epidemiol Community Health 1995;49(3):299-304.
23. Deere K, Sayers A, Rittweger J, Tobias JH. Habitual levels of high, but not moderate or low, impact activity are positively related to hip BMD and geometry: results from a population-based study of adolescents. J
Bone Miner Res 2012;27(9):1887-1895.
24. Kim KZ, Shin A, Lee J, Myung SK, Kim J. The beneficial effect of leisure-time physical activity on bone mineral density in pre- and postmenopausal women. Calcif
Tissue Int 2012;91(3):178-185.
25. Parfitt AM. The two faces of growth: benefits and risks to bone integrity. Osteoporos Int 1994;4(6):382-398.
26. Slemenda CW, Johnston CC. High intensity activities in young women: site specific bone mass effects among female figure skaters. Bone Miner 1993;20(2):125-132.
27. Kannus P, Haapasalo H, Sievanen H, Oja P, Vuori I. The site-specific effects of long-term unilateral activity on bone mineral density and content. Bone 1994;15(3):279-284 28. Haapasalo HP, Kannus PH, Sievanen HA, Heinonen AP, Oja P, Vuori I. Long-term unilateral loading and bone mineral density and content in female squash players. Calcif
Tissue Int 1994;54(4):249-255.
29. Kannus P, Haapasalo H, Sankelo M, Sievanen H, Pasanen M, Heinonen A, Oja P, Vuori I.
Effect of starting age of physical activity on bone mass in the dominant arm of tennis and squash players. Ann Intern Med 1995;123(1):27-31.
30. Heidemann MC, Molgaard CS, Husby SA, Schou AJ, Klakk KH, Moller NC, Holst R, Wedderkopp N. The intensity of physical activity influences bone mineral accrual in childhood: the childhood health, activity and motor performance school (the CHAMPS) study, Denmark. BMC Pediatr 2013;13-32.
31. Kriemler S, Zahner L, Puder JJ, Braun- Fahrlander C, Schindler C, Farpour-Lambert NJ, Kranzlin M, Rizzoli R. Weight-bearing bones are more sensitive to physical exercise in boys than in girls during pre- and early puberty: a cross-sectional study. Osteoporos