q
~ 1 1 5 3 3 3 (20059 124) J Korean SK Oxup Eniron Hyg 2005;15(3):202-212wg :
2005g 2% 159,j]qg :
2005g 12% 10%Tiz+jxjz)
:
q q g ( T * q q h ]5 4 7
++3% 9 @ 4+*715qqq3! gdq-qq
Tel : 051-510-0632, Fax: 051-510-0638, E-mail: [email protected])
s
$ q q x ] o ) e a ) $ ~ ( 0 1 %$I,
19891, &+-?Ad ? a ) , A)+-"?? a )
9 +q3!?! 33
$A)x;Fq2qAj
& g q x ] sg * g g $qq
31 % ) o ) q ]
33 g j y q g q g ,
1999), T H I S 014+8\04
2s
x ) q
agq gggq g
E A ) 397 (g+q 5,
2003) 5 0 1gq.
E-E@,&+-Ad
g$q zgq-qq -$q
g-7(p&l,
1991)5
+ j 3 g f i ]gg-q
q $ j q x ) g&+-g-gq
&+-Ad
g$q gg;Tlq
@+ 9 7 7 )9
8J
q
~C@Talchaire Midher, 1979;3 8 4
0 1 9 3 , 1996, 3 ) g Y+,
1997,
4 Adg 3,
1998). &$q
+ g q l$9 9ts2
f l&gq
$P+++AJ~-EA)%;F~F~JLK~
+++ +,
1991), q L q&g
4 9 7 1 %aqqgq FAdq qq 4s
E A \ q%LLqiqg;F %,
20031,014%
&0 A X - ,
E
-4 q93+SS hOF371q 9
7 7 ) 01
Tq
BqKlitzman et al, 1989).E9
+-%I
@qqgg 01
2 D ) q ".?1F3
g 2 A d q 1 IJ];?]*9%
(Robinson, 1987) 0 ) E A ) ~
30q
7j7J 4,q7\ $71gg
z a ) g4%
5,q q &
Lq+;--EiHq-qz 944-3 2
Table 1. Recommended noise management measures
Engineering Measures Remarks
Emission redu ction by source modifation New e n p technology Transmission reduction Olientation of buildings TraEic management Passive protection
Implementation of land-use planning
Tyre profiles; low-noise road surfaces; changes in engine properties Road vehicles; aircl;lft, conauction machines
Enclosures mund machinery; noise screens
Design and structuring of tranquil uses; using buildings for screening purposes Speed limits; pdance of traffic flow by electronic
means
Ear plugs; ear muffs; insulation of dwehgs;
Minimum distance between indmtrial, busy roads and residential areas; location of tranqdhty
areas;
by-pass roads for heavy traffic; separating out incompatible hctions.% q F o J %
+,
1992). 14Lf &+'2"" 0
t s ) q "?C"dd
%q
axmig $ s q ]
93% 7x1 gk* 9'4
sl+ gzr g%q$%+,
1999).01
4
@97 $45$
fs ~ h \ z \ q
A j p ] q -
3g7) qfj2
+ q q g i l , fs
&$-4 t s \ q q %a$
A1 z)41O11D,F
%%blO,Fqq4 2q.
q q A j
q"d
&+4]$9 99 5
5% 9471 t s \ q
&$ 9 4 4 171"qg g a g
ul3]%71011 '43
975
7 + 5 \ q .3 4 ~ s 2 s z )
a 4 4 l A j q
q"d
4% &- I3
"
T-E""
01*14-) L 7 1 ° &CjAq L L O2 q 99 3 4 +$$qg qq5)$ 361 39
q q .
g 974 +4+ qyz\
a 4 4 1 4 7 ) gqy7&q
&+9z) g-1 Tfl 4 g7\
MJO,FS 4]95\+~j] g q . o]g qq 71gq
4%ag 97 g 9fFg g."-;'8)q g7F %L+p $45)
3, 01s
8% %9
&7Iq %'&4]2l;'i;Fk "?-"d)200gp
'4%lcg
441 h"FlS."-;'P 6 4
41o,F%q.4 F a ) 4 4 2 4% 3 4 x ) q 43%
afqg ++qs
g"?\714 4 1
9q4q ~ ~ ~ ~ 4 4 4 4 + s."-;'
B)3 7]$-f;Fq 01% o ] S q 8 \ k 71%
aAnalyhc Hiemchy Method)
5
8)Lf9 q 7 1 2
AHP719(Sag
TL.,
1980)g ol++5\qg Y Q o
s . u j
t=\
a g q p j 4%g qq
p
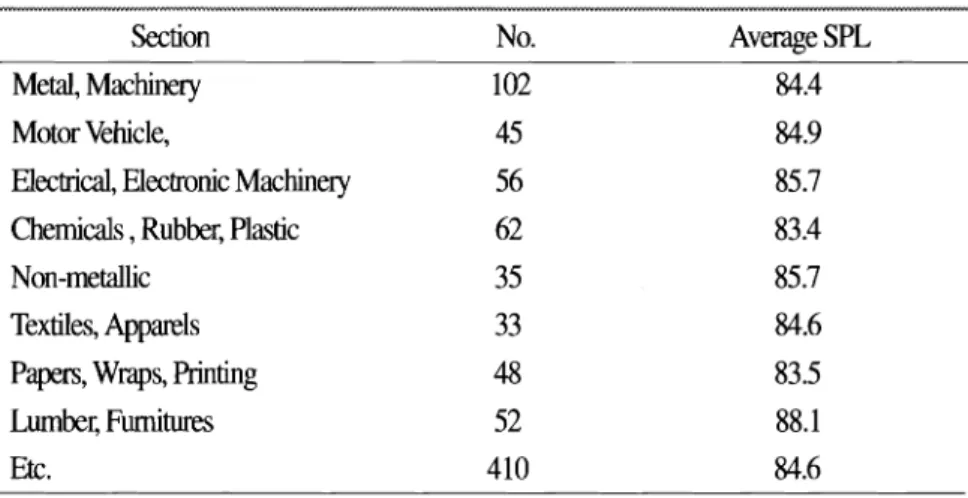
g7\5\5qq.Table 2. Average SPLs in
Jindustrial complex
(Total No.: 861, Total No. of workers : :9,332) Section
Metal, Machinery Motor Vehicle,
Electrical, Electronic Machinery Chemicals, Rubber, Plastic Non-meat
Textiles, Apparels Papers, Wraps, Printing Lumber, Fumitures Etc.
No.
102 45 56 62 35 33 48 52 410
Average SPL 84.4 84.9 85.7 83.4 85.7 84.6 83.5 88.1 84.6
Table
3.Average SPLs in C industrial complex
(Total N 0.: 1,128, Total No. of workers : 1 1,828)
Section No. Average SPL
Metal, Machmery Motor Vehicle,
Electrical, Electronic Machmery Chemicals, Rubber, Plastic Non-metallic
Textiles, Apparels Papen, Wraps, Pnnting Lumber, Fumitures Etc.
Table
4.
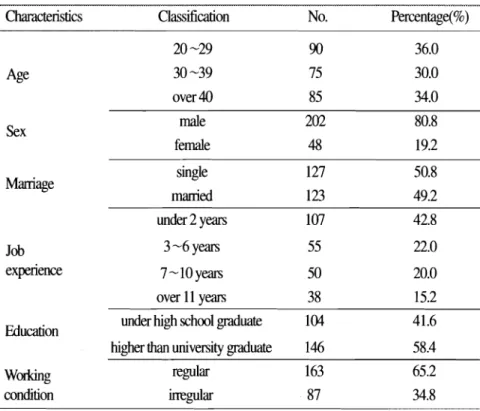
Worker's characteristics of surveyc-".
Characteristics Classification No. Percentage(%)
20 -29 90 36.0
30 -39 75 30.0
over 40 85 34.0
Sex male 202 80.8
female 48 19.2
single 127 50.8
Marriage
married 123 49.2
under 2 years 107 42.8
Job 3 -6 years 55 22.0
experience 7-10 yearj 50 20.0
over 11 years 38 15.2
under high school
graduate
Education 104 41.6
higher than university
graduate
146 58.4Waking regular 163 65.2
condition irregular 87 34.8
Table 5. Worker's noise recognition and job satisfaction indices in J,
C
industrial complexNoise recognition index Job satisfaction index
Mean 63.21
SD 18.40
Table 6. Steps of AHP scheme
step Remarks
Set the strategic objectives and criteria for the evaluation of the manufacturing system under study.
Struckre the decision hierarchy leading to MS choices that are the most
'lep2 feasible and best suited to the nature of the manufacturing system o r g d o n .
Determine the weight or importance of each amibute with the support of the 'lep company's upper level management through questionnaks.
Evaluate and perform the rating of each criterion, subscription, and altemative with respect to
the
next higher objectives or criteriaIdenhfy
the
higher rating preferred alternative and analyse the solution with Step respect to the changes of importance in criteriastep
6 Determine the strategy for the selection of most fitted manufacturing systems to be designed and established over planning horizons.A]%@ 'iLE7]% 41 q r i j
gy*
1 L
q
g + I q p j q -1%q q s
gg $ass
q q % \ % q .g 974 s g 33715
AHP7]%++%#8)q
Table 6 4~$1
+ a J j q % ~ + .g A ] g * ] q q
3 +%g
AHP 71%+ 9949
g7,FaJjqq- $44
A ) i Ts 9 9 3
7$1%4,&44 q444
71
% q
8];FLFf4$HJ%
01-8-01 8\q qA)g%qIF;E++$l711 339 + 20
9 A j S
6)zqg
37-17]gg8)7)
~ ) 1SO]] %%iq
yl7,Fy3qgeqA\g 4440ll/.l 3 4 4-#qa 2q.
01 7 ] % ( 4 3 , 2000)G q$j1:3
4%
iLq8]q q33
341s41%
4(hierarchical)gf
A]A]
@ 8 ) g4jq
kllizsg r i j $QE@riwity)s
sg*
2q.11
2 0 q , 01 44ol1).1q-lh144
x)% %qa
71235s hF$8\q 4%
q]93%
u]312
9 & qq717-j-j
S+q
+q(preference)s4jq
klJizg0
jg.4 q 4 4 g 34s sgq 9
-
9 9%
Table
7.The major advantages of
AHPNo. Remarks
It provides a psychologically sound basis for making the most precise
1 assessment of values through Hierarchy structuring and pair-wise
comparisons of values w i h the same hierarchy.
2 It is simple, intuitive, and easily p r o w l e on a computer
3 'Ihe weights of the values resulting h m the analysis are numerically stable for small inconsistency in human judgments for the pair-wise comparisons In addition to value assessment, it can also be used for forecasting, 4 alternative selection, and resource allocation as will be discussed in future
chapters of this book
The method has been widely applied and accepted by major business corporations and government agencies thmghout the world
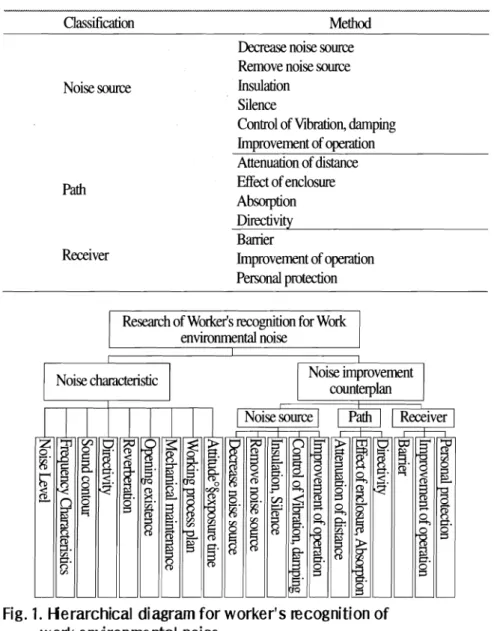
Table
8.Noise control measures
Classifidon Method
Noise source
Path
Decrease noise source Remove noise source Insulation
Silence
Control of Vibration, damping Improvement of operation Attenuation of distance Effect of enclosure Absorption W t i v i t y Banier
Receiver Improvement of operation
Personal protection
I
Rsearch of Wokerls recognition for Work environmental noiseFig. 1. Herarchical diagram for worker's recognition of work environmental noise.
q"d\ 3;"6"11"14 4 q 4 4 %$
Ad qq'i;F71
q 2 q .
s
w q i ~ j A F - $ ~m71w o?
9 4 9
+ 5 J 3 3 ) ( 9 3 7 4 9 g 7 q ,2 w ) ?
i4-%-4
g o 1 4 9 4q3$
7-l 3q.
1)
qA\?43~]4 4A\83
A & S 7,Fq3 A ] S gY%);F6CJ
A ] + 7 Z q9 q. "15
fqz! 2413 %3 ?H41 qA)g3 +"d'1#23. A]+Zqi%);F6CJ gq8)
+ q303.
g ! $& - q41 A l q
%9."d%
fA1
q q .2)
AI+?Z71 43q 4 4 8 3 XI?
% g A ] m v e l ) 9 & 5 4+$q
Table 1 0 q g o ]
qqz g 3%
7 3 q ."1 9 A l * 5
3
741%4
A & 5 4 %A£.ll4 3
q A ] 3 3 X \ q
337]8\e9
Alolq. 55%
$4 Aka4 9%
A d s
q w + 3tbF93s4 q q 3
a$
g+ 1 0 1 3L+qX]+ $LSqg
03.
q+3;"116]]
9 q .q A d @
?$qH]ii!
9 3 Z T E j A&5 4 $Lq+g 7\531q qq3+-21 ( h ) S 73%
3)
4 AI+%3. gqa
A & 5 4% A S S E9'i;Fq
4 q 9 4 93
+ q g qq%]q 4 4 4 q6,Fs 3
3 @ q .
4)
q A \ 3 3 X \ q &qB,
"?Ad$%$%)7]
+qq 9 3sg
'HI9 g A d
H ] g -'1g q .
H]gg."jj
H]&"]oq Gk
* gp %q-47) q33 9 3 A d P 8)q 4Jq HI ii! g +g
8)%++
q q g q .
CR = CI (consistency index)
+
RI (landom index) (I)C I k
994
(consistency)3
2s qq4k 7lEZr.l 4
(2161147) n q
3 4 g+$
93Ad(consistency)"1 2qil g +
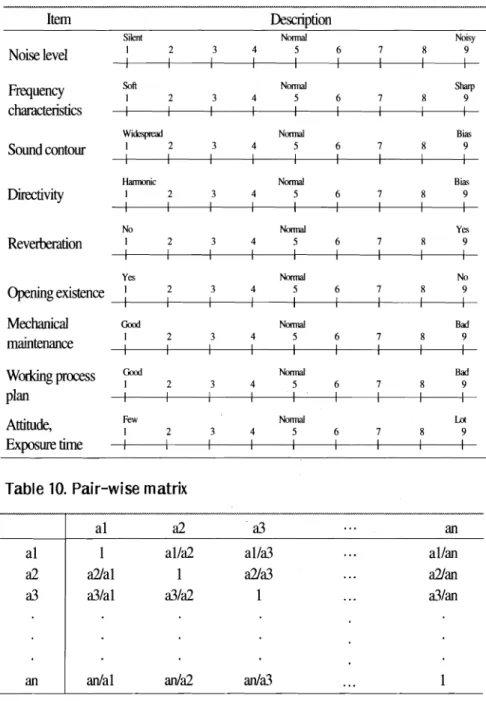
2 q .Table 9. Description languages in survey
Item Description
Silent Normal Noiw
Noise level 1 I 2 I I 3 4 I 5 6 I 7 I 8 9 I
I I I I I I
Fquency Soft Normal sharp
I 2 3 4 5 6 7 8 9
characteristics I I I I I I I I I I I I I I
Widffpread Normal Bias
Sound contour I I I 2 I 3 4 I 5 I 6 I 7 I 8 I 9 I
I I I I
Hamwnic N d Bia?
Dkdvity 1 2 3 4 5 6 7 8 9
I I I I I I I I I
I I
No Normal Yes
Revertmation I 2 3 4 5 6 7 8 9
I I I I I I I I I
I I I I
Yes Normal No
Opening existence
f
2 I I 3 4 5 I 6 I 7 I 8 9 II I I I I I I
Mechanical G X ~ ~ o r m a l Bad
1 2 3 4 5 6 7 8 9
maintenance I I I I I I I I I
I I
workingpI.oCeSS
y
2 3 4 Normal 5 6 7 8 Bad 9I I I I I I I
plan I I I I I
Attitude, Few 1 2 3 4 Normal 5 6 7 8 Lot 9
I I I I I
Exposure h e I I I-
Table 10. Pair-wise matrix
Table 1 1. RI (rand om index)
7 a1 T R +
q710114 5
Xi?3144i.lrH&k9
nm. g 3 4
1P ~lxq%4 +s
qq-';Hcq.RI (random index)* 1-9 scales A)$
I . ~2s737 ZS!F
5)q TqqZ
AJAJg q5J$24 CI & + $ g q q q g 7 ) % L + s q5
(consistency index)g
4
nl %I+. &!Gg 9 Q 5 ) 7 ]q8H
337)q+s
3 4
*~p]iils81%
g71q,,+011
+jA15)q %1q
%;-9~g Table 12,1301) q A J 5 ) % q . @ g701lAjk
q
4 4 $%'011/.14
&+q-19011 4%
%L+'-#, %;-SES+ qzfl
t y %g q
"daq 3i;g
%L+7E3lS+ qj7)7)53]4
% b + C j z7g51q
E A ) 5 )3 q .
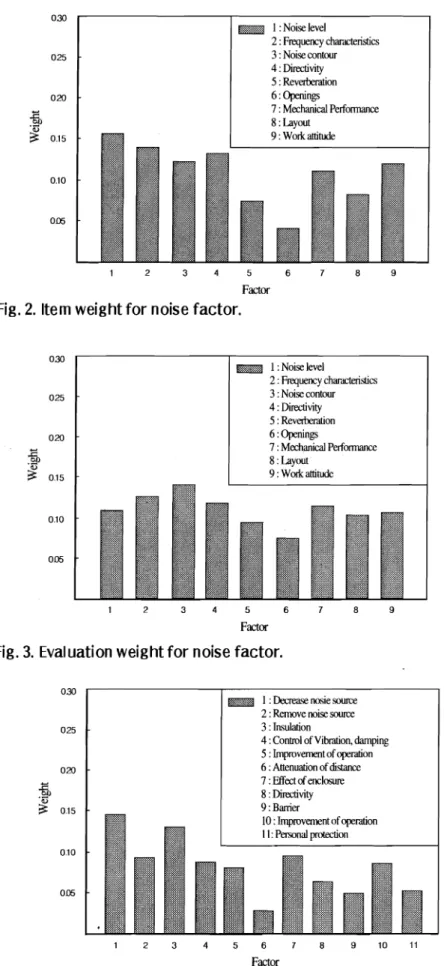
Fig. 2014
gg 7(?.$$Jg
&+$4$9 5
253)3 3 4 4 2 &+V)
1 5 . 7 % ~ 7);"d-
5s 45%
?)X]%\X2Cq 7Hq74 +-r;&
4 . 3 % ~ 7)3L2s
Hl%% g o 1 3 2 q . t a ) 7 )gq5)+
&+q3% q+-+q*
&+$G15.7%), f
I++
$AJ(14.1%),5
3 & + q -1;T]%k~J(13.6%)~ q ~ + % q .
+, q g 3 qq 7Jg9
& + g qq
% $ O r
333 301 39
I+.
g
+45(8.5%),%Lg% 3
g+,,q(7.7%), 7H
77
;1-%4.3%)eq"d"d-1
Aj 5)+&-+go
j z + ~ j 293k.1 3%
p gg+)x 2
q .
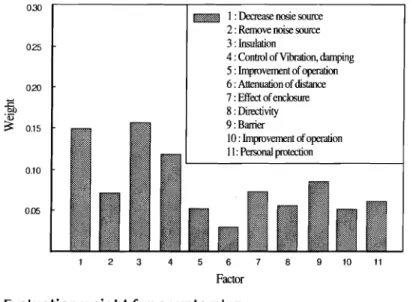
3 4 4
^ ? Q x ) ~ )t B % ) 2 q q
;"d-q &+$@I
011 %qAj% Fig. 3 42.1 qg31
$AJ&++Ojz &+43s g s g qqq2 %+32
(14.2%), f
I++
$~J(12.8%), x)%k~J(11.9%)
$4 $qjz $$x aq.
t j z4-71 9+31+
34 441
*$+$I%$g 7 ) 5 1 5 q ] 2 3 ) o l S g g q . $,
& + r ( + g - q
3)s
7)%$99 'g
^J &+$Ojz
gq51iL 2 O q q g
501lAj2
q"d
&+ d l g g q39
3) q9-l 933%
&+4gs(+&
3 9 ,
gq+, xf*q q
yylrDF9T!%
!Lo15321
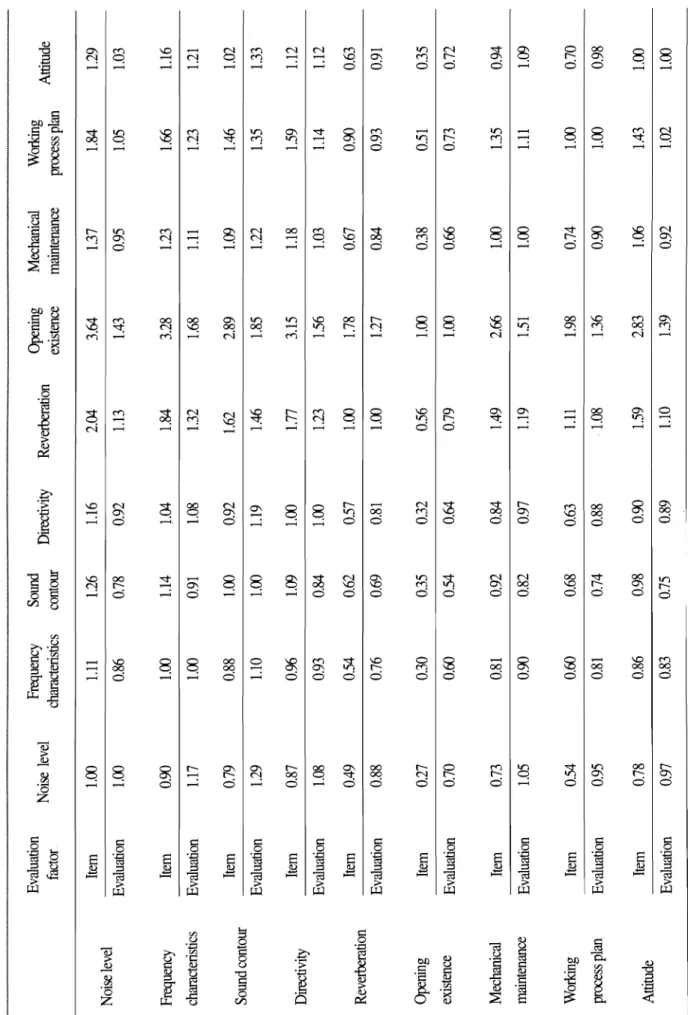
q q k t q .Fig. 4 +j
+ t=)71
AJqz)+
&+ 7H3444
334 % q q ] ~ j 4 &+$7 f l 3
qj+
% Q E ~3 qq'-#,
z
3 4 z ) % q . ts;CF7)9qz12
&$ x j g q q q
201 qp++q*
xj&+$%14.7%),
k-24
?w13.2%),3)q]Zi$9.6%)
5 q
+ ~ j zqqq
23,
34'7]9337(5.3%),2s
x) 4++q
q(5.0%0),4 4
7,F4(2.8%)5
2 : Frequency charaderistics 3 : Noise contour 5 : Revhmtion
1 2 3 4 5 6 7 8 9
Factor
Fig. 2. Item weight for noise factor.
Fig.
3.Evaluation weight for noise factor.
p
%S%)A] kT/1X]23 9q. 012
%A$)&$$
q q q g q g g qq 5
?)qlZqs
7 1 4 q q o ) @+i!94
8)X
2q.
H g , ~)&lolSF%)+
qq*q gqq
9 q A j qg7)4+
2
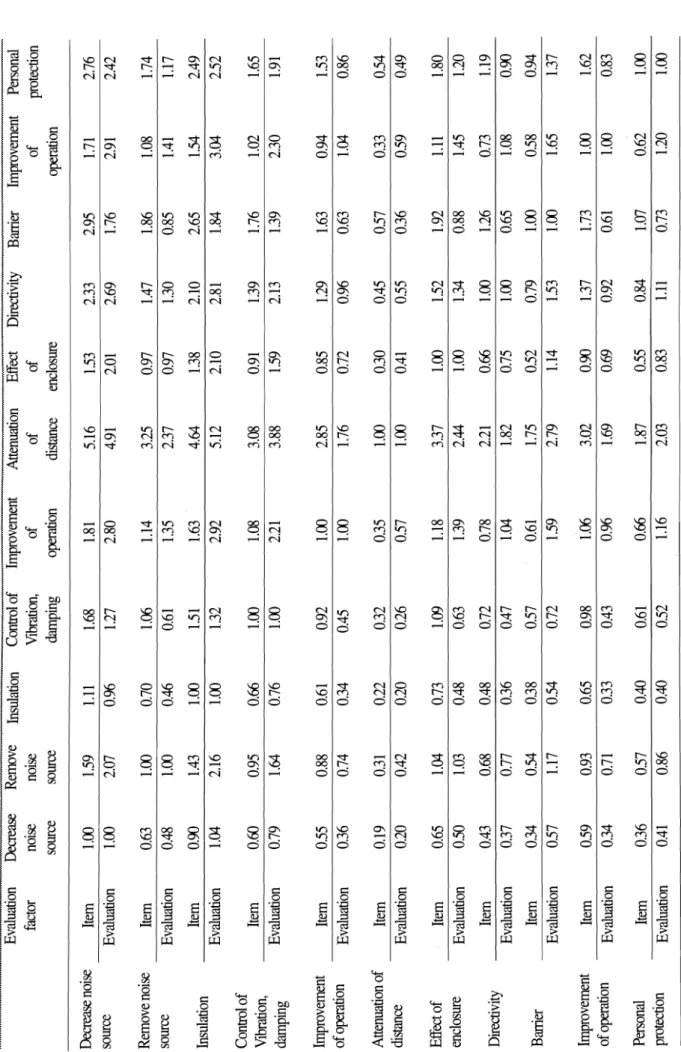
Fig. 54-201
&+7] 3)s(15.7%), ~j&+a15.1%), HJa RI]
8
(11.9%)
5
5j-~J&s+lqlq$
q q o ]+q$q q 4 0 g
~ ~ S F X2oq
paMJ$713(5.4%),
+F$qjy 714
(5.2%), iqiZ/ag3.1%)
5olJ
q q ~ j&
3 3 4 9 32s
qq3r;F. f,2m)+%p g x 1
7(?-q@l e g g 4
7 1 3 ~ 4 4 ~ eg 3 ~ 8
7174530iz812
g o ]H)g-?-"?%)q *x) 474 q q g gqjjqg 32s 9 4 % ) ~ 2
%+ ilqgq-.
A"
qqq1
2 q A jq $zgg+
-'-rn
7_F
q 4 011 DJFq
3 7 ) ~ ]%f s 35%) Z1- ."?z4+S
AHp 7 1 W44
gQ9 442
Table 144- Qr;F. 0)4
+ q ] s
&$%q q p 2 %
7)*z
0 ~ 2 - Z
c
4-j-s
i l o l 390q 84 4 s
3 9 3 ,
8 $71 9
23%5.3%),2s
z)
q(5.0%0),;"lq
34(2.8%)5
$ 5$L%)7]1 kT/1X]
gi! 9Q.
0 1 2",F"J&++j
q q q 344s qq 3
2 ) q ] Z i + z
714qq0) gqi! 9 4
%)il
9q.
E$, x),go]-Z+%)k
qq*q gqq
9 q A j qq7)4+
+
Fig. 54-2 6 1 as71 A14
3)s(15.7%), ~j&+q15.1%),
M J g A] 8
(11.9%)
%
!$J&g%q]qg
q q o ]*qgq q q 2 g 9 4 % ) ~ 90q
gaMJ%
714(5.4%),q g HJy 713
(5.2%), AiZ/7,Fg3.1%) 5611 q d ~ j
2 a549 30s qq3q.
$,~ ~
3 x 1qg*q )
&+$gGj~ g
71&lq4$ ",FA$) 7 ] A l % 3 0 s
%)@ g o 1
H)gq%)q *z) qTq
q q p s g q g 30s 9 4 % ) ~ 9
$P ilq3q.
1 2 3 4 5 6 7 8 9 1 0 1 1
&$
qqq]
9 q A jq &Jsgs$
Factor
zF rH4611 DJFq
3 7 P l%fs SR'i;F
Fig. 4. Item weight for counterplan.
bi]
4 h?B%+S
AHp713011 DJFtF
I
1 2 3 4 5 6 7 6 9 1 0 1 1Factor
Fig. 5. Evaluation weight for counterplan.
Table
14.Noise control measures score
Classification Method Score Total
Decrease
noise source 0.930Remove noise source 0.526
No& source Insulation 0.843 48.3%
Control of Vibcdion, damping 0.532
Improvement of w o n 0.448
Attenuation of distance 0.152
Path Effect of enclosure 0.547 25.7%
Directivity 0.349
Banier 0.289
Receiver Improvement of operation 0.474 26.Wo
Personal protection 0.297
+%@
4 4 % Table 14pFQq.
0)3
polls kg4 q4& 4 g
7 ) 33
0 A A S
i d ~ s z
g'J3 2-G-q 44 4 s
q 4 q *x\ q q g AJqqOg 2
i z dTsz 0 A Y O 1 3
2'4.
Table 12. Pair-wise matrix for cau ses of noise Evaluation Frequency Sound Noise level Directivity Revekeration Opening Mechanical Working factor characteristics contour existence maintenance process plan Attitude Item 1.00 1.11 1.26 1.16 2.04 3.64 1.37 1.84 1.29 Noise level Evaluation 1.00 0.86 0.78 0.92 1.13 1.43 0.95 1.05 1.03 Frequency Item 0.90 1.00 1.14 1.04 1.84 3.28 1.23 1.66 1.16 characteristics Evaluation 1.17 1.00 0.91 1.08 1.32 1.68 1.11 1.23 1.21 Item 0.79 0.88 1.00 0.92 1.62 2.89 1.09 1.46 1.02 Sound contour Evaluation 1.29 1.10 1.00 1.19 1.46 1.85 1.22 1.35 1.33 Directivity Item 0.87 O.% 1.09 1 .OO 1.77 3.15 1.18 1.59 1.12 Evaluation 1.08 0.93 0.84 1.00 1.23 1.56 1.03 1.14 1.12 Item 0.49 0.54 0.62 0.57 1.00 1.78 0.67 0.90 0.63 Revekration Evaluation 0.88 0.76 0.69 0.81 1 .OO 1.27 0.84 0.93 0.91 Opening Item 0.27 0.30 0.35 0.32 0.56 1.00 0.38 0.51 0.35 existence Evaluation 0.70 0.60 0.54 0.64 0.79 1.00 0.66 0.73 0.72 Mechanical Item 0.73 0.8 1 0.92 0.84 1.49 2.66 1.00 1.35 0.94 maintenance Evaluation 1.05 0.90 0.82 0.97 1.19 1.51 1.00 1.11 1.09 Working Item 0.54 0.60 0.68 0.63 1.11 1.98 0.74 1.00 0.70 process plan Evaluation 0.95 0.81 0.74 0.88 1.08 1.36 0.90 1.00 0.98 Attitude Item 0.78 0.86 0.98 0.90 1.59 2.83 1.06 1.43 1.00 Evaluation 0.97 0.83 0.75 0.89 1.10 1.39 0.92 1.02 1.00
Table 13. Pair-wise matrix for counterplan of noise Evaluation Decrease Remove Insulation Control of Improvement Attenuation Effect Directivity Barrier Improvement Personal factor noise noise Vibration, of of of of protection source source damping ption distance enclosure operation Decrease noise Item 1.00 1.59 1.11 1.68 1.81 5.16 1.53 2.33 2.95 1.71 2.76 source Evaluation 1.00 2.07 0.96 1.27 2.80 4.91 2.01 2.69 1.76 2.91 2.42 Remove noise Item 0.63 1.00 0.70 1.06 1.14 3.25 0.97 1.47 1.86 1.08 1.74 source Evaluation 0.48 1.00 0.46 0.61 1.35 2.37 0.97 1.30 0.85 1.41 1.17 Insulation Item 0.90 1.43 1.00 1.51 1.63 4.64 1.38 2.10 2.65 1.54 2.49 Evaluation 1.04 2.16 1.00 1.32 2.92 5.12 2.10 2.81 1.84 3.04 2.52 Control of Vibration, Item 0.60 0.95 0.66 1.00 1.08 3.08 0.91 1.39 1.76 1.02 1.65 damping Evaluation 0.79 1.64 0.76 1.00 2.21 3.88 1.59 2.13 1.39 2.30 1.91 Improvement Item 0.55 0.88 0.6 1 0.92 1.00 2.85 0.85 1.29 1.63 0.94 1.53 ofo~eration Evaluation 0.36 0.74 0.34 0.45 1.00 1.76 0.72 0.96 0.63 1.04 0.86 Attenuation of Item 0.19 0.31 0.22 0.32 0.35 1.00 0.30 0.45 0.57 0.33 0.54 distance Evaluation 0.20 0.42 0.20 0.26 0.57 1.00 0.41 0.55 0.36 0.59 0.49 Effect of Item 0.65 1.04 0.73 1.09 1.18 3.37 1.00 1.52 1.92 1.11 1.80 enclosure Evaluation 0.50 1.03 0.48 0.63 1.39 2.44 1.00 1.34 0.88 1.45 1.20 Directivity Item 0.43 0.68 0.48 0.72 0.78 2.21 0.66 1.00 1.26 0.73 1.19 Evaluation 0.37 0.77 0.36 0.47 1.04 1.82 0.75 1.00 0.65 1.08 0.90 Barrier Item 0.34 0.54 0.38 0.57 0.61 1.75 0.52 0.79 1.00 0.58 0.94 Evaluation 0.57 1.17 0.54 0.72 1.59 2.79 1.14 1.53 1.00 1.65 1.37 Improvement Item 0.59 0.93 0.65 0.98 1.06 3.02 0.90 1.37 1.73 1.00 1.62 of Evaluation 0.34 0.71 0.33 0.43 0.96 1.69 0.69 0.92 0.61 1.00 0.83 Personal Item 0.36 0.57 0.40 0.61 0.66 1.87 0.55 0.84 1 .07 0.62 1 .00 protection Evaluation 0.41 0.86 0.40 0.52 1.16 2.03 0.83 1.11 0.73 1.20 1.00
us! @ ox
5% 4 q4611 r c F 4
37F4% f s g+z)q q )-??%+SAHP 7]#4 qq 5 ~ ~ 3 44,
&+$14401
48.3%g 7)%1
52x3 kg 7 1 3 qO,F 0s LFGkW.
g 97% 97 +qq
253)5 +lq &g $9 qq g
zj7pFq 4
g7)g 5401 +gq 2q.
353,gax) g 337)4 48% gqg
&+-
$9 qTF6- F
$~14 +go] Q7
w. ol-gtJ,
A)-$$$ AHF'a'qzjg g.*?qe 7@q-Adg $9 *
3
9gq !dg~l-4 4 A d z j 9
92
A]"112q& 3417) 9 2 ~ 1
* q 71gq s y q H]Z %+o]
",94q.
REFERENCES
1998;10(2): 189-202
ji)-gY +, 97
AdJ?
A x 3L1zPl
&gq A)q"dq-l."? 9901 g",F q]
n]3]+gsk. q+*.jqqq XI
1997;9(2):244-257qg*, kg*. +4qq &++kg
715
zi+q+q %Ad, gGf++
4 -18 Qq x]
2003;13(1):5341937H'I',F973. q 7 ) g g $ 3 4 x
A]&-)$ 2 0 0 4 g ~ q] H]
q%
AJEA) g a ~ j . 2004.8
g@q, q%+, qqg. &+9
LH9 714, q s g <a01 +qq]
n]3]2 00$%k.
3q3qqAJqq
X] 1999;9(1):41-55
DyerRF, Forman EH. An Analytic Approach to Marketing Decisions.
Prentice-Hall. 1991
Klitman S, JM Stellman. The impact of the physical environment on the psychological well-being of office workers. Soc. Sci. Med. 1989;29 (6):733-742
Malchie JB, Mulllier M. Occupational exposure to noise and hypertension; a retrospective study. Ann Occp Hyg 1979;22:63-66
RobinsonJC. Robinson JC. Work responses to workplace hazards.
Journal of Health Politics, Policy and Law 1987;12 (4):664
Satty TL. The AnalFc Hierarchy Process.
McGraw W. 1980