2004, Vol. 15, No. 3, pp. 585∼592
Comparing Change-Point Detection Methods to Detect the Korea Economic Crisis of 19971)
Kyong Joo Oh2)
Abstract
This study detects Korea economic crisis of 1997 using various change-point detection methods and then compares their performance. In change-point detection method, there are three major categories: (1) the parametric approach, (2) the nonparametric approach, and (3) the model-based approach. Through the application to Korea foreign exchange rate during her economic crisis, we compare the employed change-point detection methods and, furthermore, determine which of them performs better.
Keywords : Change-point detection, Chow test, Economic crisis, Likelihood ratio test, Pettitt test
1. Introduction
During the 1990s, Asia economic crises that have swept across many developing countries have been a painful reminder that market failure is endemic to financial markets (Stiglitz, 1994). These crises have imposed severe economic and social costs on the affected economies, and have threatened the stability of the international monetary system. Early crises began in the shape of financial crisis including currency crisis. In 1997, especially, Korea has gone into the economic crisis due to the problem of balance of payments in the central bank.
A lot of theoretical and empirical work has been done to explain the financial crises of the 1990s. Traditionally, the theoretical study about them has concentrated on the fact that weak economic fundamentals bring about them (Krugman, 1979; Obstfeld, 1986; Eichengreen et al., 1995), which have highlighted 1) This Research is financially supported by Hansung University in the year of 2004.
2) Assistant Professor, Division of Business Administration, Hansung University, 389, 3-Ga, Samsun-Dong, Sungbuk-Gu, Seoul 136-792.
E-mail: [email protected]
the importance that major financial economic variables may have in helping to explain those crises (Kaminsky et al., 1998). For this reason, it is necessary that the change-points (or structural changes) of such variables is detected and analyzed. Therefore, this study adopts the foreign exchange rate to detect its structural change of 1997 using the various change-point detection methods and then to examine Korea economic crisis.
There have been many exciting developments in the theory of change-point detection. New promising directions of research have emerged, and traditional trends have flourished anew. Simultaneously, there are a large variety of change-point detection problems in time series. The literature on this topic is rapidly growing mainly due to applications in engineering, financial mathematics and econometrics. Nowadays, change-point detection has brought to various methods, which are classified as (1) the parametric approach, (2) the nonparametric approach, and (3) the model-based approach (Csorgo and Horvath, 1997). Through the application to Korea foreign exchange rate during her economic crisis, we compare the employed change-point detection methods and, furthermore, determine which of them performs better.
In Section 2, we review three change-point detection methods. Section 3 reports the results of application to Korea foreign exchange rate based three employed change-point detection methods. Finally, the concluding remarks are presented in Section 4.
2. Change-Point Detections
According to the classification of change-point detection methods by Csorgo and Horvath (1997), three major change-point detection methods are employed and compared in this study: (1) the likelihood ratio test for a parametric approach (Kander and Zacks, 1966, Gardner, 1969, Sen and Srivastava, 1975; Hawkins, 1977;
Worsley, 1979), (2) the Pettitt test (1979) for a nonparametric approach based on the nonparametric approach (Page, 1955; Parzen, 1994), and (3) the Chow test (1960) for the model-based approach (Quandt, 1960; Andrews, 1991; Chu and White, 1992; Hinkley, 1971; Hawkins, 1989). The Pettitt test and the Chow test are selected as exemplary nonparametric and model-based approaches, respectively, since they are frequently reviewed on the text and offered by statistical packages.
2.1. Likelihood Ratio Test (LRT): A Parametric Approach
We assume that X1,X2,...,Xn are independent normal observations with parameters (μ,σ2) for i=1,2,...,n, where σ2 is an unknown and may change at an unknown time. Under H0, μ1= μ2= … = μn and under the alternative
hypothesis, there is a change point at k* such that μ1=μ2= … =μk*
≠μk * +1= … =μn. Then, the maximum likelihood ratio test statistic is Ln= max1≤k < nLk= max1≤k < n[n log σˆ2n- k log σ2
ˆk- ( n - k) log σˆ2k *] (1)
where σ2n
ˆ= 1 n ∑n
i = 1(X i- X n)2, σ2k
ˆ= 1
n
{
∑i = 1k (X i- Xˆ
k)2+ i = k + 1∑n (X i- X k *)2}
,σ2k *
ˆ
= n - k1 i = k + 1∑n (X i- X k *)2,X n= 1 n ∑n
i = 1X i , X
ˆ
k= 1k ∑i = 1k X i , X k *= n - k1 i = k + 1∑n X iThe distribution of max 1≤k < nLk is approximated to the normal distribution for large sample sizes (Chu, 1992).
2.2. The Pettitt Test: A Nonparametric Approach
Consider a sequence of random variables X1,X2,...,Xn. It is said to have a change-point at k* if {X1,X2,...,Xk*} and {Xk*+1,Xk*+2,...,Xn} have common distribution functions F1(X) and F2(X) respectively, where F1(X)≠F2(X). We consider the problem of testing the null hypothesis of no-change, H0:k*=n, against the alternative hypothesis of change, H A:1≤ k *< n , using a nonparametric approach.
An appealing nonparametric test to detect a change-point is a version of the Mann-Whitney two-sample test, which has a remarkably stable distribution and provides a test of change-point that is robust to outliers (Pettitt, 1980). Let
Uk,n=∑
k
i=1 ∑
n
j=k+1Dij (2) where Dij=sgn(Xi-Xj)=1, if Xi-Xj>0 ; 0, if Xi-Xj=0 ; -1, otherwise.
The statistic Uk,n is equivalent to a Mann-Whitney test statistic for testing that the two samples {X1,X2,...,Xk*} and {Xk*+1,Xk*+2,...,Xn} come from the same population. Considering the statistic Uk,n for values of t with 1≤ k < n , the Pettitt test statistic is defined as
Kn= max 1≤k< n|Uk,n|. (3)
For the test of H0:k*=n against H A:1≤ k *< n , we propose the use of Kn. The limiting distribution of Kn is approximated to 2 exp{-6k2/(n2+n3)} for large
n (Pettitt, 1980).
2.3. The Chow Test: A Linear Model Approach
Chow (1960) suggested the test for structural breaks which are for stationary variables and a single change point at k*. Consider the following linear regression model with p predictor variables.
Yi=β0+β1Zi,1+…+βpZi,p+εi, i=1,2,…, n (4) where Yi is the response variable in the ith observation; β0,β1,…,βp are regression coefficients; Zi,1,Zi,2,…,Zi,p are the values of the p predictor variables in the ith observation; and εi's are independent random error terms with common
N(0, σ2) distribution.
Now consider two linear regression models for two subsets of the data modeled separately for a possible change-point k*.
Y( 1)i =β( 1)0 +β( 1)1 Zi,1+ … + β( 1)p Zi,p+ε( 1)i , i=1,2,…, k* (5) Y( 2)i =β( 2)0 +β( 2)1 Zi,1+ … + β( 2)p Zi,p+ε( 2)i , i=k*+1,…, n (6) Chow(1960) suggests a test for such a structural change-point k*. Under the assumption that ε(1) and ε(2) have the same variance, he suggests one test statistic used to test the following null hypothesis
H0:β( 1)0 = β( 2)0 , β( 1)1 = β( 2)1 , …, β( 1)p = β( 2)p .
The Chow test statistic, used to test the above null hypothesis, is defined using three residual sums of squares as follows.
F k *, n=
{
∑i = 1n ( εˆi)2- ∑i = 1k *(ˆ
ε( 1 )i )2- i = k *+ 1∑n (ˆ
ε( 2 )i ) 2}
/p{
∑i = 1k *(ˆ
ε( 1 )i )2+i = k *+ 1∑n (ˆ
ε( 2 )i )2}
/( n - 2p) (7) where εˆ, εˆ
(1) and εˆ
(2) denote the residuals obtained from model (4), (5) and (6), respectively. Under the null hypothesis, the Chow test statistic has an F -distribution with p and (n-2p) degrees of freedom.3. Results
The Korean economic crisis that occurred in late 1997 and persisted for over a year brought massive bankruptcies in financial and industrial systems. It was a quite new experience for Korea, which had become accustomed to a steady growth track until then. This unprecedented and peculiar crisis brought large scale changes to the Korean financial market, and since then much attention has been focused on the study of economic crisis. In this study, we compare three major change-point detection methods mentioned in Section 2.1-2.3 to detect Korea economic crisis, To do that, three statistical tests are applied to Korea foreign exchange rate data comprising 96 samples from Sep., 1997 to Jan., 1998 since the crisis Korea experienced is due to the severe scarcity of foreign exchange holdings (Kim et al., 2003). To examine the performance of the three statistical tests, we determine which change-point detection test can detect a structural change-point well during the given Korea crisis period.
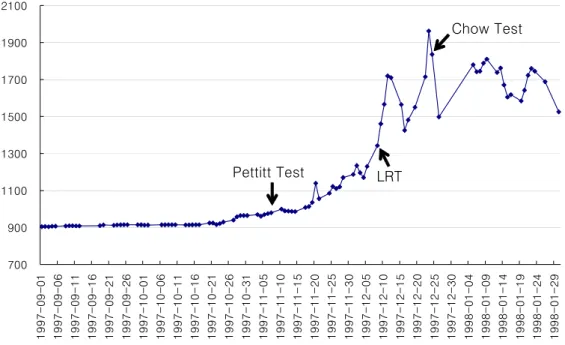
First, LRT statistic is obtained as follows, and the structural change-point (k*) is Dec. 8, 1997.
L96 = max1≤k < nLk= Lk *= n log σˆ2n- k * log σˆ2k *- ( n- k * log σˆ2k *)
= ( 96) log (113074.41) - (67) log (12117.19) - ( 96 - 67) log (15976.88)
= 206.38 ( p - value < 0.0001)
Second, Pettitt test statistic is calculated as follows.
K96= max 1≤k< n|Uk,96| =|Uk *,96| =|U46,96| =2334 (p-value<0.0001)
k* is Nov. 7, 1997, which roughly corresponds to the date which Kim et al (2004) suggest as a starting point of Korea economic crisis. To obtain the result of Chow test, Finally, it is necessary to choose input variables. To do this, five consecutive data (time lags =5) are used as input variables to reflect weekly effect of exchange rate, and then the Chow test statistic is calculated as follows.
F78, 96=10.61 (p-value <0.0001)
k*=78 indicates Dec. 24, 1997. The results of three tests are summarized in Figure 1.
The structural change-points for Korea foreign exchange rate data found by three tests are quite different. It is due to different assumptions pertaining to each test. The normality assumption is required for LRT and Chow test while it is not
for Pettitt test, which is a nonparametric method. In addition, linear regression relation is required for the Chow test. If these assumptions in LRT or Chow test are not satisfied for given data, their signal for an outbreak of change-point can be inappropriate. In the case of Korea exchange rate market, its movement can be considered to have a nonparametric tendency due to institutional complicated trading strategies of foreign exchange market. In general, financial market behaves with the nonlinear and nonparametric attribute (Chorafas, 1994).
700 900 1100 1300 1500 1700 1900 2100
1997-09-01 1997-09-06 1997-09-11 1997-09-16 1997-09-21 1997-09-26 1997-10-01 1997-10-06 1997-10-11 1997-10-16 1997-10-21 1997-10-26 1997-10-31 1997-11-05 1997-11-10 1997-11-15 1997-11-20 1997-11-25 1997-11-30 1997-12-05 1997-12-10 1997-12-15 1997-12-20 1997-12-25 1997-12-30 1998-01-04 1998-01-09 1998-01-14 1998-01-19 1998-01-24 1998-01-29
Pettitt Test LRT
Chow Test
Figure 1. Change-points established by three tests for Korea foreign exchange rate (Korea monetary value per $1) in the period of Korea economic crisis. Y-axis is a Korea monetary unit, WON.
4. Concluding Remarks
In this study, we compare three-typed change-point detection methods in detecting the Korea economic crisis of 1997. In particular, the Pettitt test behaves better than LRT and the Chow test, which means the use of Pettitt test, a nonparametric test, is appropriate to find the change-point of foreign exchange rate since it takes a nonparametric attribute apart from parametric stream.
Therefore, it is reasonable that financial modeling or analysis related to the foreign exchange rate adopts the Pettitt test when the finding of its structural change is needed.
References
1. Andrews, D. (1991). Heteroskedasticity and autocorrelation consistent covariance matrix estimation, Econometrica, 59, 817-858.
2. Chorafas, D.N. (1994). Chaos Theory in the Financial Markets, Chicago:
Probus Publishing Company.
3. Chow, G.C. (1960). Tests of equality between sets of coefficients in two linear regressions, Economerica, 28, 591-605.
4. Chu, C.S.J. and H. White (1992). A direct test for changing trend, Journal of Business and Economic Statistics, 10, 289-299.
5. Csorgo, M. and L, Horvath (1997). Limit Theorems in Change-Point Analysis, New York: John Wiley & Sons
6. Eichengreen, B., Rose, A., and Wyplosz, C. (1995). Exchange market mayhem: The antecedents and aftermath of speculative attacks, Economic Policy, 21, 249-312.
7. Gardner, L.A. Jr. (1969). On detecting changes in the mean of normal variates, Annals of Mathematical Statistics, 40, 116-126.
8. Hawkins, D.L. (1989). An U-I approach to retrospective testing for shift parameters in a linear model, Communications in Statistics - Theory and Methods, 18, 3117-3134.
9. Hawkins, D.M. (1977). Testing a sequence of observations for a shift in location, Journal of American Statistical Associations, 72, 180-186.
10. Hinkley, D.V. (1983). Inference in two-phase regression, Journal of American Statistical Associations, 66, 736-743.
11. Kaminsky, G.L., Lizondo, S., and Reinhart, C.M. (1998). Leading
indicators of currency crises, Staff Papers, International Monetary Fund, 45, 1-48.
12. Kander, Z. and S. Zacks (1966). Test procedures for possible changes in parameters of statistical distributions occurring at unknown time points, Annals of Mathematical Statistics, 37, 1196-1210.
13. Kim, T.Y., Hwang, C., and Lee, J. (2003). Korea economic condition indicator using a neural network trained on the 1997 crisis. Journal of Data Science, 2(4), 2004 (forthcoming).
14. Krugman, P. (1979). A Model of balance-of-payments crises, Journal of Money, Credit and Banking, 11, 311-325.
15. Obstfeld, M. (1986). Rational and self-fulfilling balance-of-payments crises. American Economic Review, LXXVI, 72-81.
16. Page, E.S. (1955). A test for a change in a parameter occurring at an unknown point, Biometrika, 42, 523-526.
17. Parzen, E. (1994). Comparison change analysis approach to change-point estimation, Journal of Applied Statistics, 4, 379-402.
18. Pettitt, A.N. (1979). A non-parametric approach to the change-point problem, Journal of Applied Statistics, 28(2), 126-135.
19. Pettitt, A.N. (1980). Some results on estimating a change-point using nonparametric type statistics, Journal of Statistical Computation and Simulation, 11, 261-272.
20. Quandt, R.E. (1960). Tests of the hypothesis that a linear regression system obeys two separate regimes, Journal of American Statistical Associations, 55, 324-330.
21. Sen, A.K. and M.S. Srivastava (1975), On tests for detecting change in mean, Annals of Statistics, 3, 98-108.
22. Stiglitz, J.E. (1999). Responding to economic crises: policy alternatives for equitable recovery and development, The Manchester School, 67(5), 409-427.
23. Worsley, K.J. (1979). On the likelihood ratio test for a shift in location of normal populations, Journal of American Statistical Associations, 74, 365-367.
[ received date : Mar. 2004, accepted date : Jul. 2004 ]