Communication http://dx.doi.org/10.14478/ace.2016.1028
지상 및 미소중력 환경에서 물리적 승화법 공정에 미치는 불순물의 영향 분석 : 염화제일수은에 대한 응용성
김극태†⋅권무현*
한남대학교 화공신소재공학과 , *우석대학교 에너지공학과 (2016년 3월 21일 접수, 2016년 3월 29일 심사, 2016년 4월 5일 채택)
Numerical Analysis for Impurity Effects on Diffusive-convection Flow Fields by Physical Vapor Transport under Terrestrial and Microgravity Conditions:
Applications to Mercurous Chloride
Geug Tae Kim
†and Moo Hyun Kwon
*Department of Advanced Materials and Chemical Engineering, Hannam University, 1646, Yuseong-daero, Yuseong-gu, Daejeon, 34054 Republic of KOREA
*
Department of Energy Engineering, Woosuk University, 66, Daehak-ro, Jincheon-eup, Jincheon-gun Chungcheongbuk-do, 27841 Republic of Korea
(Received March 21, 2016; Revised March 29, 2016; Accepted April 5, 2016)
초 록
본 연구에서는 지상 및 미소중력환경하에서 물리적 승화법 공정에서의 확산-대류유동에 미치는 불순물의 영향을 이 론적으로 Hg
2Cl
2-I
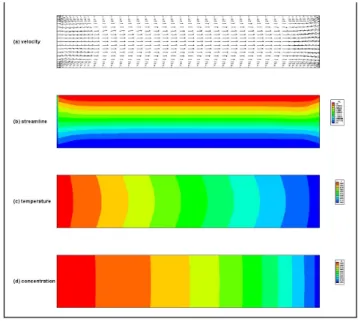
2시스템에 적용하여 규명하는 것이다. 이론적 해석은 증기상에서 확산-대류 흐름, 열 및 물질전달을
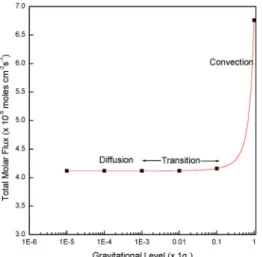
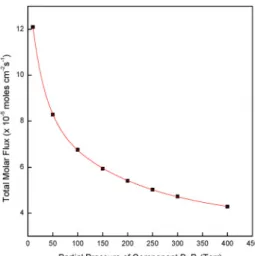
속도 벡터 흐름, 유선, 온도, 농도 분포를 통하여 제시된다. 결정 영역에서의 전체 몰플럭스는 중력가속도와 성분 I
2,
불순물에 상당히 민감하게 반응한다. 성분 I
2을 증가시켰을 때, 농도 대류효과는 확산-대류 유동흐름을 안정화시키는
경향이 있다. 지상중력가속도의 0.001환경에서는 유동흐름은 1차원포물선의 흐름 구조를 나타내며, 확산지배형태를 보여주고 있다. 10
-3지상중력가속도 이하에서는 대류 영향은 무시할 수 있다.
Abstract
In this study, impurity effects on diffusive-convection flow fields by physical vapor transport under terrestrial and microgravity conditions were numerically analyzed for the mixture of Hg
2Cl
2-I
2system. The numerical analysis provides the essence of diffusive-convection flow as well as heat and mass transfer in the vapor phase during the physical vapor transport through velocity vector flow fields, streamlines, temperature, and concentration profiles. The total molar fluxes at the crystal regions were found to be much more sensitive to both the gravitational acceleration and the partial pressure of component I
2as an impurity. Our results showed that the solutal effect tended to stabilize the diffusive-convection flow with increasing the partial pressure of component I
2. Under microgravity conditions below 10
-3g
0, the flow fields showed a one-dimensional parabolic flow structure indicating a diffusion-dominant mode. In other words, at the gravitational levels less than 10
-3g
0, the effects of convection would be negligible.
Keywords: microgravity, crystal growth
1)
1. Introduction
Over the past 45 years since the results of the Apollo space flights, many researches on the role of gravity as a major parameter in materi-
† Corresponding Author: Hannam University,
Department of Advanced Materials and Chemical Engineering, 1646, Yuseong-daero, Yuseong-gu, Daejeon, 34054 Republic of KOREA Tel: +82-42-629-8837 e-mail: [email protected]
pISSN: 1225-0112 eISSN: 2288-4505 @ 2016 The Korean Society of Industrial and Engineering Chemistry. All rights reserved.