R E S E A R C H A R T I C L E Open Access
Association between brain-derived
neurotrophic factor gene polymorphisms and fibromyalgia in a Korean population: a multicenter study
Dong-Jin Park 1 , Seong-Ho Kim 2 , Seong-Su Nah 3 , Ji Hyun Lee 4 , Seong-Kyu Kim 5 , Yeon-Ah Lee 6 , Seung-Jae Hong 6 , Hyun-Sook Kim 7 , Hye-Soon Lee 8 , Hyoun Ah Kim 9 , Chung-Il Joung 10 , Sang-Hyon Kim 11 and Shin-Seok Lee 1*
Abstract
Background: Several lines of evidence imply that brain-derived neurotrophic factor (BDNF) is involved in the pathophysiology of fibromyalgia (FM); in this regard, patients with FM have altered blood and cerebrospinal fluid levels of BDNF. In this study, we explored the association between BDNF gene polymorphisms and FM susceptibility and the severity of symptoms.
Methods: In total, 409 patients with FM and 423 healthy controls in 10 medical centers were enrolled from the Korean nationwide FM survey. The alleles and genotypes at 10 positions in the BDNF gene were genotyped.
Results: The allele and genotype frequencies of BDNF rs11030104 differed significantly between the patients with FM and the controls (P = 0.031). The GG genotype of rs11030104 had a protective effect against FM (P = 0.016), and the G allele of rs11030104 was negatively associated with the presence of FM compared with the A allele (P = 0.
013). In comparison, although the allele and genotype frequencies of BDNF rs12273539 did not differ between the two groups, the TT genotype of BDNF rs12273539 was associated with susceptibility to FM (P = 0.038). Haplotype analyses implied that some BDNF haplotypes have a protective effect against FM. Finally, several genotypes and haplotypes of the BDNF gene contributed to specific symptoms of FM.
Conclusions: This study is the first to evaluate the associations between BDNF gene polymorphisms and FM. Our results imply that some BDNF single-nucleotide polymorphisms and haplotypes are associated with susceptibility to, and contribute to the symptoms of, FM.
Keywords: Fibromyalgia, Brain-derived neurotrophic factor, Genetics, Polymorphism
Background
Fibromyalgia (FM) is a common rheumatic syndrome characterized by chronic widespread pain, and is often accompanied by diverse symptoms including fatigue, sleep disorders, memory loss, joint stiffness, and affective dis- tress [1]. The prevalence of FM in the general population is reportedly 1 –5%, and it is more prevalent among women than men [2]. Although its pathogenesis is
unclear, FM is recognized as an outcome of the interac- tions of multiple genetic, psychological, neurobiological, and environmental factors [3].
The familial aggregation observed among patients with FM implies that genetic factors are important contributors to the etiology of FM [4]. Recent genetic studies have advanced our understanding of the pathogenesis of FM.
These studies have shown that certain gene polymor- phisms alter pain sensitivity and increase susceptibility to FM [5]. In particular, polymorphisms of genes involved in the pain transmission pathway, such as the serotoninergic, dopaminergic, and catecholaminergic systems, have received much attention as possible genetic factors in FM
* Correspondence: [email protected]
1
Division of Rheumatology, Department of Internal Medicine, Chonnam National University Medical School and Hospital, 42 Jebong-ro, Dong-gu, Gwangju 61469, Republic of Korea
Full list of author information is available at the end of the article
© The Author(s). 2018 Open Access This article is distributed under the terms of the Creative Commons Attribution 4.0
International License (http://creativecommons.org/licenses/by/4.0/), which permits unrestricted use, distribution, and
reproduction in any medium, provided you give appropriate credit to the original author(s) and the source, provide a link to
the Creative Commons license, and indicate if changes were made. The Creative Commons Public Domain Dedication waiver
(http://creativecommons.org/publicdomain/zero/1.0/) applies to the data made available in this article, unless otherwise stated.
[6, 7]. However, those genetic factors do not fully account for the pathophysiology and symptoms of FM. Therefore, efforts to identify other genetic factors that contribute to FM are ongoing.
Brain-derived neurotrophic factor (BDNF) is involved in neuronal survival, growth, and differentiation during devel- opment of the central and peripheral nervous systems [8].
BDNF is important in the transmission of physiologic or pathologic pain [9]. BDNF is responsible for modulation of nociceptive inputs and enhanced hyperalgesia by a N-methyl-D-aspartate (NMDA) receptor-mediated mech- anism [10]. Moreover, dysregulation of BDNF in the dorsal root ganglion (DRG) and spinal cord contributes to chronic pain hypersensitivity [11]. In addition, several lines of evi- dence have converged to imply that BDNF is involved in the pathophysiology of FM. Indeed, patients with FM have been shown to have altered serum and plasma levels of BDNF compared to healthy controls [12–14].
However, whether polymorphisms of the BDNF gene are associated with FM remains an open question. The objective of this study was to evaluate the associations between BDNF gene polymorphisms and FM susceptibil- ity and clinical symptoms, using a large population of ethnically homogenous Koreans.
Methods
Study design and population
We performed a multicenter, nationwide FM cohort study (the Korean Nationwide FM Survey) in the Korean popula- tion. In the Korean Nationwide FM Survey, we established a prospective cohort to evaluate the pathophysiology of FM, and the clinical manifestations and outcomes of Korean patients with FM. The study participants were recruited from the outpatient rheumatology clinics of 10 medical centers. In this study, a cross-sectional design was employed to evaluate the association between BDNF gene polymorphisms and susceptibility to, and symptom severity of, FM. As reported previously [15], we enrolled 409 patients with FM (382 women and 27 men) with a mean (SD) age of 48.1 (10.9) years. At the time of the initial diag- nosis, patients with FM were diagnosed according to the classification criteria for FM proposed by the American College of Rheumatology (ACR) in 1990 [1]. The mean (SD) symptom duration before diagnosis was 8.5 (8.3) years, and the mean (SD) disease duration after initial diag- nosis was 1.9 (3.0) years. Based on health surveys for chronic pain, we recruited 423 healthy controls (397 women, 25 men) with a mean (SD) age of 45.5 (12.5) years and no history of chronic pain, including FM. Healthy con- trols were recruited randomly, without matching for age or sex, among the individuals visiting the general health examination clinics at each medical center. This research complied with the Helsinki Declaration, and written in- formed consent was obtained from all participants at the
time of recruitment. Exactly the same informed consult form (ICF) and study protocol were provided to the inde- pendent Institutional Review Board/Ethics Committee (IRB/EC) at each medical center, and each IRB/EC reviewed the appropriateness of the protocol and risks and benefits to the study participants. Ultimately, the IRB/EC at each medical center independently approved this study without revision of the ICF or study protocol.
Procedures
The patients with FM were interviewed at the time of en- rollment to determine their demographics and clinical characteristics, including age, sex, body mass index, and symptom and disease duration. In addition, at enrollment, peripheral venous blood was sampled and then stored in an ethylenediaminetetraacetate (EDTA)-coated tube. Ten- der points were assessed by thumb palpation according to the standardized tender point survey protocol [16]. The number of tender points was assessed at 18 sites on the body. The intensity at each tender point was assessed by determining the tender point score as follows: 0, no tender- ness; 1, light tenderness (confirming answer when asked);
2, moderate tenderness (spontaneous verbal response); and 3, severe tenderness (moving away). Therefore, the number of tender points ranged from 0 to 18, and the possible total scores of the tender points ranged from 0 to 54. Further- more, extensive clinical assessments of patients with FM enrolled in the cohort were undertaken using a self-report questionnaire and semi-structured questionnaires. The Ko- rean version of the Fibromyalgia Impact Questionnaire (FIQ) was used to assess the functional abilities and sever- ity of FM [17], and the Brief Fatigue Inventory (BFI) and the Beck Depression Inventory (BDI) were used to evaluate the severity of fatigue and depression, respectively [18, 19].
The 36-item Medical Outcomes Study Short-Form Health Survey (SF-36) was used to access the quality of life of the patients with FM [20]. In addition, we also evaluated the severity of anxiety using the State-Trait Anxiety Inventory (STAI)-I and STAI-II [21].
The patients had been treated with standard medications for FM, based on the clinical judgment of their attending rheumatologist. Concomitant medications, used at the time of enrollment, included tricyclic antidepressants (TCA), selective serotonin reuptake inhibitors (SSRI), serotonin-norepinephrine reuptake inhibitors (SNRI), pregabalin, gabapentin, nonsteroidal anti-inflammatory drugs (NSAIDs), acetaminophen, benzodiazepine, trama- dol, and muscle relaxants.
Genotyping of BDNF polymorphisms
The assay reagents for rs2883187(C > T), rs7103873 (G >
C), rs7103411(C > T), rs10835210(C > A), rs11030104 (A >
G), rs12273539(C > T), rs11030102(C > G), rs11030101(A >
T), rs6265(G > A) and rs7124442(C > T) in the BDNF gene
were designed by Applied Biosystems (Applied Biosystems).
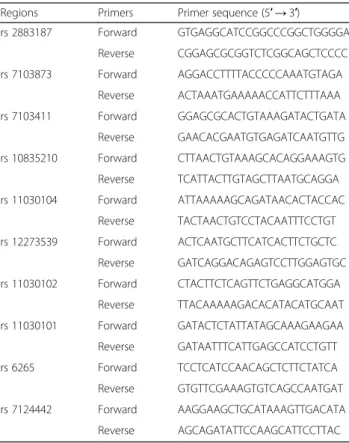
The reagents consisted of TaqMan MGB probes (FAM and VIC dye-labeled). Each reaction (10 μL) comprised 0.125 μL of 40X reagents, 5 μL of 2X TaqMan Genotyping Master Mix (Applied Biosystems) and 2 μL of 50 ng gen- omic DNA. The PCR conditions were 1 cycle at 95 °C for 10 min, followed by 40 cycles at 95 °C for 15 s and 60 °C for 1 min. The PCR reactions were performed using an ABI plus instrument (Applied Biosystems). The samples were read and analyzed using ABI plus software (Applied Biosystems). The sequences of the primers used for Taq- Man probe genotyping of the BDNF gene are summarized in Table 1.
Statistical analysis
Statistical analyses were performed using IBM SPSS statis- tics (SPSS version 21; IBM SPSS Inc., Chicago, IL, USA). P values <0.05 were considered to indicate statistical signifi- cance. Each BDNF gene polymorphism was tested for Hardy-Weinberg equilibrium. The genotype and haplo- type frequencies of the BDNF single-nucleotide polymor- phisms (SNPs) were compared between the patients with FM and controls by Fisher’s exact test or Pearson’s chi-squared test. The association between each BDNF genotype and haplotype and susceptibility to FM was de- fined by logistic regression analysis. Analysis of covariance
(ANCOVA), adjusted for age and sex, was used to explore the differences in the clinical measurements of the patients with FM according to BDNF genotype and haplo- type. Haplotype structures were constructed and their frequencies estimated by combined allele analysis using PHASE v2.1.1 software (Department of Statistics, Univer- sity of Washington, Seattle, WA, USA). We carried out a permutation test for the null hypothesis that the patients with FM and the healthy controls are random draws from a common set of haplotype frequencies (number of permutations performed = 10,000).
Results
BDNF genotypes and alleles and their association with clinical measurements
The BDNF SNPs were successfully genotyped in all en- rolled subjects, except for 5 controls with BDNF rs2883187, 1 patient and 16 controls with BDNF rs7103873, 2 controls with BDNF rs7103411, 1 patient and 10 controls with BDNF rs10835210, 2 patients and 3 controls with BDNF rs11030104, 1 control with BDNF rs12273539, 1 patient and 1 control with BDNF rs11030102, 1 patient and 3 con- trols with BDNF rs11030101, 1 patient and 4 controls with BDNF rs6265, and 2 patients and 2 controls with BDNF rs7124442. The genotype distributions of the BDNF SNPs were consistent with Hardy-Weinberg equilibrium in both the patients and controls.
Among the BDNF SNPs, the allele and genotype fre- quencies of BDNF SNP rs11030104 were significantly different between the patients with FM and controls.
Furthermore, patients with the GG genotype of rs11030104 were found less frequently in patients with FM after adjusting for age and sex (OR 0.619; 95% confi- dence interval (CI) 0.419 –0.0913; P = 0.016). In addition, the G allele was negatively associated with the presence of FM compared to the A allele (OR = 0.781, 95% CI 0.641 –0.950, P = 0.013). In comparison, although the al- lele and genotype frequencies of the SNPs of BDNF rs12273539 were not significantly different between the patients with FM and controls, the TT genotype of rs12273539 was found more frequently in patients with FM in the age-adjusted and sex-adjusted model (OR 2.586; 95% CI 1.052 –6.360; P = 0.038) (Table 2).
Within the FM cohort, patients with the CG genotype of BDNF rs11030102 had more severe fatigue symptoms (measured by the BFI) and anxiety symptoms (measured by the STAI-I) than did the other genotypes ( P = 0.001 and P = 0.032, respectively). Furthermore, both rs11030101 and rs10835210 were associated with the trait of anxiety (measured by the STAI-II) in patients with FM ( P = 0.029 and P = 0.033, respectively). No associations were observed between clinical measurements and the other BDNF SNPs (Table 3).
Table 1 Primer sequences used for TaqMan probe genotyping of BDNF
Regions Primers Primer sequence (5 ′ → 3′)
rs 2883187 Forward GTGAGGCATCCGGCCCGGCTGGGGA
Reverse CGGAGCGCGGTCTCGGCAGCTCCCC
rs 7103873 Forward AGGACCTTTTACCCCCAAATGTAGA
Reverse ACTAAATGAAAAACCATTCTTTAAA
rs 7103411 Forward GGAGCGCACTGTAAAGATACTGATA
Reverse GAACACGAATGTGAGATCAATGTTG
rs 10835210 Forward CTTAACTGTAAAGCACAGGAAAGTG
Reverse TCATTACTTGTAGCTTAATGCAGGA
rs 11030104 Forward ATTAAAAAGCAGATAACACTACCAC
Reverse TACTAACTGTCCTACAATTTCCTGT rs 12273539 Forward ACTCAATGCTTCATCACTTCTGCTC Reverse GATCAGGACAGAGTCCTTGGAGTGC rs 11030102 Forward CTACTTCTCAGTTCTGAGGCATGGA
Reverse TTACAAAAAGACACATACATGCAAT rs 11030101 Forward GATACTCTATTATAGCAAAGAAGAA Reverse GATAATTTCATTGAGCCATCCTGTT
rs 6265 Forward TCCTCATCCAACAGCTCTTCTATCA
Reverse GTGTTCGAAAGTGTCAGCCAATGAT
rs 7124442 Forward AAGGAAGCTGCATAAAGTTGACATA
Reverse AGCAGATATTCCAAGCATTCCTTAC
BDNF brain-derived neurotrophic factor
Table 2 Genotype and allele analyses of BDNF in patients with fibromyalgia and healthy controls
aMarker Genotype/allele Contol, n (%) Fibromyalgia, n (%) Exact p value
bOR (95% CI), p value
cOR (95% CI), p value, adjusted by age, sex
‡rs2883187 C/C 115 (27.5) 100 (24.4) 0.218 1 1
C/T 220 (52.6) 208 (50.9) 1.087 (0.783 –1.510), p = 0.617 1.044 (0.747 –1.458), p = 0.802 T/T 83 (19.9) 101 (24.7) 1.399 (0.943 –2.078), p = 0.096 1.340 (0.897 –2.002), p = 0.152
C 450 (53.8) 408 (49.9) 0.119 1
T 386 (46.2) 410 (50.1) 1.172 (0.966 –1.421), p = 0.108 1.147 (0.943 –1.395), p = 0.171
rs7103873 G/G 113 (27.8) 98 (24.0) 0.245 1 1
C/G 210 (51.6) 208 (51.0) 1.142 (0.820 –1.591), p = 0.432 1.110 (0.791 –1.556), p = 0.546 C/C 84 (20.6) 102 (25.0) 1.400 (0.943 –2.080), p = 0.095 1.345 (0.899 –2.010), p = 0.149
G 436 (53.6) 404 (49.5) 0.112 1
C 378 (46.4) 412 (50.5) 1.176 (0.968 –1.429), p = 0.102 1.153 (0.946 –1.405), p = 0.158
rs7103411 C/C 120 (28.5) 128 (31.3) 0.638 1 1
C/T 208 (49.4) 198 (48.4) 0.892 (0.651 –1.224), p = 0.48 0.884 (0.641 –1.220), p = 0.454 T/T 93 (22.1) 83 (20.3) 0.837 (0.568 –1.232), p = 0.366 0.865 (0.584 –1.280), p = 0.468
C 448 (53.2) 454 (55.5) 0.374 1
T 394 (46.8) 364 (44.5) 0.912 (0.751 –1.106), p = 0.348 0.925 (0.76 –1.125), p = 0.435
rs10835210 C/C 204 (49.4) 196 (48.0) 0.725 1 1
A/C 175 (42.4) 172 (42.2) 1.023 (0.767 –1.364), p = 0.877 0.991 (0.740 –1.326), p = 0.949
A/A 34 (8.2) 40 (9.8) 1.224 (0.745 –2.014), p = 0.425 1.183 (0.714 –1.957), p = 0.514
C 583 (70.6) 564 (69.1) 0.554 1
A 243 (29.4) 252 (30.9) 1.072 (0.868 –1.324), p = 0.518 1.048 (0.846 –1.297), p = 0.671
rs11030104 A/A 101 (24.0) 126 (31.0) 0.031 1 1
A/G 205 (48.8) 196 (48.2) 0.766 (0.553 –1.063), p = 0.111 0.758 (0.544 –1.057), p = 0.102 G/G 114 (27.1) 85 (20.9) 0.598 (0.407 –0.877), p = 0.009 0.619 (0.419 –0.913), p = 0.016
A 407 (48.5) 448 (55.0) 0.009 1
G 433 (51.5) 366 (45.0) 0.768 (0.633 –0.932), p = 0.007 0.781 (0.641 –0.95), p = 0.013
rs12273539 C/C 283 (67.1) 268 (65.4) 0.101 1 1
C/T 132 (31.3) 125 (30.5) 1 (0.744 –1.345), p = 1 1.009 (0.747 –1.362), p = 0.955
T/T 7 (1.7) 17 (4.1) 2.564 (1.047 –6.282), p = 0.039 2.586 (1.052 –6.36), p = 0.038
C 698 (82.7) 661 (80.6) 0.299 1
T 146 (17.3) 159 (19.4) 1.150 (0.897 –1.475), p = 0.27 1.161 (0.902 –1.493), p = 0.246
rs11030102 C/C 419 (99.3) 402 (98.5) 0.334 1 1
C/G 3 (0.7) 6 (1.5) 2.085 (0.518 –8.392), p = 0.301 2.129 (0.524 –8.649), p = 0.291
C 841 (99.6) 810 (99.3) 0.335 1
G 3 (0.4) 6 (0.7) 2.077 (0.518 –8.326), p = 0.302 2.12 (0.524 –8.58), p = 0.292
rs11030101 A/A 208 (49.5) 197 (48.3) 0.752 1 1
A/T 178 (42.4) 172 (42.2) 1.020 (0.766 –1.358), p = 0.891 0.985 (0.737 –1.317), p = 0.92
T/T 34 (8.1) 39 (9.6) 1.211 (0.735 –1.996), p = 0.452 1.152 (0.694 –1.912), p = 0.583
A 594 (70.7) 566 (69.4) 0.585 1
T 246 (29.3) 250 (30.6) 1.067 (0.864 –1.316), p = 0.548 1.036 (0.837 –1.283), p = 0.743
rs6265 G/G 96 (22.9) 87 (21.3) 0.770 1 1
A/G 204 (48.7) 197 (48.3) 1.066 (0.751 –1.512), p = 0.722 1.017 (0.712 –1.451), p = 0.928 A/A 119 (28.4) 124 (30.4) 1.150 (0.783 –1.688), p = 0.476 1.110 (0.752 –1.638), p = 0.599
G 396 (47.3) 371 (45.5) 0.496 1
Haplotype frequencies and clinical measurements
Among the 39 haplotype structures included in the haplo- type analysis of BDNF SNPs, seven frequent haplotypes (TGACCGCTGC, TATCCAACCT, TGACCACTGC, TAACTACCCT, TATCCGACCT, TAACTGCCCT, and CAACCACCGC) had a frequency of > 1% in the patients and controls. Although not shown in Table 4, the total fre- quency of the other haplotype structures was 30 (3.8%) for patients and 46 (6%) for controls. These haplotypes showed significantly different distributions between the patients with FM and the controls (P = 0.0001; Table 4).
Among the frequent haplotypes, the TGACCACTGC haplotype was found less frequently in the patients with FM after adjusting for age and sex (OR 0.004, 95% CI 0.0–0.026, P < 0.001; Table 5). Interestingly, the TATC CGACCT and TAACTGCCCT haplotypes were not detected in patients with FM (Table 5) (both P > 0.05).
In the clinical measures, only anxiety, assessed using the STAI-II score, was significantly different among the patients according to BDNF haplotype (Table 6).
Discussion
To our knowledge, we were the first to investigate the association between BDNF SNPs and FM. We found that the allele and genotype frequencies of BDNF rs11030104 were significantly different between the patients with FM and the controls. In comparison, although the allele and genotype frequencies of BDNF rs12273539 were not significantly different between the patients with FM and the controls, the TT genotype of BDNF rs12273539 was associated with susceptibility to FM. In addition to the individual SNPs, certain BDNF haplotypes may be protective against FM or contribute to its symptoms. Therefore, our data imply that BDNF gene polymorphisms contribute to the development and symptom severity of FM in the Korean population.
Neurotrophic factors are a family of closely related proteins involved in neuronal survival, growth, and dif- ferentiation during development of the nervous system
[9]. Neurotrophins comprise four structurally related factors: BDNF, nerve growth factor (NGF), neurotrophin 3 (NT-3), and neurotrophin 4/5 (NT-4/5). Neurotrophins play important roles in the transmission of physiologic and pathologic pain [22]. In particular, BDNF plays key roles in chronic pain conditions. BDNF is synthesized in the DRG, and is transported to the central terminals of the primary afferents in the spinal dorsal horn, where it is involved in the modulation of painful stimuli [9]. BDNF contributes to central sensitization by modulating nociceptive inputs and enhancing hyperalgesia through NMDA-receptor-mediated responses [23]. For these rea- sons, researchers have been interested in the role of BDNF in chronic pain disorders, including FM [24]. In addition, BDNF plays a role in depressive disorder, which is frequently comorbid with FM; indeed, the serum level of BDNF is altered in patients with depression [25, 26].
Moreover, it can be normalized by antidepressants such as milnacipran [26], which are frequently used in the treat- ment of FM.
Several clinical studies have evaluated the role of BDNF in the pathogenesis of FM. Patients with FM have in- creased levels of BDNF in blood [12, 14] and cerebrospinal fluid [27] compared to healthy controls, implying that BDNF is involved in the pathophysiology of FM. In particular, Zanette et al. reported that serum BDNF levels are inversely associated with the pressure-pain threshold in patients with FM [13]. Furthermore, increased serum BDNF mediates the disinhibition of motor cortex excitability and the function of the descending inhibitory pain modulation system in patients with FM [28]. In fact, recent studies have shown that disruptions in default mode network (DMN) connectivity may be associated with impaired pain modulation, leading to the chronic pain seen in FM [29, 30]. Furthermore, certain BDNF polymorphisms have an effect on specific aspects of brain function such as DMN connectivity, which is currently considered to be central in the pathogenesis of FM [31].
These findings could be a potential explanation that Table 2 Genotype and allele analyses of BDNF in patients with fibromyalgia and healthy controls
a(Continued)
Marker Genotype/allele Contol, n (%) Fibromyalgia, n (%) Exact p value
bOR (95% CI), p value
cOR (95% CI), p value, adjusted by age, sex
‡A 442 (52.7) 445 (54.5) 1.075 (0.886 –1.304), p = 0.466 1.058 (0.869 –1.287), p = 0.575
rs7124442 C/C 2 (0.5) 0 (0) 0.574 1 1
C/T 51 (12.1) 47 (11.5) 718,117.521 (0-Inf), p = 0.972 683,123.831 (0-Inf), p = 0.972
T/T 368 (87.4) 360 (88.5) 762,294.038 (0-Inf), p = 0.971 682,163.974 (0-Inf), p = 0.972
C 55 (6.5) 47 (5.8) 0.590 1
T 787 (93.5) 767 (94.2) 1.140 (0.763 –1.705), p = 0.521 1.078 (0.716 –1.623), p = 0.72 BDNF brain-derived neurotrophic factor
a
Missing data were excluded from the analyses: BDNF rs2883187 (5 controls), BDNF rs7103873 (1 patient and 16 controls), BDNF rs7103411 (2 controls), BDNF rs10835210 (1 patient and 10 controls), BDNF rs11030104 (2 patients and 3 controls), BDNF rs12273539 (1 control), BDNF rs11030102 (1 patient and 1 control), BDNF rs11030101 (1 patient and 3 controls), BDNF rs6265 (4 controls and 1 patient), and BDNF rs7124442 (2 patients and 2 controls)
b
Value was determined by Fisher’s exact test or χ
2test
c
Logistic regression analyses were used to calculate the OR (95% CI; confidence interval)
Table 3 Least-squares means (95% CI) of responses in patients with fibromyalgia, according to genotype Position Genotype Number
aTender point number Tender point count FIQ BFI PCS MCS BDI STAI-I STAI-II rs2883187 C/C 100 13.38 (12.21 –14.56) 25.17 (21.2 –29.14) 58.56 (53.23 –63.9) 7.25 (5.28 –9.22) 38.02 (35.88 –40.16) 31.25 (27.83 –34.67) 18.09 (15.05 –21.12) 51.56 (48.06 –55.06) 51.97 (48.73 –55.21) C/T 208 13.80 (12.83 –14.77) 25.70 (22.43 –28.96) 610 (56.69 –65.32) 6.27 (4.66 –7.89) 37.29 (35.56 –39.03) 32.62 (29.85 –35.39) 18.57 (16.11 –21.02) 49.73 (46.9 –52.56) 50.2 (47.59 –52.81) T/T 101 13.77 (12.54 –15.0) 25.85 (21.68 –30.03) 58.21 (52.66 –63.77) 7.16 (5.11 –9.22) 38.17 (35.94 –40.41) 34.26 (30.69 –37.83) 16.89 (13.7 –20.08) 49.49 (45.82 –53.15) 48.29 (44.9 –51.68) p value
†0.739 0.947 0.449 0.466 0.625 0.299 0.54 0.478 0.138 rs7103873 G/G 98 13.37 (12.18 –14.55) 25.01 (21.01 –29.01) 57.96 (52.56 –63.35) 7.34 (5.35 –9.32) 37.96 (35.8 –40.12) 31.39 (27.93 –34.85) 17.78 (14.71 –20.85) 51.52 (47.98 –55.06) 51.9 (48.63 –55.18) G/C 208 13.84 (12.88 –14.81) 25.97 (22.73 –29.21) 60.89 (56.60 –65.19) 6.25 (4.65 –7.85) 37.34 (35.62 –39.07) 32.83 (30.07 –35.6) 18.45 (16.01 –20.9) 49.51 (46.7 –52.32) 50.08 (47.48 –52.68) C/C 102 13.66 (12.42 –14.9) 25.28 (21.08 –29.49) 59.04 (53.43 –64.64) 7.26 (5.19 –9.33) 38.07 (35.82 –40.32) 33.52 (29.92 –37.13) 17.4 (14.18 –20.62) 50.33 (46.64 –54.02) 48.72 (45.31 –52.13) p value
b0.69 0.857 0.479 0.389 0.721 0.523 0.755 0.484 0.224 rs7103411 C/C 128 13.79 (12.68 –14.9) 25.97 (22.21 –29.72) 60.26 (55.22 –65.3) 6.97 (5.11 –8.83) 37.76 (35.73 –39.79) 32.88 (29.64 –36.12) 18.25 (15.37 –21.14) 50.48 (47.17 –53.8) 49.28 (46.21 –52.35) C/T 198 13.74 (12.74 –14.74) 25.65 (22.27 –29.02) 60.54 (56.09 –64.99) 6.07 (4.41 –7.73) 37.5 (35.71 –39.29) 33.0 (30.14 –35.87) 18.32 (15.78 –20.85) 49.55 (46.62 –52.47) 50.44 (47.74 –53.15) T/T 83 13.46 (12.23 –14.68) 25.0 (20.87 –29.14) 57.81 (52.24 –63.38) 7.64 (5.59 –9.68) 37.79 (35.55 –40.02) 31.41 (27.84 –34.98) 17.5 (14.33 –20.67) 50.89 (47.22 –54.55) 51.09 (47.69 –54.48) p value
b0.859 0.907 0.582 0.249 0.947 0.635 0.86 0.705 0.578 rs10835210 C/C 196 13.49 (12.50 –14.47) 25.67 (22.37 –28.97) 59.70 (55.30 –64.10) 6.91 (5.27 –8.55) 37.78 (36.02 –39.55) 31.77 (28.96 –34.58) 18.87 (16.37 –21.36) 51.04 (48.18 –53.9) 51.77 (49.13 –54.41) C/A 172 13.87 (12.84 –14.91) 25.51 (22.04 –28.99) 60.15 (55.46 –64.85) 6.66 (4.93 –8.4) 37.3 (35.41 –39.18) 33.19 (30.18 –36.2) 17.17 (14.5 –19.83) 48.42 (45.35 –51.48) 48.63 (45.81 –51.45) A/A 40 13.96 (12.18 –15.74) 24.85 (18.87 –30.83) 59.67 (51.64 –67.7) 5.46 (2.52 –8.4) 38.45 (35.22 –41.67) 35.31 (30.17 –40.45) 17.78 (13.17 –22.4) 51.79 (46.49 –57.08) 47.51 (42.62 –52.4) p value
b0.675 0.962 0.977 0.609 0.728 0.301 0.384 0.138 0.029 rs11030104 A/A 126 13.80 (12.68 –14.92) 25.99 (22.22 –29.75) 60.27 (55.2 –65.35) 7.0 (5.13 –8.87) 37.82 (35.77 –39.86) 32.86 (29.6 –36.12) 18.33 (15.43 –21.23) 50.46 (47.13 –53.79) 49.29 (46.2 –52.37) A/G 196 13.79 (12.79 –14.8) 25.67 (22.3 –29.03) 60.66 (56.19 –65.13) 6.09 (4.42 –7.76) 37.4 (35.60 –39.20) 32.9 (30.02 –35.77) 18.41 (15.87 –20.95) 49.69 (46.76 –52.61) 50.53 (47.82 –53.24) G/G 85 13.31 (12.08 –14.53) 24.75 (20.64 –28.86) 57.55 (51.98 –63.12) 7.58 (5.53 –9.62) 37.86 (35.63 –40.1) 31.6 (28.03 –35.16) 17.31 (14.15 –20.47) 50.63 (46.99 –54.28) 50.88 (47.49 –54.27) p value
b0.677 0.845 0.498 0.274 0.871 0.731 0.757 0.821 0.616 rs12273539 C/C 268 13.63 (12.7 –14.55) 25.24 (22.11 –28.37) 59.03 (54.81 –63.25) 6.51 (4.95 –8.07) 37.67 (35.98 –39.37) 33.14 (30.42 –35.86) 17.45 (15.05 –19.85) 49.9 (47.14 –52.66) 49.52 (46.96 –52.09) C/T 125 14.13 (13.01 –15.24) 27.04 (23.26 –30.81) 62.11 (57.15 –67.08) 6.75 (4.89 –8.61) 37.48 (35.48 –39.47) 31.56 (28.36 –34.76) 19.34 (16.5 –22.18) 50.66 (47.4 –53.92) 51.73 (48.7 –54.75) T/T 17 11.90 (9.7 –14.1) 21.96 (14.52 –29.41) 57.64 (47.31 –67.96) 8.92 (5.15 –12.69) 38.13 (33.98 –42.27) 31.82 (25.17 –38.48) 20.22 (14.35 –26.09) 49.54 (42.8 –56.29) 50.87 (44.61 –57.14) p value
b0.131 0.319 0.349 0.432 0.945 0.533 0.26 0.862 0.271 rs11030102 C/C 402 13.67 (12.8 –14.55) 25.57 (22.61 –28.53) 59.83 (55.89 –63.77) 6.62 (5.17 –8.07) 37.66 (36.07 –39.25) 32.67 (30.14 –35.21) 18.06 (15.83 –20.29) 50.02 (47.45 –52.59) 50.16 (47.78 –52.55) C/G 6 17.58 (13.01 –22.15) 36.13 (20.73 –51.54) 72.91 (51.53 –94.29) 19.07 (11.35 –26.79) 35.01 (26.4 –43.63) 23.8 (10.04 –37.56) 29.58 (17.47 –41.69) 65.06 (51.13 –78.99) 62.56 (49.62 –75.51) p value
b0.089 0.172 0.224 0.001 0.542 0.2 0.059 0.032 0.057 rs11030101 A/A 197 13.49 (12.51 –14.47) 25.69 (22.38 –29.01) 59.82 (55.43 –64.22) 6.91 (5.27 –8.55) 37.79 (36.02 –39.55) 31.73 (28.92 –34.54) 18.94 (16.45 –21.43) 51.01 (48.15 –53.87) 51.77 (49.13 –54.42) A/T 172 13.84 (12.81 –14.87) 25.38 (21.9 –28.87) 60.26 (55.57 –64.95) 6.69 (4.95 –8.43) 37.34 (35.45 –39.22) 33.14 (30.14 –36.15) 17.1 (14.43 –19.76) 48.41 (45.34 –51.48) 48.57 (45.75 –51.4) T/T 39 14.23 (12.45 –16.01) 26.37 (20.36 –32.37) 58.75 (50.73 –66.77) 5.33 (2.39 –8.27) 38.16 (34.93 –41.39) 35.94 (30.8 –41.08) 17.66 (13.12 –22.21) 52.15 (46.94 –57.37) 48.07 (43.25 –52.89) p value
b0.605 0.943 0.929 0.555 0.816 0.212 0.325 0.126 0.033 rs6265 G/G 87 13.29 (12.07 –14.51) 24.66 (20.55 –28.78) 57.67 (52.14 –63.21) 7.55 (5.52 –9.59) 37.83 (35.61 –40.06) 31.56 (28.01 –35.11) 17.44 (14.29 –20.59) 50.62 (46.97 –54.26) 50.94 (47.56 –54.32)
Table 3 Least-squares means (95% CI) of responses in patients with fibromyalgia, according to genotype (Continued) Position Genotype Number
aTender point number Tender point count FIQ BFI PCS MCS BDI STAI-I STAI-II G/A 197 13.77 (12.77 –14.77) 25.62 (22.26 –28.99) 60.72 (56.27 –65.18) 6.11 (4.44 –7.77) 37.45 (35.65 –39.24) 32.92 (30.05 –35.79) 18.27 (15.74 –20.81) 49.6 (46.67 –52.52) 50.43 (47.71 –53.14) A/A 124 13.88 (12.76 –15) 26.34 (22.56 –30.13) 60.17 (55.09 –65.24) 6.98 (5.11 –8.86) 37.83 (35.79 –39.88) 32.91 (29.64 –36.18) 18.37 (15.47 –21.28) 50.58 (47.24 –53.91) 49.37 (46.28 –52.46) p value
b0.634 0.746 0.513 0.293 0.898 0.702 0.829 0.766 0.657 rs7124442 C/T 47 13.57 (12.12 –15.03) 26.18 (21.3 –31.07) 62.15 (55.49 –68.81) 5.60 (3.16 –8.05) 37.37 (34.69 –40.05) 30.74 (26.46 –35.03) 19.98 (16.2 –23.76) 50.67 (46.27 –55.07) 51.35 (47.3 –55.39) T/T 360 13.72 (12.81 –14.62) 25.53 (22.48 –28.57) 59.53 (55.49 –63.57) 6.88 (5.37 –8.39) 37.69 (36.06 –39.32) 32.94 (30.34 –35.54) 17.81 (15.51 –20.1) 50.01 (47.36 –52.66) 50.04 (47.58 –52.5) p value
b0.836 0.777 0.411 0.274 0.804 0.285 0.23 0.755 0.501 Abbreviations :CI confidence interval, FIQ Fibromyalgia Impact Questionnaire, BFI Brief Fatigue Inventory, PCS Physical Component Summary, MCS Mental Component Summary, BDI Beck Depression Inventory, STAI-I State-Trait Anxiety Inventory-I, STAI-II State-Trait Anxiety Inventory-II
aMissing data were excluded from the analyses: BDNF rs2883187 (5 controls), BDNF rs7103873 (1 patient and 16 controls), BDNF rs7103411 (2 controls), BDNF rs10835210 (1 patient and 10 controls), BDNF rs11030104 (2 patients and 3 controls), BDNF rs12273539 (1 control), BDNF rs11030102 (1 patient and 1 control), BDNF rs11030101 (1 patient and 3 controls), BDNF rs6265 (4 controls and 1 patient), and BDNF rs7124442 (2 patients and 2 controls)
bp values derived by analysis of covariance adjusted for age and sex
supports the existence of a mechanistic link between BDNF polymorphisms and FM. However, although mul- tiple lines of evidence imply a role for BDNF in the patho- genesis of FM, BDNF polymorphisms in these patients have not been investigated extensively.
In this study, we found that certain BDNF SNPs are as- sociated with susceptibility to FM. The GG genotype and the G allele of BDNF rs11030104 exert a protective effect against FM. In contrast, although the allele and genotype frequencies of BDNF rs12273539 did not differ between the patients with FM and controls, the TT genotype of BDNF rs12273539 was associated with susceptibility to FM. To date, only one study has evaluated associations between BDNF gene polymorphisms and FM. Xiao et al.
[32] evaluated whether the BDNF Val66Met polymorph- ism was associated with FM; their results implied that the BDNF Val66 Met SNP is associated with a subgroup of patients with FM with high-sensitivity C-reactive protein and high body mass index. Nevertheless, the relative distribution of the BDNF Val66Met SNP did not differ between the patients with FM and healthy controls. Simi- larly, in our study, BDNF Val66Val Met was not associated
with susceptibility to FM. However, our data demonstrate that other BDNF SNPs, such as rs11030104 and rs12273539, were associated with the risk of FM in a Korean population.
Furthermore, our data imply that certain BDNF haplo- types exert a protective effect against FM. A haplotype refers to a particular set of closely linked alleles that are inherited as a unit, and haplotype analysis can reveal the pattern of genetic variation associated with certain diseases [33]. Several haplotypes of certain genes are reportedly significantly associated with FM. Diatchenko et al. [34]
reported that the ACCG haplotype, which consists of four SNPs (rs6269, rs4633, rs4818, and rs4680) of the catechol-O-methyltransferase ( COMT) gene, is associated with both FM susceptibility and symptom severity [35, 36].
Similarly, we also suggested that a particular haplotype of TRPV2 may be associated with susceptibility to FM [ 37]. In the current study, our findings imply that BDNF haplo- types may be involved in the pathophysiology of FM.
Notably, we failed to uncover a direct association be- tween BDNF gene polymorphisms and pain-related symp- tom scales such as the tender point number and count.
However, those polymorphisms were related to certain psy- chological symptoms in patients with FM. In particular, certain BDNF SNPs and haplotypes were associated with anxiety symptoms. Since patients with FM have a signifi- cantly higher prevalence of anxiety disorders (13 –63.8%) [38], our findings imply that BDNF gene polymorphisms may indirectly affect FM through their effect on anxiety.
However, diverse factors affect the development of FM, including psychological symptoms such as anxiety, so our results should be interpreted carefully.
This study had several limitations. First, it was of a case-control design. Because the purpose of this study was to evaluate the role of BDNF SNPs associated with susceptibility to FM, we adopted a target-gene-based approach. Therefore, like the majority of SNP studies, we selected candidate SNPs for a case-control analysis of their association with FM. Second, the multiple tests Table 4 Estimates of haplotype frequencies in patients with
fibromyalgia (n = 393) and healthy controls (n = 388)
aCombined alleles
aAll subjects Controls Fibromyalgia p value
bTGACCGCTGC 29.6 ± 0.75 20.22 ± 0.9 38.87 ± 0.88 0.0001 TATCCAACCT 20.16 ± 0.44 12.94 ± 0.57 27.29 ± 0.52
TGACCACTGC 14.8 ± 0.75 25.26 ± 0.89 4.47 ± 0.88 TAACTACCCT 11.97 ± 0.42 6.99 ± 0.5 16.89 ± 0.53 TATCCGACCT 8.94 ± 0.45 15.76 ± 0.59 2.21 ± 0.52 TAACTGCCCT 5.74 ± 0.42 9.8 ± 0.5 1.72 ± 0.53 CAACCACCGC 3.20 ± 0.17 2.06 ± 0.22 4.33 ± 0.24
a
Data are percentages ± SE
a
Missing data were excluded (n = 51). Among 39 haplotype structures, 7 haplotypes with frequency of at least 1% in both the patients and controls are presented
b
p values for permutation test of the null hypothesis that cases and controls are random draws from a common set of haplotype frequencies (number of permutations = 10,000)
Table 5 Combined allele frequencies and odds ratios in patients with fibromyalgia and healthy controls
aCombined alleles Controls, n (%) Fibromyalgia, n (%) Crude OR (95% CI) p value
bAge and sex adjusted OR (95% CI) p value
bTGACCGCTGC 193 (26.6) 340 (45) 1.0 (reference) 1.0 (reference)
TATCCAACCT 119 (16.4) 232 (30.7) 1.107 (0.834 –1.469) 0.483 1.106 (0.833 –1.47) 0.487
TGACCACTGC 160 (22) 1 (0.1) 0.004 (0 –0.026) < 0.001 0.004 (0.0 –0.026) < 0.001
TAACTACCCT 66 (9.1) 146 (19.3) 1.256 (0.894 –1.765) 0.19 1.248 (0.887 –1.756) 0.204
TATCCGACCT 103 (14.2) 0 (0) 0 (0-Inf) 0.963 0 (0-Inf) 0.963
TAACTGCCCT 65 (9) 0 (0) 0 (0-Inf) 0.971 0 (0-Inf) 0.97
CAACCACCGC 20 (2.8) 37 (4.9) 1.05 (0.593 –1.861) 0.867 1.088 (0.612 –1.934) 0.774
Abbreviations: OR odds ratio, CI confidence interval
a
Missing data were excluded (n = 51). Among 39 haplotype structures, 7 haplotypes with a frequency of at least 1% in both the patients and controls are presented; the total frequency of the other haplotype structures was 46 (6%) for controls and 30 (3.8%) for patients. Logistic regression models were used to calculate ORs
b
Computed for the estimated coefficient of each haplotype in the logistic regression
Table 6 Numbers of haplotypes and least-squares means (95% CI) of responses in patients with fibromyalgia Combined alleles Number
aTender point number Tender point count FIQ BFI PCS MCS BDI STAI-I STAI-II TGACCGCTGC 340 13.61 (12.89 –14.33) 25.33 (22.93 –27.73) 59.67 (56.48 –62.87) 6.81 (5.6 –8.01) 37.56 (36.25 –38.87) 32.12 (30.06 –34.18) 18.02 (16.22 –19.83) 50.66 (48.56 –52.76) 51.01 (49.07 –52.95) TATCCAACCT 232 13.91 (13.1 –14.72) 25.29 (22.6 –27.99) 59.88 (56.26 –63.5) 6.35 (4.99 –7.71) 37.49 (36 –38.98) 33.88 (31.54 –36.21) 17.25 (15.21 –19.3) 49.31 (46.92 –51.69) 48.26 (46.07 –50.46) TAACTACCCT 146 13.66 (12.75 –14.58) 26.34 (23.29 –29.38) 61.2 (57.17 –65.23) 7.32 (5.8 –8.85) 37.49 (35.84 –39.15) 31.73 (29.13 –34.33) 19.5 (17.21 –21.78) 50.49 (47.83 –53.14) 51.16 (48.71 –53.6) CAACCACCGC 37 13.53 (12.02 –15.05) 25.96 (20.93 –31) 63.17 (56.22 –70.11) 5.67 (3.09 –8.25) 37.78 (34.92 –40.63) 30.7 (26.22 –35.18) 20.06 (16.15 –23.97) 52.65 (48.1 –57.2) 52.74 (48.54 –56.93) p value
b0.874 0.902 0.696 0.527 0.998 0.271 0.221 0.459 0.027 Abbreviations :CI confidence interval, FIQ Fibromyalgia Impact Questionnaire, BFI Brief Fatigue Inventory, PCS Physical Component Summary, MCS Mental Component Summary, BDI Beck Depression Inventory, STAI-I State-Trait Anxiety Inventory-I, STAI-II State-Trait Anxiety Inventory-II
aMissing data were excluded from the analyses
bp values derived by analysis of covariance adjusted for age and sex
performed in this study may have increased the type I error. In genetics, controlling for multiple testing is im- portant in estimating thresholds of significance accurately, particularly in genome-wide association studies (GWAS) [39]. However, in this target-gene-based SNP study, we did not consider the potential effects of multiple testing in the analyses. In fact, most published FM SNP case-control studies have not considered the potential effects of mul- tiple testing. Third, we were unable to prospectively evalu- ate the associations between BDNF genetic variation and clinical outcomes. Therefore, further studies are needed to investigate the effect of those genetic polymorphisms on the long-term clinical outcomes of patients with FM. Fi- nally, to overcome the insufficient statistical power, we conducted a large-scale study involving > 800 samples.
However, our findings should be replicated in a larger population comprising multiple ethnicities.
Conclusions
In this study, we evaluated the association between BDNF polymorphisms and FM in a large sample of the Korean population. We found that BDNF gene polymorphisms influenced susceptibility to FM, and contributed to the severity of certain symptoms of FM. Further evidence from large prospective studies is needed to determine the generalizability of our findings to the broader population and their impact on the clinical outcomes of FM. More- over, further work is needed to elucidate the biologic and epigenetic mechanisms underlying the complex role of the BDNF gene in FM.
Abbreviations
BDI: Beck Depression Inventory; BDNF: Brain-derived neurotrophic factor;
BFI: Brief Fatigue Inventory; CI: Confidence interval; DRG: Dorsal root ganglion; FIQ: Fibromyalgia Impact Questionnaire; FM: Fibromyalgia;
ICF: Informed consent form; MCS: Mental Component Summary; NMDA: N- methyl-D-aspartate; NSAIDs: Nonsteroidal anti-inflammatory drugs;
PCS: Physical Component Summary; SF-36: 36-Item Medical Outcomes Study Short-Form Health Survey; SNP: Single-nucleotide polymorphism;
SNRI: Serotonin-norepinephrine reuptake inhibitors; SSRI: Selective serotonin reuptake inhibitor; STAI-I: State-Trait Anxiety Inventory-I; STAI-II: State-Trait Anxiety Inventory-II; TCA: Tricyclic antidepressant
Acknowledgements
We would like to thank the patients and their families for participating in this study.
Funding
This study was supported by the Bio & Medical Technology Development Program of the NRF funded by the Korean government, MSIP
(2017M3A9E8023014), and by a grant (CRI16015 –1) from Chonnam National University Hospital Biomedical Research Institute.
Availability of data and materials
The datasets used during the current study are available from the corresponding author on reasonable request.
Authors ’ contributions
D-J P and S-SL conceived and designed the study. S-HK, S-SN, JHL, S-KK, Y- AL, S-JH, H-SK, H-SL, HAK, C-IJ, and S-HK acquired data. D-J P and S-SL per- formed statistical analysis and drafted the manuscript. All authors critically
revised the manuscript for important intellectual content. All authors read and approved the final manuscript.
Ethics approval and consent to participate
This study was conducted in accordance with the Declaration of Helsinki, and written informed consent was obtained from all participants at the time of recruitment. Exactly the same informed consult form (ICF) and study protocol were provided to the independent Institutional Review Board/Ethics Committee (IRB/EC) at each medical center, and each IRB/EC reviewed the appropriateness of the protocol and risks and benefits to the study participants. Ultimately, the IRB/EC at each medical center independently approved this study without revision of the ICF or study protocol.
Consent for publication Not applicable.
Competing interests
The authors declare that they have no competing interests.
Publisher ’s Note
Springer Nature remains neutral with regard to jurisdictional claims in published maps and institutional affiliations.
Author details
1
Division of Rheumatology, Department of Internal Medicine, Chonnam National University Medical School and Hospital, 42 Jebong-ro, Dong-gu, Gwangju 61469, Republic of Korea.
2Department of Internal Medicine, Inje University Haeundae Paik Hospital, Busan, Korea.
3Department of Internal Medicine, Soonchunhyang University, College of Medicine, Cheonan, Korea.
4
Department of Internal Medicine, Maryknoll Medical Center, Busan, Korea.
5
Department of Internal Medicine, Catholic University of Daegu, School of Medicine, Daegu, Korea.
6Department of Internal Medicine, School of Medicine, Kyung Hee University, Seoul, Korea.
7Department of Internal Medicine, Soonchunhyang University Seoul Hospital, Seoul, Korea.
8Hanyang University College of Medicine and the Hospital for Rheumatic Diseases, Seoul, Korea.
9Department of Allergy and Rheumatology, Ajou University Hospital, Ajou University School of Medicine, Suwon, Korea.
10Department of Internal Medicine, Konyang University Medical School, Daejeon, Korea.
11