Influence of the Adhesive, the Adherend and the Overlap on the Single Lap Shear Strength
Lucas F M da Silva1†, J E Ramos2, M V Figueiredo1, and T R Strohaecker2
1Faculdade de Engenharia da Universidade do Porto Rua Dr. Roberto Frias, 4200-465 Porto, Portugal
2Universidade Federal do Rio Grande do Sul Departamento de Metalurgia, Laboratrio de Metalurgia Fsica Porto Alegre, RS BR-90035190, Brazil
(Received October 29, 2006; Accepted November 17, 2006)
Abstract:The single lap joint is the most studied joint in the literature in terms of both theory and practice.
It is easy to manufacture and the lap shear strength is a useful value for strength assessment and quality control. Simple design rules exist such as the one present in standard ASTM 1002 or in a recent paper by Adams and Davies. The main factors that have an influence on the lap shear strength are the type of adhesive, i.e. ductile or brittle, the adherend yield strength and the overlap length. The overlap increases the shear strength almost linearly if the adhesive is sufficiently ductile and the adherend does not yield. For substrates that yield, a plateau is reached for a certain value of overlap corresponding to the yielding of the adherend. For intermediate or brittle adhesives, the analysis is more complex and needs further investigation. In order to quantify the influence of the adhesive, the adherend and the overlap on the lap shear strength, the experimental design technique of Taguchi was used. An experimental matrix of 27 tests was designed and each test was repeated three times. The influence of each variable could be assessed as well as the interactions between them using the statistical software Statview. The results show that the most important variable on the lap shear strength is the overlap length followed by the type of adherend.
Keywords: lap shear strength, adhesive, overlap, adherend, statistical analysis
1. Introduction
1)
Adhesive joints can have many configurations, the most common being the single lap, the double lap, the scarf and the stepped lap joints. Because of its ease of manufacture, the single lap joint (SLJ) has been well studied in the literature, both experimentally and the- oretically. But this does not mean that it is easy to ana- lyse the stresses present in that joint. In practice, the loading is not collinear, which means that there is bend- ing of the adherends. Thus, the adhesive will experience tensile stresses (peel) at the end of the joint as well as shear. The double lap, the scarf and the stepped joints are designed to decrease peel.
The simplest analysis and the most limited for ana- lysing stresses in SLJs is to suppose that the adherends are rigid and the adhesive deforms only in shear. Volk-
†Corresponding author: e-mail: [email protected]
ersen [1] introduced into the analysis what is called dif- ferential straining. But there is an important point that was neglected in the Volkersen analysis: the rotation of the joint. The rotation of the joint was included in the analysis of Goland and Reissner [2] and the model gives, in addition to the shear stress, the transverse tear- ing (peel) stresses in the adhesive. The previous analyses are for elastic behaviour. However, the adhesive and even the adherends may become non-linear or plastic.
Hart-Smith [3] developed the theories of Volkersen and Goland and Reissner taking into account the plastic be- haviour of the adhesive. A ductile adhesive will yield and sustain further load until eventually its shear strain to failure is attained. A ductile adhesive yields before fracture, redistributing and reducing the peak shear strains.
The SLJ is very common in practice and simple design rules should be available for design purposes.
Table 1. Adhesive properties (three specimens tested for each adhesive)
Hysol EA 9361 Araldite 2011 AV138/HV998
Young’s modulus E (GPa) 0.67 ± 0.02 1.16 ± 0.03 4.59 ± 0.81
Yield strength σya (MPa) 4.23 ± 0.55 24.50 ± 0.20 36.49 ± 2.47
Tensile strength σr (MPa) 7.99 ± 1.59 31.68 ± 2.40 41.01 ± 7.28
Failure strain εf (%) 44.0 ± 12.3 20 ± 3.30 1.3 ± 0.44
Toughness UT (MPa) 2.69 5.62 0.34
Figure 1. Tensile stress-strain curves of the various adhe- sives tested.
Hart-Smith [3] proposed a chart where the joint strength is given as a function of adhesive ductility and overlap.
The adherends were supposed to remain in the elastic range. This is not realistic since the adherends will yield in many cases (e.g. aluminium or low strength steel).
The standard ASTM 1002 proposes a very simple design rule to guarantee that the adherends do not yield.
Adams and Davies [4] developed a simple methodology to predict the joint strength. If the adhesive is very duc- tile (more than 20% shear strain to failure) and the ad- herends are elastic, the joint strength is given by the load corresponding to the total adhesive plastic defor- mation. If the adherends yield, the joint strength is gov- erned the adherends yielding, independently of the type of adhesive. For the case of a rather brittle adhesive and elastic adherends, the methodology does not work and the authors propose to use the finite element method.
The objective of the present study was to quantify the influence of the adhesive, the adherend and the overlap on the lap shear strength by means of the Taguchi method [5,6] and to propose a simple predictive equa-
tion that contemplates any type of adhesive. Three adhe- sives (ductile, intermediate and brittle), three adherends (low strength steel, intermediate strength steel, and high strength steel), and three overlaps (12.5, 25, and 50 mm) were selected.
2. Experimental
The adhesives studied were a very ductile adhesive (Hysol EA 9361 from Loctite), a very brittle adhesive (Araldite AV138/HV998 from Huntsman) and an inter- mediate adhesive (Araldite 2011 from Huntsman). The technique described in the French standard NF T 76-142 [7] for producing plate specimens without porosity was used. Two millimetres plate specimens of the three ad- hesives were manufactured in a sealed mould and dog- bone specimens were machined from those plates after- wards according to BS 2782. Three specimens were test- ed for each adhesive under a cross head speed of 1 mm/min. The strain was measured using a specially de- signed non contacting technique for objects suffering high displacement fields, like in tensile tests, developed by Chousal [8,6]. Contacting extensometers tend to inter- fere with the mechanical behaviour of the adhesive [9]
and should be avoided when possible. Typical stress- strain curves of the adhesives are shown in Figure 1.
The mechanical properties of the adhesives are shown in Table 1.
The brittle adhesive AV138/HV998 properties present more scatter than the other adhesives because it is more sensitive to defects. However, the failure surface did not contain any noticeable void. The yield strength was cal- culated for a plastic deformation of 0.2%. The area un- der the stress-strain curve (UT) is an approximate value of the toughness [10]:
Figure 2. Single lap joints geometry (not to scale, dimen- sions in mm).
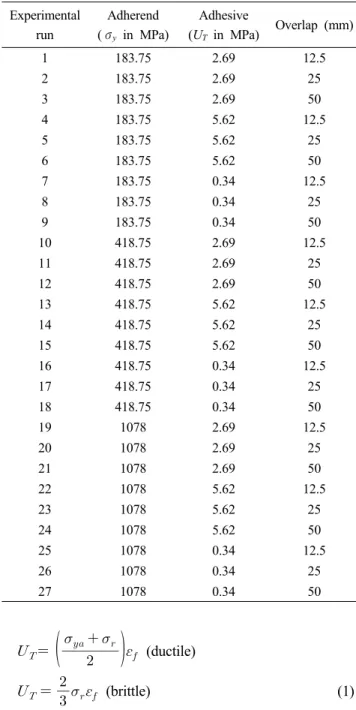
Table 2. Experimental plan based on Taguchi orthogonal array (L27)
Experimental run
Adherend (σy in MPa)
Adhesive
(UT in MPa) Overlap (mm)
1 183.75 2.69 12.5
2 183.75 2.69 25
3 183.75 2.69 50
4 183.75 5.62 12.5
5 183.75 5.62 25
6 183.75 5.62 50
7 183.75 0.34 12.5
8 183.75 0.34 25
9 183.75 0.34 50
10 418.75 2.69 12.5
11 418.75 2.69 25
12 418.75 2.69 50
13 418.75 5.62 12.5
14 418.75 5.62 25
15 418.75 5.62 50
16 418.75 0.34 12.5
17 418.75 0.34 25
18 418.75 0.34 50
19 1078 2.69 12.5
20 1078 2.69 25
21 1078 2.69 50
22 1078 5.62 12.5
23 1078 5.62 25
24 1078 5.62 50
25 1078 0.34 12.5
26 1078 0.34 25
27 1078 0.34 50
(ductile)
(brittle) (1)
where σya is the yield strength of the adhesive, σr is the ultimate tensile strength and εf is the failure strain.
To account the effect of the type of adhesive, it was decided to use its toughness determined by the area un- der the stress-strain curve (see Figure 1). This quantity describes best the type of adhesive as it includes the ef- fect of the strength as well as the ductility.
The single lap joints had an overlap of 12.5, 25 or 50 mm and a width of 25 mm (see geometry in Figure 2). The SLJs were manufactured individually in a mould and the adhesive thickness (0.2 mm) was controlled by packing shims. The steel substrates were grit blasted and degreased prior to bonding. The tensile shear tests were performed at a crosshead speed of 1 mm/min. Tab ends were used to improve alignment, as shown in Figure 2.
The adherends selected were a low strength steel (DIN St33) with σy = 183.8 MPa, a high strength steel (DIN C60 quenched in oil) with σy = 1078 MPa and an in- termediate strength steel (DIN C60 annealed) σy = 418.8 MPa.
In order to quantify separately the influence of the type of adhesive (toughness, UT), the adherend (yielding strength) and the overlap on the lap shear strength, the experimental design technique of Taguchi [11] was used.
An experimental orthogonal array (L27) of three levels with 27 experimental runs was designed. After assigning the variables (adhesive, adherend, overlap) to the col- umns of the L27 matrix and the respective values for each level, the experimental plan presented in Table 2 was obtained and repeated three times. The influence of each variable and the interactions between them was as- sessed by the average response and the analysis of var- iance (ANOVA). The statistical software Statview was used.
3. Lap Shear Strength Results
The experimental failure loads are presented in Figure 3. The simple design methodology proposed by Adams and Davies [4] is also represented. The load correspond- ing to the total plastic deformation of the adhesive is:
⋅⋅ (2)
where Fa is the failure load of the adhesive, τy is the shear yield strength of the adhesive, w is the joint width and l is the overlap length. The shear strength can be estimated from the tensile strength according to the foll- owing equation that comes from the von Mises criterion:
Figure 3. Experimental failure loads and theoretical predictions based on Adams and Davies [4].
(3)
The estimated shear strength, using Eq. 3 and the ten- sile strength presented in Table 1, was lower than the average shear strength given by the SLJs for adhesives Hysol EA 9361 and Araldite 2011. This is because the tensile strength value used for the failure load prediction was obtained at a strain rate much lower than the strain rate of the adhesive when tested in a SLJ. If the adhe- sive is relatively brittle and is at a temperature well be- low its glass transition temperature (Tg), then it is not very sensitive to strain rate effects, which is the case of adhesive AV138/HV998. However, if the adhesive is rel- atively close to its Tg, which is the case of the ductile and intermediate adhesives (Araldite 2011 and Hysol EA 9361), the material will be viscoelastic and very sensi- tive to strain rate effects [12]. Additional tensile tests
were carried out for adhesives Araldite 2011 and Hysol EA 9361 at a strain rate comparable to the strain rate of the SLJs. The load corresponding to the total plastic deformation given by Eq. 2 was obtained using the ten- sile strength obtained in these tests.
The direct tensile stress (σt) acting in the adherend due to the applied load F is
(4)
where ts is the adherend thickness. The stress at the in- ner adherend surface (σs) due to the bending moment M is
(5)
where M = kFts/2, according to Goland and Reissner [2].
The variable k is the bending moment factor which
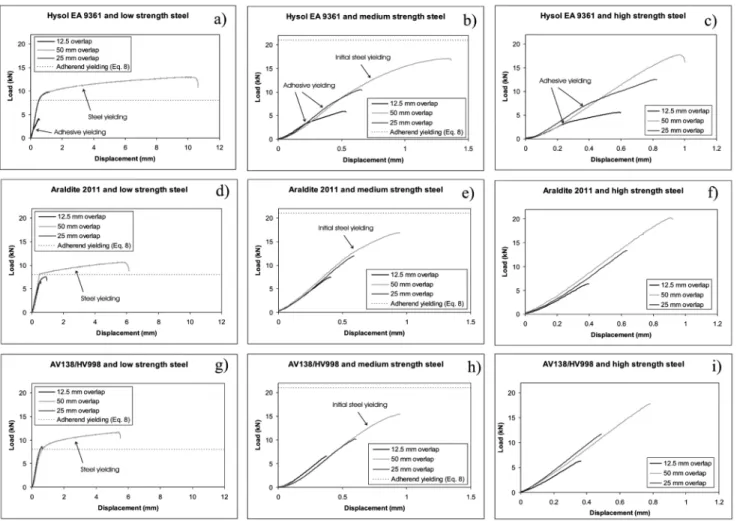
Figure 4. Load-displacement curves.
reduces (from unity) as the lap rotates under load. The stress acting in the adherend is the sum of the direct stress and the bending stress. Thus, the maximum load which can be carried which just creates adherend yield (Fs) is:
(6)
where σy is the yield strength of the adherend. For low loads and short overlaps, k is approximately 1.
Therefore, for such a case,
(7)
However, for joints which are long compared to the adherend thickness, such that l/ts ≥ 20, the value of k decreases and tends to zero. In this case, the whole of the cross-section yields and:
⋅⋅ (8)
The load-displacement curves (see Figure 4) and the failed joints (see Figure 5) show that the adherends of all the joints with 12.5 mm overlap did not yield. The load-displacement curves presented in Figure 4 contain the limit corresponding to the complete (the whole cross-section) adherend yielding (see Eq. 8). The adher- end yielding appears clearly in the load-displacement curves and is in accordance with Eq. 8. The adhesive deformation is negligible in comparison with that of the steel, except in the case of the ductile adhesive. Figure 4 indicates the adhesive yielding when it is easily identifiable. The adherends of the 25 mm overlap joints yielded just in the case of the low strength steel. The adherends of the 50 mm overlap joints yielded consid- erably for the low strength steel, slightly for the inter- mediate strength steel and not at all for the high strength steel (see Figure 4 and Figure 5). For short
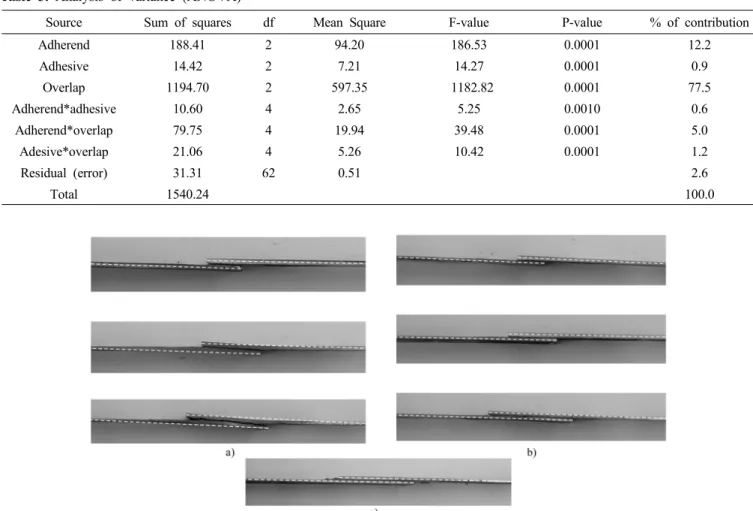
Table 3. Analysis of variance (ANOVA)
Source Sum of squares df Mean Square F-value P-value % of contribution
Adherend 188.41 2 94.20 186.53 0.0001 12.2
Adhesive 14.42 2 7.21 14.27 0.0001 0.9
Overlap 1194.70 2 597.35 1182.82 0.0001 77.5
Adherend*adhesive 10.60 4 2.65 5.25 0.0010 0.6
Adherend*overlap 79.75 4 19.94 39.48 0.0001 5.0
Adesive*overlap 21.06 4 5.26 10.42 0.0001 1.2
Residual (error) 31.31 62 0.51 2.6
Total 1540.24 100.0
Figure 5. Failed joints: a) low strength adherends; b) intermediate strength adherends; c) high strength steel.
overlaps (12.5 and 25 mm), the design methodology pro- posed by Adams and Davies [4] is quite accurate (see Figure 3). For longer overlaps (50 mm), the situation is more complex. For the intermediate strength adherends, the adherends yield only slightly (see Figure 4b)e)f) and Fig. 5b)). In this case, the failure load prediction based on the adherend yielding is not as accurate as in the case of the low strength steel because the failure is con- trolled not only by the adherend but also by the adhesive. When the adhesive is brittle (AV138/HV998) or not very ductile (Araldite 2011) and the adherends are elastic (see Figure 3f)i) and Figure 4f)i)), the failure load is unpredictable. If the adhesive is very ductile and the adherends are elastic (see Figure 3c) and Figure 4c)), the global adhesive yielding is applicable.
4. Statistical Analysis
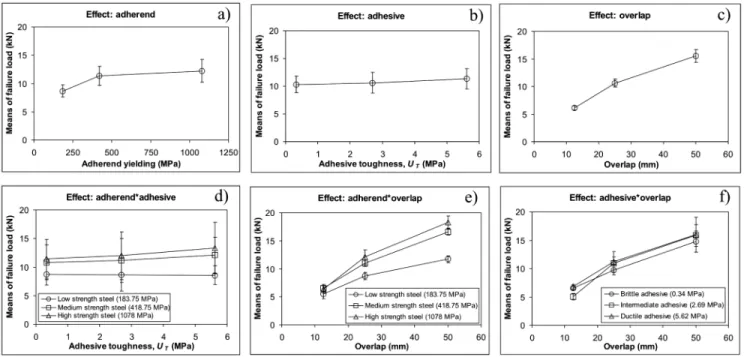
The analysis of variance (ANOVA) (see Table 3) of the experimental results gives the relative importance of the adhesive, the adherend, the overlap and the inter- actions between these variables. The effect of the over- lap is clearly the main factor influencing the failure load, followed by the adherend. Surprisingly, the adhe- sive has a relatively small effect on the failure load.
Note that the interactions substrate*adhesive, substrate*
overlap and adhesive*overlap must also be considered in statistical terms, especially the interaction adherend*
overlap.
The main effect of the adherend (and only) is shown in Figure 6a). As expected, the failure load increases with the adherend yield strength, but the variation is not linear and a plateau is reached. The main effect of UT
(and only) on the failure load is shown in Figure 6b).
Figure 6. Average response graphs with 95% error bars.
The adhesive toughness increases the failure but the ef- fect is not significant. Figure 6c) shows that the overlap and the failure load are nearly proportional. This result seems to contradict previous studies but it should be emphasized that the data shown in Figure 6c) was ob- tained with the Taguchi method which enables to sepa- rate the effect of each variable whereas other studies an- alysed the results as a whole taking into account all the variables at the same time.
Figure 6d) shows that for the low strength steel, the failure load is independent of the adhesive; for the inter- mediate strength steel, the failure load increases as the adhesive gets tougher and finally for the high strength steel this effect is even more pronounced. Therefore, the effect of the adhesive is not the same depending on the strength of the substrate, meaning that the variable 'ad- hesive' interacts with the variable ‘adherend’. The inter- action between two variables is defined graphically by the parallelism between the curves: the interaction de- creases as the curves get more parallel. The interaction adherend*adhesive presented in Figure 6d) shows that for low strength steel, the failure load is uniquely con- trolled by the adherend yielding. The adhesive influences the failure load if the adherends remain in the elastic range. The interaction adherend*overlap is presented in Figure 6e). The graph failure load vs. overlap is nearly
linear for the three types of adherend but the three lines are not parallel. The overlap effect increases as the ad- herend gets stronger. When the adherend is elastic, the adhesive can develop its full shear strength capacity and make use of the whole overlap. The interaction adhe- sive*adherend shown in Figure 6f) is not clear. This can be attributed to the fact that the failure load did not vary greatly with the type of adhesive.
The effect of the adherend and the overlap, which contribute 89.7% according to Table 3, were included in the prediction of the failure load according to Eq. 9 [13]:
(9) where FLpredict is the failure load prediction, M is the average failure load, is the effect of the overlap at the level i and is the effect of the type of adherend at level i. The effects of the adhesive and the inter- actions were not included in Eq. 9 because their con- tribution is not significant (see Table 3).
The values of and can be determined by the equation that best fits the points corresponding to the failure load vs adherend (see Figure 6a)) and the failure load vs overlap (see Figure 6c)) respectively. By doing so, the following expression is obtained:
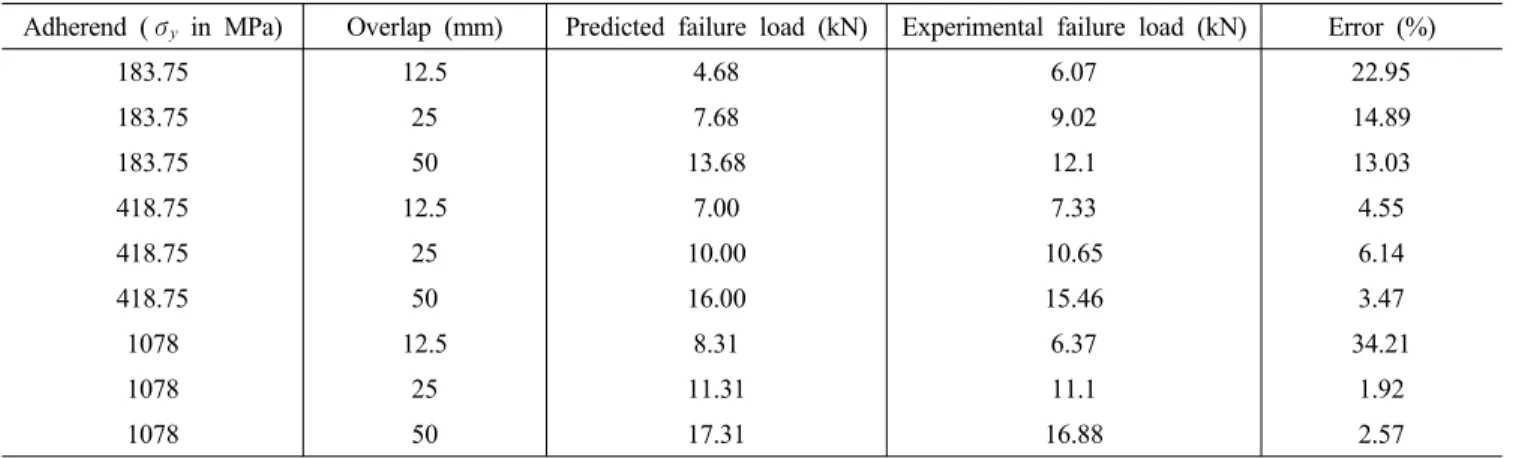
Table 4. Experimental validation of the statistical failure load prediction
Adherend (σy in MPa) Overlap (mm) Predicted failure load (kN) Experimental failure load (kN) Error (%)
183.75 12.5 4.68 6.07 22.95
183.75 25 7.68 9.02 14.89
183.75 50 13.68 12.1 13.03
418.75 12.5 7.00 7.33 4.55
418.75 25 10.00 10.65 6.14
418.75 50 16.00 15.46 3.47
1078 12.5 8.31 6.37 34.21
1078 25 11.31 11.1 1.92
1078 50 17.31 16.88 2.57
= 7.09 + 0.24OV + 13.32exp-76.86/A (10) where OV is the overlap in mm and A is the adherend yielding strength in MPa. Additional tests were carried out to validate the above equation with another adhesive (Hysol EA 9321 from Loctite). Tensile tests (1 mm/min) on dogbone specimens (σya = 21.99 MPa, σr = 45.97 MPa and εf = 3.8%) gave a toughness (UT) of 1.16 MPa. Table 4 shows that the predicted failure loads us- ing Eq. 10 compare well with the experimental failure loads. Note that when the adherends material or thick- ness change, Eq. 10 is not valid. A larger Taguchi ma- trix would be necessary to take into account these variables. Moreover, more adhesives should be tested to confirm that the adhesive has a negligible effect on the lap shear strength. However, this method shows that a statistical analysis can be an alternative method for the prediction of joint strength.
5. Conclusions
The effect of the adherend, the adhesive and the overlap on the lap shear strength was investigated in this study.
The adherends were 2 mm thick steel. The experimental results were statistically treated to quantify the effect of each variable and to give a failure load predictive equation. The following conclusions can be drawn:
1) The lap shear strength depends mainly on the over- lap and the adherend strength.
2) The lap shear strength is approximately proportional to the overlap.
3) The lap shear strength increases as the adherend yield strength increases.
4) The lap shear strength is practically independent of the adhesive toughness (UT).
5) The Taguchi method is a valid technique for lap shear strength prediction.
References
1. O. Volkersen, Luftfahrtforschung 15, 41 (1938).
2. M. Goland and E. Reissner, J. Appl. Mech., 66, A17 (1944).
3. L. J. Hart-Smith, NASA Contract Report, NASA CR-112235 (1973).
4. R. D. Adams and R. Davies, in: The mechanics of adhesion, D. A. Dillard and A. V. Pocius (Ed.), pp.
111-144, Elsevier, Amsterdam (2002).
5. G. Taguchi, S. Chowdhury, and S. Taguchi, Robust Engineering, McGraw-Hill, New York (2000).
6. L. F. M. da Silvạ, T. N. S. S. Rodrigues, M. A. V.
Figueiredo, M. F. S. F. de Moura, and J. A. G.
Chousal, ‘The effect of adhesive type and thickness on the lap shear strength’, J. Adhesion, submitted (2006).
7. L. F. M. da Silva, R. D. Adams, and M. Gibbs, Int. J. Adhes. Adhes., 24, 69 (2004).
8. J. A. Chousal and J. F. Gomes, Proc. M2D, 3rd International Conference on Mechanics & Materials in Design, Orlando, pp. 269-270 (2000).
9. L. F. M. da Silva and R. D. Adams, J. Adhesion Sci. Technol., 29, 109 (2005).
10. G. E. Dieter, Mechanical Metallurgy, McGraw-Hill, London (1988).
11. G. Taguchi and S. Konishi, Orthogonal Arrays and Linear Graphs, Asi Press, Dearborn, MI (1987).
12. I. M. Ward, Mechanical Properties of Solid Polymers, John Wiley & Sons, Chichester, UK (1979).
13. W. Y. Fowlkes and C. M. Creveling, Engineering Methods for Robust Product Design, Addison- Wesley, Reading, MA (1995).

![Figure 3. Experimental failure loads and theoretical predictions based on Adams and Davies [4]](https://thumb-ap.123doks.com/thumbv2/123dokinfo/5499859.451958/4.918.81.828.131.659/figure-experimental-failure-loads-theoretical-predictions-adams-davies.webp)