The Study of Genetic Diversity and Population Structure of the Korean Fleshy Shrimp, Fenneropenaeus chinensis, Using Newly Developed Microsatellite Markers
Eun-Ha Shin
1, Hee Jeong Kong
1, Bo-Hye Nam
1, Young-Ok Kim
1, Bong-Seok Kim
2, Dong-Gyun Kim
1, Cheul Min An
1, Hyungtaek Jung
1and Woo-Jin Kim
1*
1Biotechnology Research Division, National Fisheries Research and Development Institute, Busan 619-902, Korea
2Future Aquaculture Research Center, National Fisheries Research and Development Institute, Jeju 690-192, Korea Received September 21, 2015 /Revised November 3, 2015 /Accepted November 27, 2015
The fleshy shrimp, Fenneropenaeus chinensis, is the family of Penaeidae and one of the most econom- ically important marine culture species in Korea. However, its genetic characteristics have never been studied. In this study, a total of 240 wild F. chinensis individuals were collected from four locations as follows: Narodo (NRD, n = 60), Beopseongpo (BSP, n = 60), Chaesukpo (CSP, n = 60), and Cheon- suman (CSM, n = 60). Genetic variability and the relationships among four wild F. chinensis pop- ulations were analyzed using 13 newly developed microsatellite loci. Relatively high levels of genetic variability (mean allelic richness = 16.87; mean heterozygosity = 0.845) were found among localities.
Among the 52 population loci, 13 showed significant deviation from the Hardy–Weinberg equilibrium. Neighbor-joining, principal coordinate, and molecular variance analyses revealed the presence of three subpopulations (NRD, CSM, BSP and CSP), which was consistent with clustering based on genetic distance. The mean observed heterozygosity values of the NRD, CSM, BSP, and CSP populations were 0.724, 0.821, 0.814, and 0.785 over all loci, respectively. These
genetic variability and differentiationresults
of the four wild populations can be applied for future genetic improvement us- ing selective breeding and to design suitable management guidelines for KoreanF. chinensis culture.
Key words :
Fleshy shrimp, Fenneropenaeus chinensis, genetic variability, microsatellite loci, population structure
*Corresponding author
*Tel : +82-51-720-2465, Fax : +82-51-720-2456
*E-mail : [email protected]
This is an Open-Access article distributed under the terms of the Creative Commons Attribution Non-Commercial License (http://creativecommons.org/licenses/by-nc/3.0) which permits unrestricted non-commercial use, distribution, and reproduction in any medium, provided the original work is properly cited.
Journal of Life Science 2015 Vol. 25. No. 12. 1347~1353 DOI : http://dx.doi.org/10.5352/JLS.2015.25.12.1347
Introduction
The fleshy shrimp, Fenneropenaeus chinensis, is an econom- ically important species in the family Penaeidae. F. chinensis is distributed from the west coast of the Korean Peninsula to the east coast of northern China [3] and is characterized by long-distance migrations of up to 2,000 km between spawning and feeding sites [18]. The F. chinensis South Korean aquaculture industry started in 1960, and production increased very quickly to reach 1,533 metric tons in 1997.
However, a white spot syndrome virus (WSSV) disease out- break decreased production dramatically to about 998 metric tons in 1998 [13]. Disease outbreaks cause mass mortality among cultured F. chinensis worldwide, particularly in Asian
countries. To solve this problem, F. chinensis was replaced with Litopenaeus vannamei as the major cultured species in South Korea in 2003 [11], but damage to shrimp farming associated with WSSV has been increasing in recent years.
The West Sea Mariculture Research Center (Taean, Korea) conducts a breeding program to produce shrimp strains that are more resistant to WSSV. If a large number of cultured shrimp are released from aquaculture facilities, they could alter the genetic composition of wild populations by either displacing them or interbreeding. This could reduce the pop- ulation’s ability to adapt to new environments. Accordingly, basic knowledge about the geographic distribution, genetic diversity, and population differences of F. chinensis is important. It is now widely recognized that this information can be obtained through recently developed molecular ge- netics techniques. However, few reports have been pub- lished about F. chinensis population genetics in South Korea.
Because microsatellite markers and simple sequence re-
peats have high levels of polymorphism, co-dominant in-
heritance, genome-wide distributions, and high reproduci-
bility, they have been applied widely in population genetics,
Fig. 1. Sampling sites ( ) for the four wild Fenneropenaeus chi- nensis populations: Narodo (NRD); Beopseongpo (BSP);
Chaesukpo (CSP); and Cheonsuman (CSM).
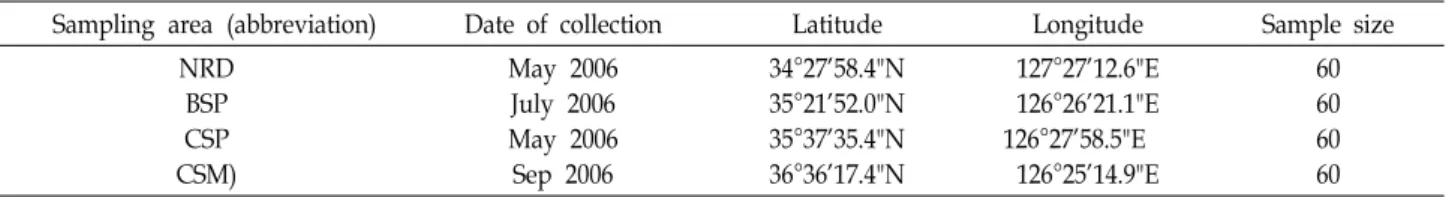
Table 1. Geographic area, location, abbreviation, locality, collection date, and sample size collected
Sampling area (abbreviation) Date of collection Latitude Longitude Sample size NRD
BSP CSP CSM)
May 2006 July 2006 May 2006 Sep 2006
34°27'58.4"N 35°21'52.0"N 35°37'35.4"N 36°36'17.4"N
127°27'12.6"E 126°26'21.1"E 126°27'58.5"E
126°25'14.9"E
60 60 60 60 NRD, Narodo; BSP, Beopseongpo; CSP, Chaesukpo; CSM, Cheonsuman
genetic linkage map, genetic diversity, and phylogenetic studies [10, 16]. However, only a few microsatellite markers can be used for each shrimp species because of poor con- servation of the microsatellite flanking sequences among dif- ferent crustacean species, particularly in F. chinensis [15, 27].
Several microsatellite markers have been isolated from F. chi- nensis [5, 9, 24]. Unfortunately, despite the commercial im- portance of this shrimp species in Korea, studies describing its genetic background are scarce. In the present study, we assessed genetic diversity within and among wild Korean F. chinensis populations and examined the genetic structure among these populations using new microsatellite DNA markers.
Materials and Methods
Sample collection and DNA preparation
A total of 240 wild F. chinensis individuals were collected from four locations as follows: Narodo (NRD, n=60), Beop- seongpo (BSP, n=60), Chaesukpo (CSP, n=60), and Cheonsu- man (CSM, n=60) (Fig. 1 and Table 1). All muscle tissue sam- ples were stored in 100% ethanol prior to DNA extraction.
The tissue was homogenized in lysis buffer (MFX-2000;
Toyobo, Osaka, Japan) containing 20 mg/ml proteinase K.
Total DNA was isolated using the MagExtractor MFX-6100 automated DNA extraction system (Toyobo Co., Tokyo, Japan). The extracted genomic DNA was quantified using a Nanodrop ND-1000 spectrophotometer (Thermo Fisher Scientific, Barrington, IL, USA) and stored at -20°C until use.
Polymerase chain reaction (PCR) and microsatellite genotyping
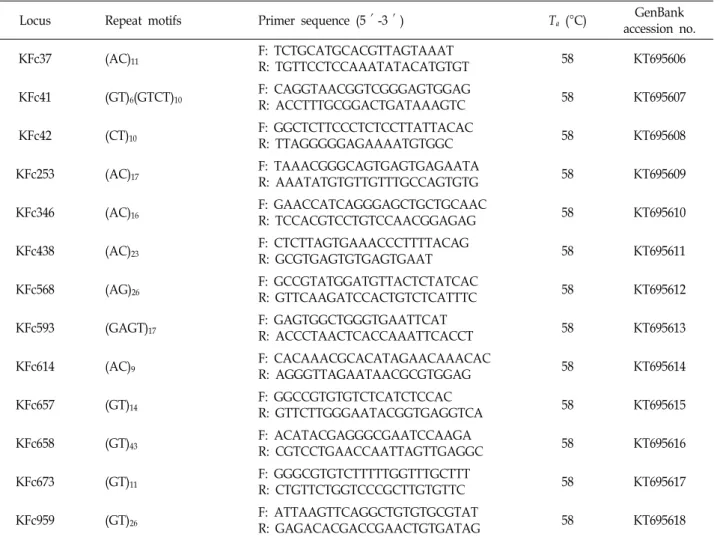
Thirteen microsatellite loci that were amplified in F. chi- nensis were used in this study. Detailed information about the primers is presented in Table 2. Each PCR contained three primer sets that were labeled at the 5‘ end of the for- ward primer with 6-FAM, HEX, or NED dyes (Applied Biosystems, Foster City, CA, USA). PCR amplification was carried out in a 10-μL reaction mixture containing 0.25 U Ex-Taq DNA polymerase (TaKaRa Biomedical Inc., Shiga, Japan), 1× PCR buffer, 0.2 mM dNTP mix, 10 pM of each primer, and 100 ng template DNA, using the PTC 200 DNA Engine (MJ Research, Waltham, MA, USA). The PCR con- ditions were: 5 min at 95°C, followed by 35 cycles of 30 sec at 95°C, 45 sec at 58°C, and 45 sec at 72°C, with a final ex- tension of 10 min at 72°C. Microsatellite polymorphisms were screened using an ABI PRISM 3130 XL automated DNA sequencer (Applied Biosystems), and alleles were des- ignated according to PCR product size relative to molecular size markers (GENESCAN 400 HD [ROX]; Applied Biosystems).
Statistical analysis
The number of samples (n), expected heterozygosity (He),
and observed heterozygosity (Ho) were calculated using the
Arlequin software package (ver. 3.0; [8]). Tests for allelic
richness (A
R), number of alleles per locus (Na), and devia-
tions from Hardy–Weinberg equilibrium (HWE) were esti-
mated using GENEPOP ver. 4.0 (http://kimura.univ-
montp2. fr/~rousset/Genepop.htm), and the adjusted P-val-
ues for both analyses were obtained using a sequential
Bonferroni test for multiple comparisons. MICRO-CHECKER
2.2.3 was used to test for the presence of null alleles. F
STTable 2. The 13 Fenneropenaeus chinensis microsatellite loci used in this study, with primer sequences, repeat motifs, and annealing temperatures (Ta) for polymerase chain reaction amplification
Locus Repeat motifs Primer sequence (5′-3′) Ta (°C) GenBank
accession no.
KFc37 (AC)11 F: TCTGCATGCACGTTAGTAAAT
R: TGTTCCTCCAAATATACATGTGT 58 KT695606
KFc41 (GT)6(GTCT)10 F: CAGGTAACGGTCGGGAGTGGAG
R: ACCTTTGCGGACTGATAAAGTC 58 KT695607
KFc42 (CT)10 F: GGCTCTTCCCTCTCCTTATTACAC
R: TTAGGGGGAGAAAATGTGGC 58 KT695608
KFc253 (AC)17 F: TAAACGGGCAGTGAGTGAGAATA
R: AAATATGTGTTGTTTGCCAGTGTG 58 KT695609
KFc346 (AC)16 F: GAACCATCAGGGAGCTGCTGCAAC
R: TCCACGTCCTGTCCAACGGAGAG 58 KT695610
KFc438 (AC)23 F: CTCTTAGTGAAACCCTTTTACAG
R: GCGTGAGTGTGAGTGAAT 58 KT695611
KFc568 (AG)26 F: GCCGTATGGATGTTACTCTATCAC
R: GTTCAAGATCCACTGTCTCATTTC 58 KT695612
KFc593 (GAGT)17 F: GAGTGGCTGGGTGAATTCAT
R: ACCCTAACTCACCAAATTCACCT 58 KT695613
KFc614 (AC)9 F: CACAAACGCACATAGAACAAACAC
R: AGGGTTAGAATAACGCGTGGAG 58 KT695614
KFc657 (GT)14 F: GGCCGTGTGTCTCATCTCCAC
R: GTTCTTGGGAATACGGTGAGGTCA 58 KT695615
KFc658 (GT)43 F: ACATACGAGGGCGAATCCAAGA
R: CGTCCTGAACCAATTAGTTGAGGC 58 KT695616
KFc673 (GT)11 F: GGGCGTGTCTTTTTGGTTTGCTTT
R: CTGTTCTGGTCCCGCTTGTGTTC 58 KT695617
KFc959 (GT)26 F: ATTAAGTTCAGGCTGTGTGCGTAT
R: GAGACACGACCGAACTGTGATAG 58 KT695618
values (1,000 permutations; [25]) were calculated using Arlequin 3.0. The population structure patterns were further investigated using a model-based Bayesian clustering proce- dure in STRUCTURE (ver. 2.3; [21]), which assigns in- dividuals to K populations based on their multilocus genotype. STRUCTURE was run for K = 2 using a burn-in length of 50,000 and a run of 50,000 steps. The overall in- breeding coefficient (F
IS; [25]) was also estimated using GENEPOP ver. 4.0. Analysis of molecular variance (AMOVA;
[7]) was used to test for population structure with Arlequin 3.0. A principal coordinate analysis (PCoA) was performed using GENALEX (ver. 6.0; [19]). A neighbor-joining (NJ) tree was constructed based on the chord distances (D
CE; [2]) to evaluate the genetic population relationships using the POPULATION program (ver. 1.2.30). Bootstrap values were calculated using 1,000 replicates.
Results and Discussion
Genetic variability
Microsatellite markers have been used in various shrimp species, and the pedigree of mixed populations can be de- termined using a few microsatellite markers [14]. However, little information is available on the use of microsatellite markers in F. chinensis [27] for understanding population structure or genetic diversity [15]. In this study, F. chinensis, a commercially and recreationally valuable species, were col- lected from the west coast of the Korean Peninsula (four sep- arate collections in 2006) to illuminate its population struc- ture and genetic diversity.
The genetic variability indices for the four populations
are summarized in Table 3. Allelic richness per locus (A
R)
ranged from 3 to 31 across all populations. Mean A
Rvalues
were in the following order: NRD (16.2), CSM (17.5), BSP
(16.8), and CSP (16.9). The total number of alleles per locus
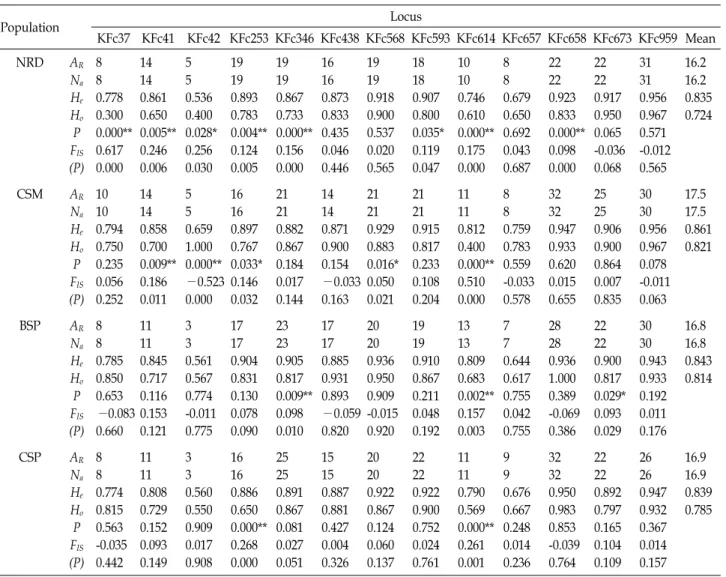
Table 3. Allelic variability at 13 microsatellite loci surveyed in the four Fenneropenaeus chinensis populations
Population Locus
KFc37 KFc41 KFc42 KFc253 KFc346 KFc438 KFc568 KFc593 KFc614 KFc657 KFc658 KFc673 KFc959 Mean
NRD AR
Na
He
Ho
P FIS
(P) 8 8 0.778 0.300 0.000**
0.617 0.000
14 14 0.861 0.650 0.005**
0.246 0.006
5 5 0.536 0.400 0.028*
0.256 0.030
19 19 0.893 0.783 0.004**
0.124 0.005
19 19 0.867 0.733 0.000**
0.156 0.000
16 16 0.873 0.833 0.435 0.046 0.446
19 19 0.918 0.900 0.537 0.020 0.565
18 18 0.907 0.800 0.035*
0.119 0.047
10 10 0.746 0.610 0.000**
0.175 0.000
8 8 0.679 0.650 0.692 0.043 0.687
22 22 0.923 0.833 0.000**
0.098 0.000
22 22 0.917 0.950 0.065 -0.036 0.068
31 31 0.956 0.967 0.571 -0.012 0.565
16.2 16.2 0.835 0.724
CSM AR
Na
He
Ho
P FIS
(P) 10 10 0.794 0.750 0.235 0.056 0.252
14 14 0.858 0.700 0.009**
0.186 0.011
5 5 0.659 1.000 0.000**
−0.523 0.000
16 16 0.897 0.767 0.033*
0.146 0.032
21 21 0.882 0.867 0.184 0.017 0.144
14 14 0.871 0.900 0.154
−0.033 0.163
21 21 0.929 0.883 0.016*
0.050 0.021
21 21 0.915 0.817 0.233 0.108 0.204
11 11 0.812 0.400 0.000**
0.510 0.000
8 8 0.759 0.783 0.559 -0.033 0.578
32 32 0.947 0.933 0.620 0.015 0.655
25 25 0.906 0.900 0.864 0.007 0.835
30 30 0.956 0.967 0.078 -0.011 0.063
17.5 17.5 0.861 0.821
BSP AR
Na
He
Ho
P FIS
(P) 8 8 0.785 0.850 0.653
−0.083 0.660
11 11 0.845 0.717 0.116 0.153 0.121
3 3 0.561 0.567 0.774 -0.011 0.775
17 17 0.904 0.831 0.130 0.078 0.090
23 23 0.905 0.817 0.009**
0.098 0.010
17 17 0.885 0.931 0.893
−0.059 0.820
20 20 0.936 0.950 0.909 -0.015 0.920
19 19 0.910 0.867 0.211 0.048 0.192
13 13 0.809 0.683 0.002**
0.157 0.003
7 7 0.644 0.617 0.755 0.042 0.755
28 28 0.936 1.000 0.389 -0.069 0.386
22 22 0.900 0.817 0.029*
0.093 0.029
30 30 0.943 0.933 0.192 0.011 0.176
16.8 16.8 0.843 0.814
CSP AR
Na
He
Ho
P FIS
(P) 8 8 0.774 0.815 0.563 -0.035 0.442
11 11 0.808 0.729 0.152 0.093 0.149
3 3 0.560 0.550 0.909 0.017 0.908
16 16 0.886 0.650 0.000**
0.268 0.000
25 25 0.891 0.867 0.081 0.027 0.051
15 15 0.887 0.881 0.427 0.004 0.326
20 20 0.922 0.867 0.124 0.060 0.137
22 22 0.922 0.900 0.752 0.024 0.761
11 11 0.790 0.569 0.000**
0.261 0.001
9 9 0.676 0.667 0.248 0.014 0.236
32 32 0.950 0.983 0.853 -0.039 0.764
22 22 0.892 0.797 0.165 0.104 0.109
26 26 0.947 0.932 0.367 0.014 0.157
16.9 16.9 0.839 0.785
Allelic richness (AR), number of alleles per locus (Na), expected heterozygosity (He), observed heterozygosity (Ho), inbreeding co- efficient (FIS), and probability of significant deviation from Hardy–Weinberg equilibrium (P) are given for each population and locus. *P < 0.05; **P < 0.01. Calculations assume that individuals with one microsatellite band are homozygous for the allele. NRD, Narodo; BSP, Beopseongpo; CSP, Chaesukpo; CSM, Cheonsuman
(N
a) ranged from 3 to 31. KFcg959 had the highest A
Rand N
avalues in the NRD population. Mean N
aranged from 16.2 to 17.5. The mean expected and observed heterozygosities ranged from 0.835 to 0.861 and from 0.724 to 0.821, respectively. Mean heterozygosity was highest in CSM (H
e= 0.861, H
o= 0.821), followed by BSP (H
e= 0.843, H
o= 0.814), CSP (H
e= 0.839, H
o= 0.785), and NRD (H
e= 0.835, H
o= 0.724). The mean H
evalue was higher than the mean H
oval- ue in all populations. Among the 52 population-locus cases (4 populations × 13 loci), 13 cases showed significant devia- tions (p<0.01). All populations departed from HWE at the KFcg614 locus. The NRD population departed from HWE at 6 of the 13 microsatellite loci, and the CSM, BSP, and CSP populations departed from HWE at three, two, and two
microsatellite loci, respectively. The F
ISvalue estimated for all populations at the KFcg614 locus was significantly differ- ent from zero (p<0.05); all populations were in an excess het- erozygosity condition for the KFc673 and KFc959 loci in NRD, the KFc42, KFc438, KFc657, and KFc959 loci in CSM;
the KFc37, KFc42, KFc438, KFc568, and KFc658 loci in BSP;
and the KFc37 and KFc658 loci in CSP.
Our results reveal that the newly developed microsatellite
markers were a powerful approach to monitoring genetic
diversity between the four geographically different wild
Korean F. chinensis populations investigated. Heterozygosity
is an important measure of population diversity at the genet-
ic level. The mean observed heterozygosity values of the
NRD, CSM, BSP, and CSP populations were 0.724, 0.821,
Table 4. Pairwise FST estimates (below the diagonal) and Cavalli-Sforza and Edwards’s chord distance (DCE, above the diagonal) between the four Fenneropenaeus chinensis populations
NRD CSM BSP CSP
NRD CSM BSP CSP
- 0.0213*
0.0227*
0.0270*
0.1864 - 0.0132*
0.0169*
0.3030 0.0991
- -0.0007
0.3582 0.1216 0.0380
- Significance was tested at the 5% level with the Bonferroni cor- rection applied for multiple tests. *p<0.05. Pairwise FST (Weir and Cockerham, 1984) and DCE distance (Cavalli-Sforza and Edwards, 1967) are measures of genetic differentiation and ge- netic distance between populations, respectively. NRD, Narodo;
BSP, Beopseongpo; CSP, Chaesukpo; CSM, Cheonsuman
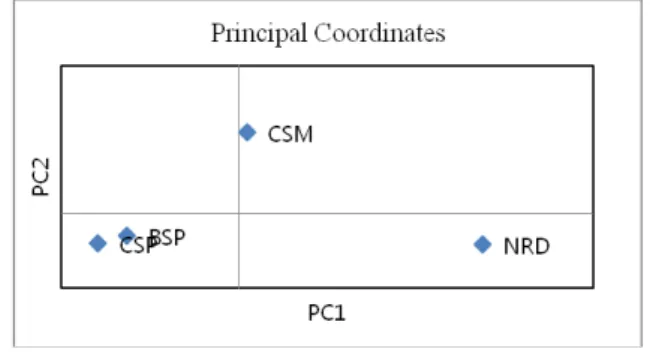
Fig. 2. Principal coordinates analysis to determine the relation- ships among the wild Fenneropenaeus chinensis pop- ulation based on chord distance (Cavalli-Sforza and Edwards, 1967).
Fig. 3. Neighbor-joining tree illustrating the relationships be- tween the four Fenneropenaeus chinensis populations based on the Cavalli-Sforza and Edwards chord distance.
0.814, and 0.785 over all loci, respectively. These values were lower than the mean expected heterozygosity for the four populations. The overall heterozygosity in this study was high and differed from the reported mean heterozygosity, which is known to be low (7.3%), within crustacean pop- ulations as a whole [12].
In the present study, 18 of the 52 population-locus cases deviated significantly from HWE after applying the Bonfer- roni correction. However, the KFc37, KFc41, and KFc42 loci in the NRD; the KFc614 locus in the CSM; and the KFc614 locus in the CSP population also deviated from HWE with- out excess heterozygosity. These deviations may have been caused by selection, population mixing, nonrandom mating, presence of null alleles, or the limited sample size used in our analysis [20, 22]. The presence of null alleles, for exam- ple, is a classical source affecting the accuracy of micro- satellite loci during parentage assignment [1] and null allele frequencies > 5% can compromise pedigree estimates [17].
Genetic differentiation between the four populations F
STis the proportion of total genetic diversity that sepa- rates groups, and values range from 0 to 1. If there is no population substructure (i.e., no stable groups), F
STwill ap- proach 0. An F
STrange of 0.00-0.05 indicates little genetic differentiation [26]. Significant pairwise F
STvalues (p<0.05) were observed between the NRD and CSM, NRD and BSP, NRD and CSP, CSM and BSP, and CSM and CSP pop- ulations (Table 4). In our study, pairwise F
STtests detected low levels of genetic differentiation among the populations, particularly between the CSP and BSP populations, indicat-
ing that a geographical barrier was not effectively maintain- ing genetic integrity among the populations in the four areas.
Genetic distances (D
CE) were also calculated for all possi- ble population pairs. The D
CEmeasure ranged from 0.0380 to 0.3582. The smallest estimate for D
CEwas between BSP and CSP (0.0380), whereas the highest estimate was between NRD and CSP (0.3582); the genetic distances between NRD and CSM, NRD and BSP, CSM and BSP, and CSM and CSP were 0.1864, 0.3030, 0.0991, and 0.1216, respectively (Table 4). The result of the genetic distances among the F. chinensis populations was further confirmed by the findings of PCoA (Fig. 2). The NJ tree constructed based on D
CE, indicated that the four populations were allocated into three major groups (Fig. 3); that is, one group included the CSM population, one group included the BSP and CSP populations, and one group included the NRD population. The PCoA produced a result similar to that of the cluster analysis (Fig. 3) and showed clear separation of the four populations into three clusters.
The results of hierarchical AMOVA tests to form putative
groups estimated from each NJ tree topology provided addi-
tional evidence to support previous findings in F. chinensis
populations. The NJ tree topology included a group for the
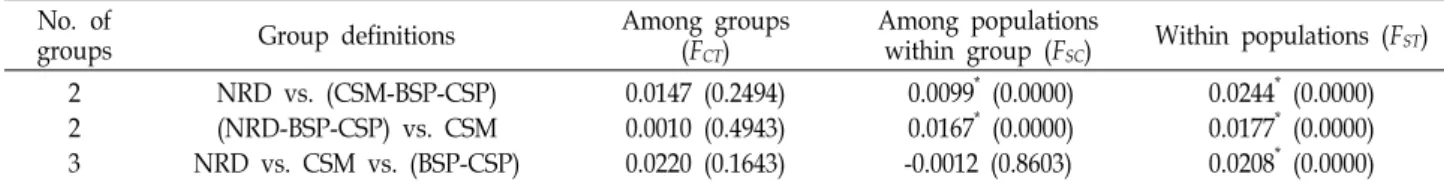
Table 5. Hierarchical analysis of molecular variance results for groups with several combinations of populations No. of
groups Group definitions Among groups
(FCT)
Among populations
within group (FSC) Within populations (FST) 2
2 3
NRD vs. (CSM-BSP-CSP) (NRD-BSP-CSP) vs. CSM NRD vs. CSM vs. (BSP-CSP)
0.0147 (0.2494) 0.0010 (0.4943) 0.0220 (0.1643)
0.0099* (0.0000) 0.0167* (0.0000) -0.0012 (0.8603)
0.0244* (0.0000) 0.0177* (0.0000) 0.0208* (0.0000) Probability values associated with F statistics are shown in parentheses. F statistic significantly greater than zero. * p<0.05. NRD, Narodo; BSP, Beopseongpo; CSP, Chaesukpo; CSM, Cheonsuman
NRD population and another group for the CSM, BSP, and CSP populations. In this case, the fixation index among groups (F
CT) was not significant (F
CT=0.0147, P=0.2494), whereas it was significant among populations within groups (F
SC=0.0099, P=0.0000). The NJ tree topology defined a group that included the NRD, BSP, and CSP populations and an- other group that included the CSM population. In this case, the fixation index among groups (F
CT) was not significant (F
CT=0.0010, P=0.4943), whereas it was significant among populations within groups (F
SC=0.0167, P=0.0000). These re- sults suggest that the populations remained structured with- in at least one group in each test case, as the F
SCvalues estimated in both test cases were significant. Therefore, we separated them into three groups. The first group included the NRD population, the second included the CSM pop- ulation, and the third included the BSP and CSP populations.
These results show that the fixation index among groups (F
CT=0.0220, P=0.1643), and among populations within groups (F
SC=-0.0012, P=0.8603), were not significant (Table 5). The NJ tree topology and AMOVA results suggest that the four populations could be assigned to a group that in- cluded the NRD population, a group that included the CSM population, and a group that included the BSP and CSP pop- ulations (Table 5). An evaluation of the evolutionary rela- tionships among the four wild populations showed that BSP and CSP had the highest degree of genetic identity, followed by CSM and BSP, CSM and CSP, NRD and CSM, and NRD and BSP, whereas NRD and CSP were most distantly related.
A previous study demonstrated the most likely explanation for this result is that wild populations of Chinese F. chinensis, which are extensively distributed in the Yellow and Bohai Seas, are two independent populations [15]. These two pop- ulations share the same wintering ground that lies in the mid-depth waters of the Yellow Sea [4]. An independent population of F. chinensis has been found off the west and south coasts of the Korean Peninsula [18]; thus, further at- tempts are necessary to evaluate the genetic population rela- tionships in this species. The goal of this study was to exam-
ine the importance of conservation and further genetic im- provements in wild Korean F. chinensis. Information on ge- netic variation and differentiation in these four wild pop- ulations can be applied for future genetic improvement thor- ough selective breeding and to design suitable management guidelines for Korean F. chinensis.
Acknowledgments
The authors would like to acknowledge the help provided by Dr. Litticia Bryant at Queensland University of Technol- ogy in regard to constructive comments on the manuscript.
This work was supported by a grant from the National Fisheries Research and Development Institute (R2015038).
References
1. Castro, J., Bouza, C., Presa, P., Pino-Querido, A., Riaza, A., Ferreiro, I., Sanchez, L. and Martines, P. 2004. Potential sour- ces of error in parentage assessment of turbot (Scophthalmus maximus) using microsatellite loci. Aquaculture 242, 119-135.
2. Cavalli-Sforza, L. L. and Edwards, A. W. 1967. Phylogenetic analysis. Models and estimation procedures. Am. J. Hum.
Genet. 19, 233-257.
3. Deng, J. Y., Kang, Y. D. and Jiang, Y. W. 1983. A summary of surveys of the Penaeid shrimp spawning ground in the Bohai Bay. Mar. Fish. Res. 5, 17-23.
4. Deng, J. Y., Ye, C. C. and Liu, Y. C. 1990. Penaeus chinensis in the Bohai and Yellow seas. pp. 48-91. In: Deng, J. Y. (eds.), its biology and management. Ocean Press, Beijing, China.
5. Dong, S., Kong, J., Zhang, T., Meng, X. and Wang, R. 2006.
Parentage determination of Chinese shrimp (Fenneropenaeus chinensis) based on microsatellite DNA markers. Aquaculture 258, 283-288.
6. Dong, S., Kong, J., Meng, X., Zhang, Q., Zhang, T. and Wang, R. 2008. Microsatellite DNA markers associated with resistance to WSSV in Penaeus (Fenneropenaeus) chinensis.
Aquaculture 282, 138-141.
7. Excoffier, L., Smouse, P. E. and Quattro, J. M. 1992. Analysis of molecular variance inferred from metric distances among DNA haplotypes: application to human mitochondrial DNA restriction data. Genetics 131, 479-491.
초록:새로 개발한 미세위성체 마커를 이용한 한국 대하의 유전다양성 및 집단구조
신은하
1․공희정
1․남보혜
1․김영옥
1․김봉석
2․김동균
1․안철민
1․정형택
1․김우진
1*
(1국립수산과학원 생명공학과, 2국립수산과학원 미래양식연구센터)
대하(Fenneropenaeus chinensis)는 우리나라에서 경제적으로 가장 중요한 양식생물 중 하나이다. 그러나 대하의 유전적 특성에 대한 연구는 전무하다. 본 연구에서는 새로 개발된 13개 미세위성체 유전자좌를 이용하여 우리나 라에 서식하는 4개 지역 대하의 유전 다양성 및 집단간 관련성을 분석하였다. 평균 대립유전자 richness =16.87, 평균 이형접합률 =0.845를 보여 유전 다양성은 비교적 높은 수준을 보였다. 52개 유전좌중에서 13개 유전자좌가 집단간 분석에서 Hardy–Weinberg 평형에서 유의적인 차이로 벗어났다. Neighbor-joining, principal coordinate 및 molecular variance 분석 결과로 우리나라 대하 집단은 3개 집단(나라도, 천수만, 법성포 및 채석포)으로 구성되 어 있으며, 이 결과는 유전적 거리에 근거한 군집 결과와 일치하였다. 본 연구에서 조사된 유전 다양성 및 분화 결과는 앞으로 대하의 지속 가능한 자원관리 및 선발 육종을 통한 유전적 개량에 적용될 수 있을 것이다.
8. Excoffier, L., Laval, G. and Schneider, S. 2005. Arlequin (version 3.0): an integrated software package for population genetics data analysis. Evol. Bioinform 1, 47-50.
9. Gao, H., Kong, J., Yan, B., Yu, F., Luan, S. and Cai, S. 2008.
Twelve new microsatellite markers for the Chinese shrimp Fenneropenaeus chinensis. Mol. Ecol. Resour. 8, 325-327.
10. Goldstein, D. G. and Pollock, D. D. 1997. Launching micro- satellites: a review of mutation processes and methods of phylogenetic inference. J. Hered. 88, 335-342.
11. Jang, I. K., Jun, J. C., Jo, G. J., Cho, Y. R., Seo, H. C., Kim, B. L. and Kim, J. S. 2007. Polyculture of fleshy shrimp Fenneropenaeus chinensis and white shrimp Litopenaeus vanna- mei with river puffer Takifugu obscurus in shrimp ponds. J.
Aquacul. 20, 278-288.
12. Hedgecock, D., Tracey, M. L. and Nelson, K. 1982. Genetics.
pp. 284-403. In: Abele, L. G. (eds.), the Biology of Crustacea.
Academic Press, New York.
13. Heo, M. S. 2005. Characterization of the white spot syn- drome baculovirus (WSBV) infection in fresh shrimp, Penaeus chinensis, cultured in Korea. J. Life Sci. 15, 248-252.
14. Herbinger, C. M., Doyle, R. W., Pitman, E. R., Paquet, D., Mesa, K. T., Morris, D. B., Wright, J. M. and Cook, D. 1995.
DNA fingerprint based analysis of parental and maternal effects on offspring growth and survival in communally reared rainbow trout. Aquaculture 137, 245-256.
15. Liu, P., Meng, X. H., Kong, J., He, Y. Y. and Wang, Q. Y.
2006. Polymorphic analysis of microsatellite DNA in wild populations of Chinese shrimp (Fenneropenaeus chinensis).
Aquac. Res. 37, 556-562.
16. Liu, Z. J. and Cordes, J. F. 2004. DNA marker technologies and their applications in aquaculture genetics. Aquaculture 238, 1-37.
17. Marshall, T. C., Slate, J., Kruuk, L. E. B. and Pemberton, J. M. 1998. Statistical confidence for likelihood-based pater-
nity inference in natural populations. Mol. Ecol. 7, 639-655.
18. Meng, X. H., Wang, Q. Y., Jang, I. K., Liu, P. and Kong, J. 2009. Genetic differentiation in seven geographic pop- ulations of the fleshy shrimp Penaeus (Fenneropenaeus) chi- nensis based on microsatellite DNA. Aquaculture 287, 46-51.
19. Peakall, R. and Smouse, P. E. 2006. GENALEX 6; genetic analysis in excel. Population genetic software for research and teaching. Mol. Ecol. Notes 6, 288-295.
20. Pemberton, J. M., Slate, J., Bancroft, D. R. and Barrett, J.
A. 1995. Non amplifying alleles at microsatellite loci: a cau- tion for parentage and population studies. Mol. Ecol. 4, 249-252.
21. Pritchard, J. K., Wen, X. and Falush, D. 2007. Documentation for structure software: version 2.2. University of Chicago, Chicago, 1-36.
22. Rousset, F. and Raymond, M. 1995. Testing heterozygote excess and deficiency. Genetics 140, 1413-1419.
23. Wang, H., Li, F., Xiang, J., Zhang, C. and Yu, K. 2008.
Microsatellite-centromere distances and microsatellite diver- sity in different ploidy classes of Chinese shrimp (Fenner- openaeus Chinensis). Genetica 132, 43-50.
24. Wang, X., Guo, X., Zhang, Y., Meng, X., Qiu, X., Liu, S.
and Zhang, T. 2009. Development of polymorphic EST-de- rived SSR markers for the shrimp, Fenneropenaeus chinensis.
Conserv. Genet. 10, 1455-1457.
25. Weir, B. S. and Cockerham, C. C. 1984. Estimating F-sta- tistics for the analysis of population structure. Evolution 38, 1358-1370.
26. Wright, S. 1998. Evolution and the genetics of population, variability within and among natural populations. The University of Chicago Press, Chicago.
27. Xu, P., Zhou, L. H. and Xiang, J. H. 2001. Isolating micro- satellite DNA of Chinese shrimp Penaeus chinensis. Oceanol.
Limnol. Sin. 32, 255-259.